

银行风控模型
一、神经网络:
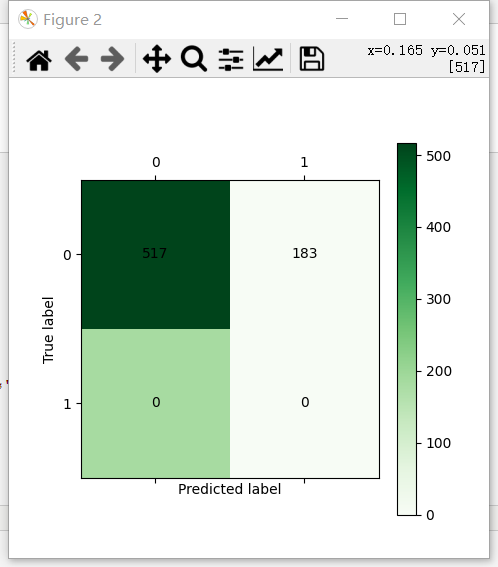
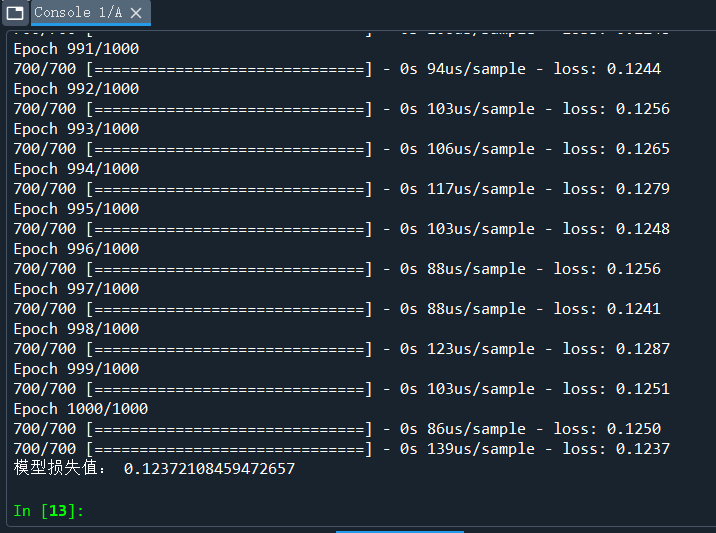
 1 # -*- coding: utf-8 -*-
 2 """
 3 Created on Sun Mar 27 16:45:50 2022
 4
 5 @author: 13549
 6 """
 7 import pandas as pd
 8 from tensorflow.python.keras.models import Sequential
 9 from tensorflow.python.keras.layers.core import Dense, Activation
10
11
12 # 参数初始化
13 inputfile = r'D:\\课本python数据挖掘\data\bankloan.xls'
14 data = pd.read_excel(inputfile)
15 x_test = data.iloc[:,:8].values
16 y_test = data.iloc[:,8].values
17
18 model = Sequential()  # 建立模型
19 model.add(Dense(input_dim = 8, units = 8))
20 model.add(Activation('relu'))  # 用relu函数作为激活函数,能够大幅提供准确度
21 model.add(Dense(input_dim = 8, units = 1))
22 model.add(Activation('sigmoid'))  # 由于是0-1输出,用sigmoid函数作为激活函数
23
24 model.compile(loss = 'mean_squared_error', optimizer = 'adam')
25 # 编译模型。由于我们做的是二元分类,所以我们指定损失函数为binary_crossentropy,以及模式为binary
26 # 另外常见的损失函数还有mean_squared_error、categorical_crossentropy等,请阅读帮助文件。
27 # 求解方法我们指定用adam,还有sgd、rmsprop等可选
28
29 model.fit(x_test, y_test, epochs = 1000, batch_size = 10)  # 训练模型,学习一千次
30 import numpy as np
31 predict_x=model.predict(x_test)
32 classes_x=np.argmax(predict_x,axis=1)
33 yp = classes_x.reshape(len(y_test))
34
35 score = model.evaluate(x_test, y_test, batch_size=128)  #分类预测精确度
36 print('模型损失值:',score)
37
38 from cm_plot import *  # 导入自行编写的混淆矩阵可视化函数
39 cm_plot(y_test,yp).show()
二、决策树
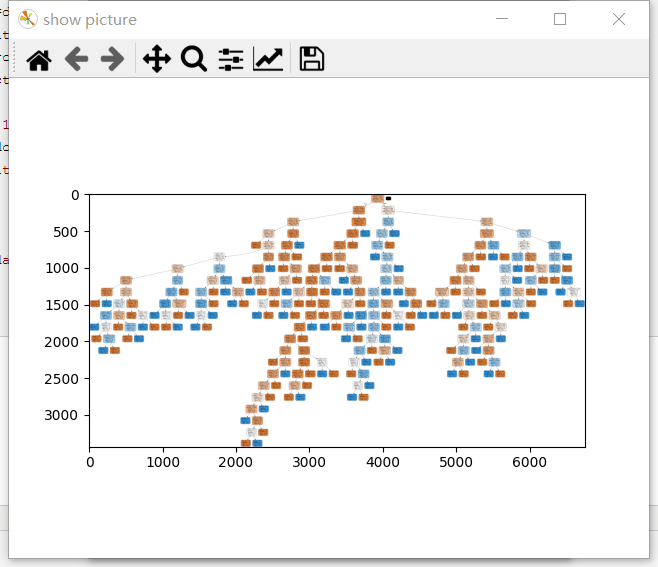
 1 # -*- coding: utf-8 -*-
 2 """
 3 Created on Sun Mar 27 16:40:19 2022
 4
 5 @author: 13549
 6 """
 7
 8 import pandas as pd
 9 # 参数初始化
10 filename ='D:/课本python数据挖掘/data/bankloan.xls'
11 data = pd.read_excel(filename)  # 导入数据
12
13 x = data.iloc[:,:8].astype(int)
14 y = data.iloc[:,8].astype(int)
15
16 from sklearn.tree import DecisionTreeClassifier as DTC
17 dtc = DTC(criterion='entropy')  # 建立决策树模型,基于信息熵
18 dtc.fit(x, y)  # 训练模型
19
20 # 导入相关函数,可视化决策树。
21 # 导出的结果是一个dot文件,需要安装Graphviz才能将它转换为pdf或png等格式。
22 from sklearn.tree import export_graphviz
23 x = pd.DataFrame(x)
24
25 """
26 string1 = '''
27 edge [fontname="NSimSun"];
28 node [ fontname="NSimSun" size="15,15"];
29 {
30 '''
31 string2 = '}'
32 """
33
34 with open("tree.dot", 'w') as f:
35     export_graphviz(dtc, feature_names = x.columns, out_file = f)
36     f.close()
37
38 from IPython.display import Image
39 from sklearn import tree
40 import pydotplus
41
42 dot_data = tree.export_graphviz(dtc, out_file=None,  #regr_1 是对应分类器
43                          feature_names=data.columns[:8],   #对应特征的名字
44                          class_names=data.columns[8],    #对应类别的名字
45                          filled=True, rounded=True,
46                          special_characters=True)
47
48 dot_data = dot_data.replace('helvetica 14', 'MicrosoftYaHei 14') #修改字体
49 graph = pydotplus.graph_from_dot_data(dot_data)
50 graph.write_png('D:/课本python数据挖掘/data/banktree.png')    #保存图像
51 Image(graph.create_png())
52
53 import matplotlib.pyplot as plt
54 img = plt.imread('D:/课本python数据挖掘/data/banktree.png')
55 fig = plt.figure('show picture')
56 plt.imshow(img)

 浙公网安备 33010602011771号