

echarts的简单使用
首先在项目中引入echarts:
main.js:
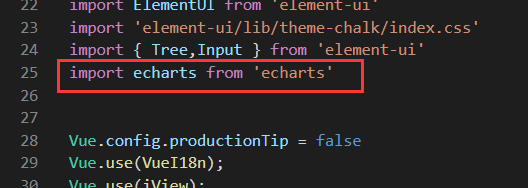
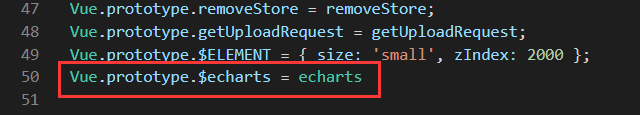
import echarts from 'echarts'
Vue.prototype.$echarts = echarts
然后,在具体文件中使用:
先在页面中创建echarts要渲染的位置:

<div id="analysisMain" style="width: 700px;height:500px;"></div>
再编写初始化方法:
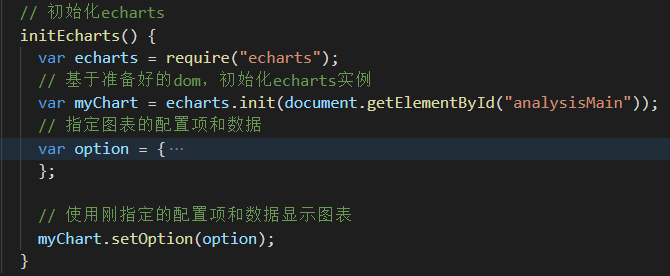
    // 初始化echarts
    initEcharts() {
      var that = this;
      var echarts = require("echarts");
      // 基于准备好的dom,初始化echarts实例
      var myChart = echarts.init(document.getElementById("analysisMain"));
      // 指定图表的配置项和数据
      var option = {...
    };

      // 使用刚指定的配置项和数据显示图表
      myChart.setOption(option);
    }
注意:页面中的id与方法中的id保持一致;另外,将该方法放到mounted()方法中;
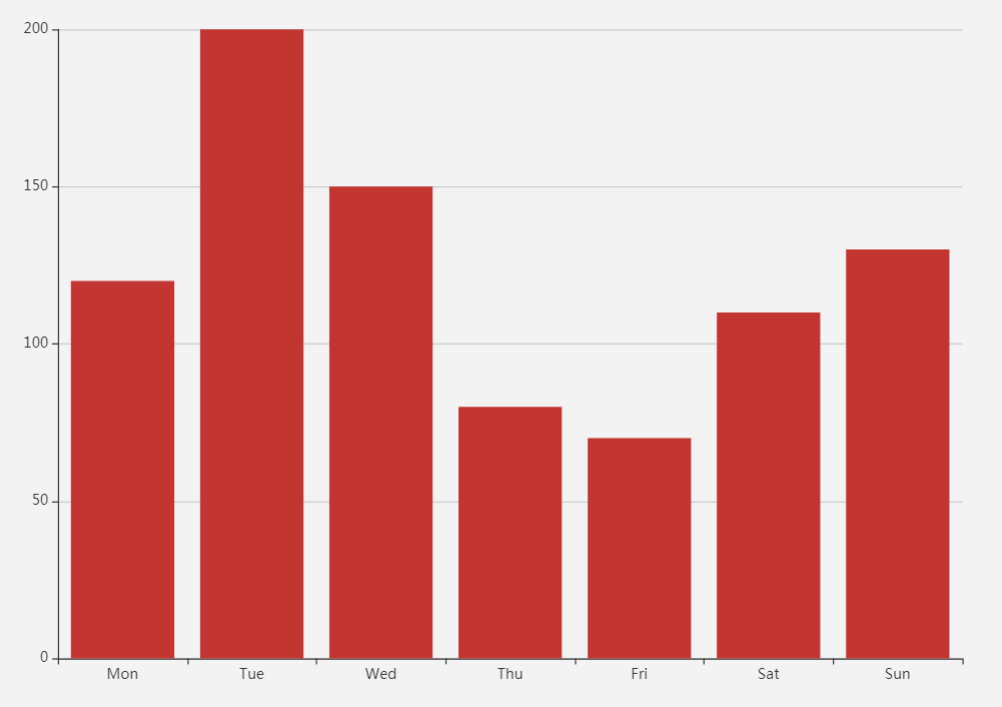
这是官方提供的简单的柱状图option:
option = {
    xAxis: {
        type: 'category',
        data: ['Mon', 'Tue', 'Wed', 'Thu', 'Fri', 'Sat', 'Sun']
    },
    yAxis: {
        type: 'value'
    },
    series: [{
        data: [120, 200, 150, 80, 70, 110, 130],
        type: 'bar'
    }]
};
效果如下:
各种option可以去官网实例中查找:
https://echarts.apache.org/examples/zh/index.html

 浙公网安备 33010602011771号