
echarts实现面积渐变以及解决y轴内容过长显示不全的问题
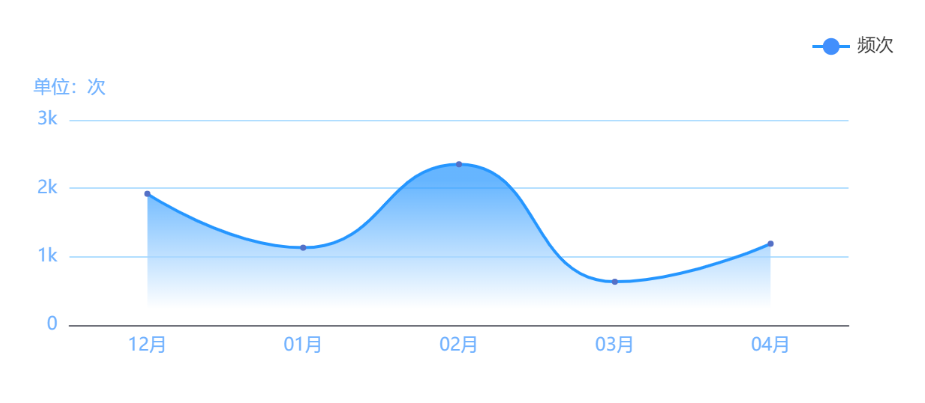
实现效果:
完整代码:
import * as echarts from "echarts";//引入echarts组件
let chartDom = document.getElementById("lineGraph");
let echartsInstance = echarts.init(chartDom); //初始化实例
let option = {
legend: {
right: 30,
itemStyle: { color: "#428FFC" },
data: ["频次"],
},
tooltip: {
//提示框组件
trigger: "axis",
axisPointer: {
type: "none", //虚线隐藏
},
formatter: function (params) {
let relVal = params[0].name;
let scale = (params[0].value / 3000).toFixed(2) * 100;
relVal += "<br/>" + params[0].marker + " 修剪比例: " + scale + "%";
// params[0].value.toLocaleString();
return relVal;
},
},
xAxis: {
type: "category",
data: ["12月", "01月", "02月", "03月", "04月"],
axisLabel: { color: "#70B1FF" }, //文本内容颜色
axisTick: { show: false }, //隐藏x轴刻度
},
yAxis: {
type: "value",
name: "单位:次",
nameTextStyle: { color: "#70B1FF", align: "center" }, //name文字颜色
splitLine: { lineStyle: { color: "#B1DEFF" } }, //y轴线的样式
max: 3000,
splitNumber: 3,
axisLabel: {
color: "#70B1FF", //y轴文字颜色
formatter: (value) => {//处理y轴内容过长
if (value >= 1000) {
value = value / 1000 + "k";
}
return value;
},
},
},
series: [
{
name: "频次",
type: "line", //折线图 bar柱状图
smooth: true, //折线图没有明显的转折点
symbol: "circle", //空心变实心
lineStyle: { color: "#2596FF" }, //折线颜色
data: [1920, 1132, 2351, 634, 1190], //折线图数据
areaStyle: {//渐变面积
normal: {
color: {
x: 0,
y: 0,
x2: 0,
y2: 1,
colorStops: [
{
offset: 0.1,
color: "#2596FF", // 线处的颜色
},
{
offset: 0.9,
color: "#ffffff", // 坐标轴处的颜色
},
],
},
},
},
},
],
};
option && echartsInstance.setOption(option);

 浙公网安备 33010602011771号