
python的关联图绘制 --- pyecharts
生活中有很多需要用到关联图的地方,至少我认为的是这样的图:https://www.echartsjs.com/examples/zh/editor.html?c=graph-npm
我是在使用Word2Vec计算关联词的余弦距离之后,想要更好的展示出来的时候,遇到的这种情况,就做了下拓展。
画图的步骤主要分为:
1. 将距离数据(或者相关数据)读入;
2. 按照一定的格式和参数将数据保存为json字符串,可参考:https://www.cnblogs.com/qi-yuan-008/p/12561893.html;
3. 根据json串,绘制关联图。
具体而言,主要是:
<1>. 首先有一批数据,如图所示:

<2>. 导入所需要的包
import json
import pandas as pd
import random
import copy
<3>. 产生颜色随机值的函数
# 随机颜色
def randomcolor_func():
    color_char = ['1','2','3','4','5','6','7','8','9','A','B','C','D','E','F']
    color_code = ""
    for i in range(6):
        color_code += color_char[random.randint(0,14)] # randint包括前后节点0和14
    return "#"+color_code
<4>. 生成随机坐标
# 随机坐标
#生成随机数,浮点类型
def generate_position(n):
#    n = 10
    for i in range(n):
        x = round(random.uniform(-2000, 2000), 5)  #一定范围内的随机数,范围可变
        y = round(random.uniform(-2000, 2000), 5)  #控制随机数的精度round(数值,精度)
    return x, y
<5>. 生成json格式的节点数据
def create_json(data, weights):
    # 自定义节点
    address_dict = {"nodes":[], "edges":[]}
    node_dict = {
          "color": "",
          "label": "",
          "attributes": {},
          "y": None,
          "x": None,
          "id": "",
          "size": None
        }
    edge_dict = {
          "sourceID": "",
          "attributes": {},
          "targetID": "",
          "size": None
        }

    # 给节点赋值
    for ii in range(len(data)):
        for jj in range(len(data.iloc[ii])):
            # node,"attributes"属性可自行设置
            node_dict[r"color"] = randomcolor_func()
            node_dict[r"label"] = data.iloc[ii, jj]
            x, y = generate_position(1)
            node_dict[r"y"] = y
            node_dict[r"x"] = x
            node_dict[r"id"] = data.iloc[ii, jj]
            node_dict[r"size"] = int(weights.loc[data.iloc[ii, jj]])

            tmp_node = copy.deepcopy(node_dict)
            address_dict[r"nodes"].append(tmp_node)

    for ii in range(len(data)):
        for jj in range(1, len(data.iloc[ii])):
            # edge
            edge_dict[r"sourceID"] = data.iloc[ii, 0]
            edge_dict[r"targetID"] = data.iloc[ii, jj]
            edge_dict[r"size"] = 2

            tmp_edge = copy.deepcopy(edge_dict)
            address_dict["edges"].append(tmp_edge)

    return address_dict
<6>. 主函数生成json数据
if __name__ == '__main__':
    # read data
    data = pd.read_excel(r'test_josn_data.xlsx', 0)

    weights = pd.DataFrame({"词频":[100, 40, 30, 20, 90, 50, 35, 14, 85, 38, 29, 10]},
                            index = ['球类','篮球','足球','羽毛球','美食','肯德基','火锅','烤鱼','饮料','可乐','红茶','奶茶'])  #建立索引权值列表

    address_dict = create_json(data, weights)

    with open("write_json.json", "w", encoding='utf-8') as f:
        # json.dump(dict_, f)  # 写为一行
        json.dump(address_dict, f, indent=2, ensure_ascii=False)  # 写为多行
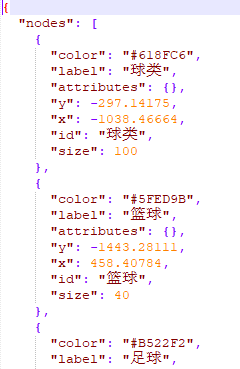
最后形成的json数据如下(下载地址):
<7>. 绘制关联图,里面的文件读取和保存地址自行修改,write_json.json 就是上面保存的json文件
import pyecharts.options as opts
from pyecharts.charts import Graph
import json

with open(r"D:\Python_workspace\spyder_space\test_各种功能\write_json.json", encoding='utf-8') as f:  #设置以utf-8解码模式读取文件,encoding参数必须设置,否则默认以gbk模式读取文件,当文件中包含中文时,会报错
    data = json.load(f)
#print(data)

nodes = [
    {
        "x": node["x"],
        "y": node["y"],
        "id": node["id"],
        "name": node["label"],
        "symbolSize": node["size"],
        "itemStyle": {"normal": {"color": node["color"]}},
    }
    for node in data["nodes"]
]

edges = [{"source": edge["sourceID"], "target": edge["targetID"]} for edge in data["edges"]]


(
    Graph(init_opts=opts.InitOpts(width="1600px", height="800px"))
    .add(
        series_name="",
        nodes=nodes,
        links=edges,
        layout="none",
        is_roam=True,
        is_focusnode=True,
        label_opts=opts.LabelOpts(is_show=True),
        linestyle_opts=opts.LineStyleOpts(width=0.5, curve=0.3, opacity=0.7),
    )
    .set_global_opts(title_opts=opts.TitleOpts(title="热词对应的关联词"))
    .render("关联词图.html")
)
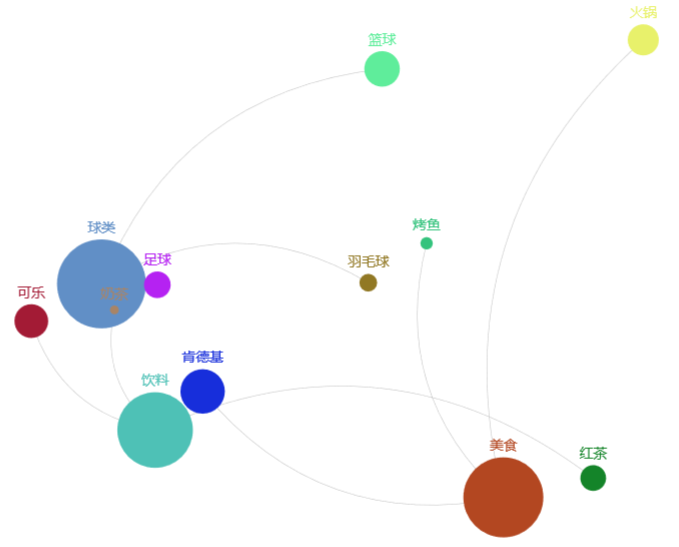
最后,就生成了最开始的那张图。
##
参考:
https://www.echartsjs.com/examples/zh/editor.html?c=graph-npm
https://www.cnblogs.com/tester-go/p/7718910.html
https://blog.csdn.net/u014662865/article/details/82016609


 浙公网安备 33010602011771号