
NetworkX
1 基础教程
常用网站:
NetworkX官方介绍:
NetworkX (NX) is a Python package for the creation, manipulation, and
study of the structure, dynamics, and functions of complex networks.

<https://networkx.lanl.gov/>

Just write in Python

>>> import networkx as nx
>>> G=nx.Graph()
>>> G.add_edge(1,2)
>>> G.add_node(42)
>>> print(sorted(G.nodes()))
[1, 2, 42]
>>> print(sorted(G.edges()))
[(1, 2)]
- 用来处理无向图、有向图、多重图的 Python 数据结构
- 包含许多标准的图算法
- 包括网络结构和分析方法
- 用于产生经典图、随机图和综合网络
- 节点可以是任何事物(如 text, images, XML records)
- 边能保存任意起算值(如 weights, time-series)
- 从 Python 获得的额外优势:快速原型开发方法,容易学,支持多平台。
比如,可以直接求出最短路径:
import networkx as nx
G = nx.Graph()
G.add_edge('A', 'B', weight=4)
G.add_edge('B', 'D', weight=2)
G.add_edge('A', 'C', weight=3)
G.add_edge('C', 'D', weight=4)
nx.shortest_path(G, 'A', 'D', weight='weight')
['A', 'B', 'D']
下面开始打开学习的大门。
1.1 创建图
创建图很简单:
import networkx as nx
G=nx.Graph() # 一个没有边和节点的空图
Graph 是节点(向量)与确定的节点对(称作边、链接(links)等)组成的集合。在 Networkx 中,节点可以是任何可哈希的[1]对象,如文本字符串、图片、XML对象、其他图,自定义的节点对象等。
注意:Python 的 None 对象不应该用作节点。
1.2 节点
Neatworkx 包含很多图生成器函数和工具,可用来以多种格式来读写图。
- 一次增加一个节点:
G.add_node(1) - 用序列增加一系列的节点:
G.add_nodes_from([2,3]) - 增加任意的可迭代的结点容器(序列、集合、图、文件等)
import networkx as nx
G = nx.Graph()
G.add_node(1)
G.add_nodes_from([2,3])
# type(H) networkx.classes.graph.Graph,H 是一个有 10 个节点的链状图,即有 n 个节点 n-1 条边的连通图
H = nx.path_graph(10)
G.add_nodes_from(H)     # 这是将 H 中的许多结点作为 G 的节点
G.add_node(H)          # 这是将 H 作为 G 中的一个节点
G.nodes # 查看结点
输出:
NodeView((1, 2, 3, 0, 4, 5, 6, 7, 8, 9, <networkx.classes.graph.Graph object at 0x0000026E0347B548>))
1.3 边
#G能够一次增加一条边
G.add_edge(1,2)     #只能增加边,有属性,除非指定属性名和值“属性名=值”
e=(2,3)
G.add_edge(*e)      #注意! G.add_edge(e)会报错!G.add_edge(e)
#用序列增加一系列结点
G.add_edges_from([(1,2),(1,3)])
#增加 ebunch边。ebunch:包含边元组的容器,比如序列、迭代器、文件等
#这个元组可以是2维元组或 三维元组 (node1,node2,an_edge_attribute_dictionary),an_edge_attribute_dictionary比如:
#{‘weight’:3.1415}
G.add_edges_from(H.edges())
1.4 删除
#G.remove_node(),G.remove_nodes_from()
#G.remove_edge(),G.remove_edges_from()
G.remove_node(H)      #删除不存在的东西会报错
#移除所有的节点和边
G.clear()
G.add_edges_from([(1,2),(1,3)])
G.add_node(1)
G.add_edge(1,2)
G.add_node("spam")
G.add_nodes_from("spam")    # adds 4 nodes: 's', 'p', 'a', 'm'
G.add_edge(3, 'm')
G.number_of_edges() # 边的个数
G.number_of_nodes() # 节点的个数
1.5 图的属性
图有四个基本属性:G.nodes, G.edges, G.degree, G.adj,分别表示节点集、边集、度、邻域。
print(G.nodes, G.edges) # 查看节点和边
G.adj[1] # 查看邻域
G.degree[1] # 查看节点的度
更多精彩:
>>> G = nx.path_graph(3)
>>> list(G.nodes)
[0, 1, 2]
>>> list(G)
[0, 1, 2]
>>> G.add_node(1, time='5pm')
>>> G.nodes[0]['foo'] = 'bar'
>>> list(G.nodes(data=True))
[(0, {'foo': 'bar'}), (1, {'time': '5pm'}), (2, {})]
>>> list(G.nodes.data())
[(0, {'foo': 'bar'}), (1, {'time': '5pm'}), (2, {})]

>>> list(G.nodes(data='foo'))
[(0, 'bar'), (1, None), (2, None)]
>>> list(G.nodes.data('foo'))
[(0, 'bar'), (1, None), (2, None)]

>>> list(G.nodes(data='time'))
[(0, None), (1, '5pm'), (2, None)]
>>> list(G.nodes.data('time'))
[(0, None), (1, '5pm'), (2, None)]

>>> list(G.nodes(data='time', default='Not Available'))
[(0, 'Not Available'), (1, '5pm'), (2, 'Not Available')]
>>> list(G.nodes.data('time', default='Not Available'))
[(0, 'Not Available'), (1, '5pm'), (2, 'Not Available')]
>>> G = nx.Graph()
>>> G.add_node(0)
>>> G.add_node(1, weight=2)
>>> G.add_node(2, weight=3)
>>> dict(G.nodes(data='weight', default=1))
    {0: 1, 1: 2, 2: 3}
2 无向图
前面介绍的图就是无向图,即:
import networkx as nx
import matplotlib.pyplot as plt

G = nx.Graph()                 #建立一个空的无向图G
G.add_node(1)                  #添加一个节点1
G.add_edge(2,3)                #添加一条边2-3(隐含着添加了两个节点2、3)
G.add_edge(3,2)                #对于无向图,边3-2与边2-3被认为是一条边
print ("nodes:", G.nodes())      #输出全部的节点: [1, 2, 3]
print ("edges:", G.edges())      #输出全部的边:[(2, 3)]
print ("number of edges:", G.number_of_edges())   #输出边的数量:1
nx.draw(G)
plt.savefig("wuxiangtu.png")
plt.show()
nodes: [1, 2, 3]
edges: [(2, 3)]
number of edges: 1
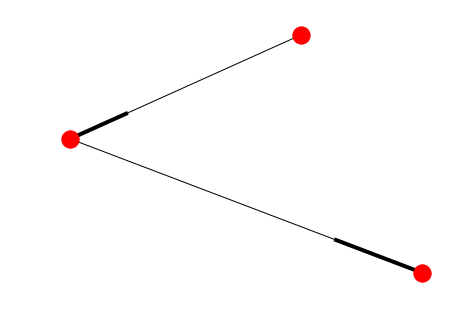
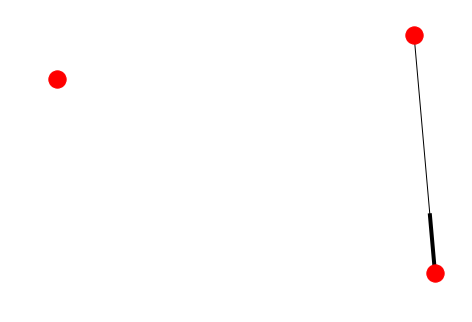
3 有向图
#-*- coding:utf8-*-
import networkx as nx
import matplotlib.pyplot as plt
G = nx.DiGraph()
G.add_node(1)
G.add_node(2)                  #加点
G.add_nodes_from([3,4,5,6])    #加点集合
G.add_edges_from(zip(range(1, 5), [2, 3, 4, 1])) # 加环
G.add_edge(1,3)
G.add_edges_from([(3,5),(3,6),(6,7)])  #加边集合
nx.draw(G)
plt.savefig("有向图.png")
plt.show()
注:使用函数 Graph.to_undirected() 与 Graph.to_directed() 有向图和无向图可以互相转换。
# 例子中把有向图转化为无向图
import networkx as nx
import matplotlib.pyplot as plt

G = nx.DiGraph()
G.add_node(1)
G.add_node(2)
G.add_nodes_from([3,4,5,6])
G.add_edges_from(zip(range(1, 5), [2, 3, 4, 1])) # 加环
G.add_edge(1,3)
G.add_edges_from([(3,5),(3,6),(6,7)])
G = G.to_undirected()
nx.draw(G)
plt.savefig("wuxiangtu.png")
plt.show()
#-*- coding:utf8-*-
import networkx as nx
import matplotlib.pyplot as plt

G = nx.DiGraph()

road_nodes = {'a': 1, 'b': 2, 'c': 3}
#road_nodes = {'a':{1:1}, 'b':{2:2}, 'c':{3:3}}
road_edges = [('a', 'b'), ('b', 'c')]

G.add_nodes_from(road_nodes.items())
G.add_edges_from(road_edges)

nx.draw(G)
plt.savefig("youxiangtu.png")
plt.show()
#-*- coding:utf8-*-

import networkx as nx
import matplotlib.pyplot as plt

G = nx.DiGraph()

#road_nodes = {'a': 1, 'b': 2, 'c': 3}
road_nodes = {'a':{1:1}, 'b':{2:2}, 'c':{3:3}}
road_edges = [('a', 'b'), ('b', 'c')]

G.add_nodes_from(road_nodes.items())
G.add_edges_from(road_edges)

nx.draw(G)
plt.savefig("youxiangtu.png")
plt.show()
4 加权图
有向图和无向图都可以给边赋予权重,用到的方法是add_weighted_edges_from,它接受1个或多个三元组[u,v,w]作为参数,
其中u是起点,v是终点,w是权重
#!-*- coding:utf8-*-

import networkx as nx
import matplotlib.pyplot as plt
G = nx.Graph()                                        #建立一个空的无向图G
G.add_edge(2,3)                                     #添加一条边2-3(隐含着添加了两个节点2、3)
G.add_weighted_edges_from([(3, 4, 3.5),(3, 5, 7.0)])    #对于无向图,边3-2与边2-3被认为是一条边


print (G.get_edge_data(2, 3))
print (G.get_edge_data(3, 4))
print (G.get_edge_data(3, 5))

nx.draw(G)
plt.savefig("wuxiangtu.png")
plt.show()
{}
{'weight': 3.5}
{'weight': 7.0}
import networkx as nx
import matplotlib.pyplot as plt
G = nx.DiGraph()
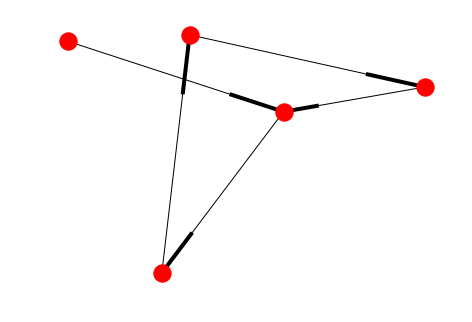
5 经典图论算法计算
计算1:求无向图的任意两点间的最短路径
# -*- coding: cp936 -*-
import networkx as nx
import matplotlib.pyplot as plt

#计算1:求无向图的任意两点间的最短路径
G = nx.Graph()
G.add_edges_from([(1,2),(1,3),(1,4),(1,5),(4,5),(4,6),(5,6)])
path = nx.all_pairs_shortest_path(G)
print(path[1])
{1: [1], 2: [1, 2], 3: [1, 3], 4: [1, 4], 5: [1, 5], 6: [1, 4, 6]}
计算2:找图中两个点的最短路径
import networkx as nx
G=nx.Graph()
G.add_nodes_from([1,2,3,4])
G.add_edge(1,2)
G.add_edge(3,4)
try:
    n=nx.shortest_path_length(G,1,4)
    print (n)
except nx.NetworkXNoPath:
    print ('No path')
No path
强连通、弱连通
- 强连通:有向图中任意两点v1、v2间存在v1到v2的路径(path)及v2到v1的路径。
- 弱联通:将有向图的所有的有向边替换为无向边,所得到的图称为原图的基图。如果一个有向图的基图是连通图,则有向图是弱连通图。
距离
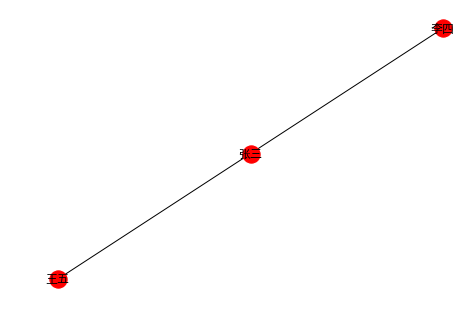
例1:弱连通
#-*- coding:utf8-*-

import networkx as nx
import matplotlib.pyplot as plt
#G = nx.path_graph(4, create_using=nx.Graph())
#0 1 2 3
G = nx.path_graph(4, create_using=nx.DiGraph())    #默认生成节点0 1 2 3,生成有向变0->1,1->2,2->3
G.add_path([7, 8, 3])  #生成有向边:7->8->3

for c in nx.weakly_connected_components(G):
    print (c)

print ([len(c) for c in sorted(nx.weakly_connected_components(G), key=len, reverse=True)])

nx.draw(G)
plt.savefig("youxiangtu.png")
plt.show()
{0, 1, 2, 3, 7, 8}
[6]
例2:强连通
#-*- coding:utf8-*-

import networkx as nx
import matplotlib.pyplot as plt
#G = nx.path_graph(4, create_using=nx.Graph())
#0 1 2 3
G = nx.path_graph(4, create_using=nx.DiGraph())
G.add_path([3, 8, 1])

#for c in nx.strongly_connected_components(G):
#    print c
#
#print [len(c) for c in sorted(nx.strongly_connected_components(G), key=len, reverse=True)]


con = nx.strongly_connected_components(G)
print (con)
print (type(con))
print (list(con))


nx.draw(G)
plt.savefig("youxiangtu.png")
plt.show()
<generator object strongly_connected_components at 0x0000018ECC82DD58>
<class 'generator'>
[{8, 1, 2, 3}, {0}]
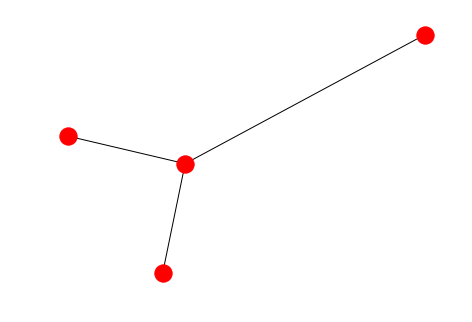
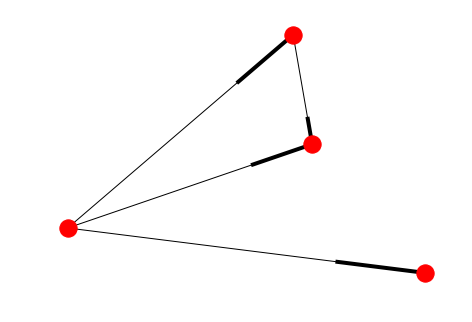
6 子图
#-*- coding:utf8-*-

import networkx as nx
import matplotlib.pyplot as plt
G = nx.DiGraph()
G.add_path([5, 6, 7, 8])
sub_graph = G.subgraph([5, 6, 8])
#sub_graph = G.subgraph((5, 6, 8))  #ok  一样

nx.draw(sub_graph)
plt.savefig("youxiangtu.png")
plt.show()
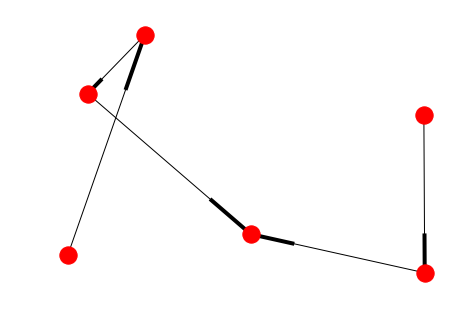
条件过滤
原图
#-*- coding:utf8-*-

import networkx as nx
import matplotlib.pyplot as plt
G = nx.DiGraph()


road_nodes = {'a':{'id':1}, 'b':{'id':1}, 'c':{'id':3}, 'd':{'id':4}}
road_edges = [('a', 'b'), ('a', 'c'), ('a', 'd'), ('b', 'd')]

G.add_nodes_from(road_nodes)
G.add_edges_from(road_edges)


nx.draw(G)
plt.savefig("youxiangtu.png")
plt.show()
过滤函数
#-*- coding:utf8-*-

import networkx as nx
import matplotlib.pyplot as plt
G = nx.DiGraph()
def flt_func_draw():
    flt_func = lambda d: d['id'] != 1
    return flt_func

road_nodes = {'a':{'id':1}, 'b':{'id':1}, 'c':{'id':3}, 'd':{'id':4}}
road_edges = [('a', 'b'), ('a', 'c'), ('a', 'd'), ('b', 'd')]

G.add_nodes_from(road_nodes.items())
G.add_edges_from(road_edges)

flt_func = flt_func_draw()
part_G = G.subgraph(n for n, d in G.nodes_iter(data=True) if flt_func(d))
nx.draw(part_G)
plt.savefig("youxiangtu.png")
plt.show()

pred,succ
#-*- coding:utf8-*-

import networkx as nx
import matplotlib.pyplot as plt
G = nx.DiGraph()


road_nodes = {'a':{'id':1}, 'b':{'id':1}, 'c':{'id':3}}
road_edges = [('a', 'b'), ('a', 'c'), ('c', 'd')]

G.add_nodes_from(road_nodes.items())
G.add_edges_from(road_edges)

print( G.nodes())
print (G.edges())

print ("a's pred ", G.pred['a'])
print ("b's pred ", G.pred['b'])
print ("c's pred ", G.pred['c'])
print ("d's pred ", G.pred['d'])

print ("a's succ ", G.succ['a'])
print ("b's succ ", G.succ['b'])
print ("c's succ ", G.succ['c'])
print ("d's succ ", G.succ['d'])

nx.draw(G)
plt.savefig("wuxiangtu.png")
plt.draw()
['a', 'b', 'c', 'd']
[('a', 'b'), ('a', 'c'), ('c', 'd')]
a's pred  {}
b's pred  {'a': {}}
c's pred  {'a': {}}
d's pred  {'c': {}}
a's succ  {'b': {}, 'c': {}}
b's succ  {}
c's succ  {'d': {}}
d's succ  {}
画图小技巧
%pylab inline
mpl.rcParams['font.sans-serif'] = ['SimHei']  # 指定默认字体
mpl.rcParams['axes.unicode_minus'] = False  # 解决保存图像是负号 '-' 显示为方块的问题

import networkx as nx
g=nx.Graph()
g.add_edge('张三','李四')
g.add_edge('张三','王五')
nx.draw(g,with_labels=True)
plt.show()
Populating the interactive namespace from numpy and matplotlib
networkx 有四种图 Graph 、DiGraph、MultiGraph、MultiDiGraph,分别为无多重边无向图、无多重边有向图、有多重边无向图、有多重边有向图。
import networkx as nx

G = nx.Graph()  # 创建空的网络图
G = nx.DiGraph()
G = nx.MultiGraph()
G = nx.MultiDiGraph()

G.add_node('a')#添加点a
G.add_node(1,1)#用坐标来添加点
G.add_edge('x','y')#添加边,起点为x,终点为y
G.add_weight_edges_from([('x','y',1.0)])#第三个输入量为权值
#也可以
L = [[('a','b',5.0),('b','c',3.0),('a','c',1.0)]]
G.add_weight_edges_from([(L)])
nx.draw(G)
plt.show()   # 图像显示
为了让图形更精美我们详解 nx.draw()
nx.draw(G, pos=None, ax=None, **kwds)
pos指的是布局,主要有spring_layout,random_layout,circle_layout,shell_layout。node_color指节点颜色,有rbykw,同理edge_color.with_labels指节点是否显示名字size表示大小font_color表示字的颜色。
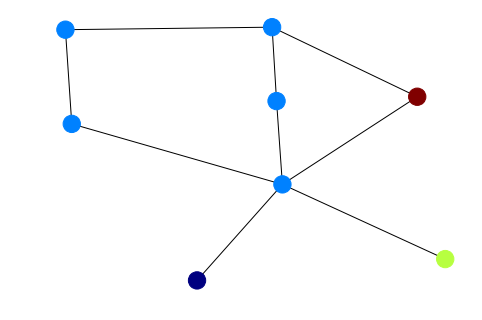
import networkx as nx
import numpy as np
import matplotlib.pyplot as plt
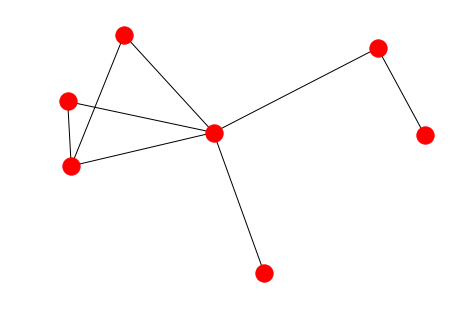
G = nx.Graph()
G.add_edges_from(
[('A', 'B'), ('A', 'C'), ('D', 'B'), ('E', 'C'), ('E', 'F'),
('B', 'H'), ('B', 'G'), ('B', 'F'), ('C', 'G')])
val_map = {'A': 1.0,
'D': 0.5714285714285714,
'H': 0.0}
values = [val_map.get(node, 0.25) for node in G.nodes()]
nx.draw(G, cmap = plt.get_cmap('jet'), node_color = values)
plt.show()
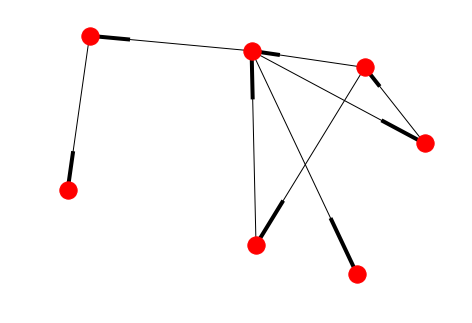
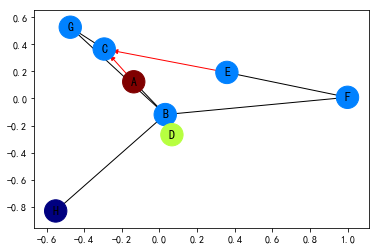
import networkx as nx
import matplotlib.pyplot as plt

G = nx.DiGraph()
G.add_edges_from(
    [('A', 'B'), ('A', 'C'), ('D', 'B'), ('E', 'C'), ('E', 'F'),
     ('B', 'H'), ('B', 'G'), ('B', 'F'), ('C', 'G')])

val_map = {'A': 1.0,
           'D': 0.5714285714285714,
           'H': 0.0}

values = [val_map.get(node, 0.25) for node in G.nodes()]

# Specify the edges you want here
red_edges = [('A', 'C'), ('E', 'C')]
edge_colours = ['black' if not edge in red_edges else 'red'
                for edge in G.edges()]
black_edges = [edge for edge in G.edges() if edge not in red_edges]

# Need to create a layout when doing
# separate calls to draw nodes and edges
pos = nx.spring_layout(G)
nx.draw_networkx_nodes(G, pos, cmap=plt.get_cmap('jet'),
                       node_color = values, node_size = 500)
nx.draw_networkx_labels(G, pos)
nx.draw_networkx_edges(G, pos, edgelist=red_edges, edge_color='r', arrows=True)
nx.draw_networkx_edges(G, pos, edgelist=black_edges, arrows=False)
plt.show()
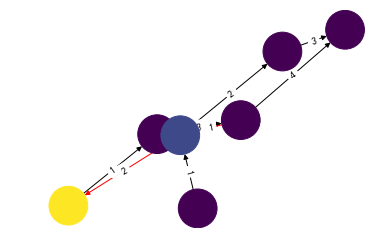
import networkx as nx
import numpy as np
import matplotlib.pyplot as plt
import pylab

G = nx.DiGraph()

G.add_edges_from([('A', 'B'),('C','D'),('G','D')], weight=1)
G.add_edges_from([('D','A'),('D','E'),('B','D'),('D','E')], weight=2)
G.add_edges_from([('B','C'),('E','F')], weight=3)
G.add_edges_from([('C','F')], weight=4)


val_map = {'A': 1.0,
                   'D': 0.5714285714285714,
                              'H': 0.0}

values = [val_map.get(node, 0.45) for node in G.nodes()]
edge_labels=dict([((u,v,),d['weight'])
                 for u,v,d in G.edges(data=True)])
red_edges = [('C','D'),('D','A')]
edge_colors = ['black' if not edge in red_edges else 'red' for edge in G.edges()]

pos=nx.spring_layout(G)
nx.draw_networkx_edge_labels(G,pos,edge_labels=edge_labels)
nx.draw(G,pos, node_color = values, node_size=1500,edge_color=edge_colors,edge_cmap=plt.cm.Reds)
pylab.show()
可哈希的:一个对象在它的生存期从来不会被改变(拥有一个哈希方法),能和其他对象区别(有比较方法) ↩︎
探寻有趣之事!

 浙公网安备 33010602011771号