
散点图
散点图
import matplotlib.pyplot as plt
import pandas as pd
import matplotlib
matplotlib.use('TkAgg')
plt.rcParams["font.sans-serif"] = ["SimHei"] # 解决英文冲突问题
matplotlib.use('TkAgg')
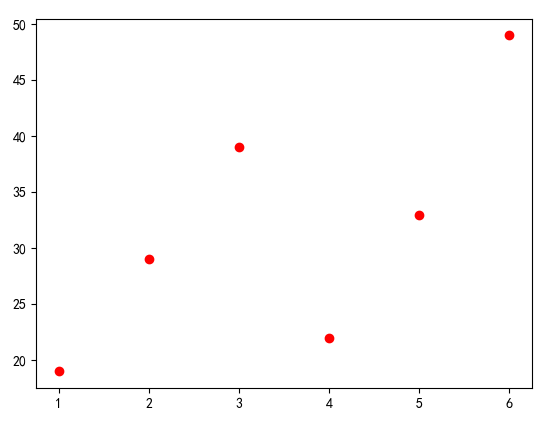
x = [1, 2, 3, 4, 5, 6]
y = [19, 29, 39, 22, 33, 49]
plt.scatter(x, y, color="red")
# scatter 撒,分散
# color="red" 表示点的颜色
# 与折线图差异点plt.plot() 改为 plt.scatter()
plt.show()

 浙公网安备 33010602011771号