Attention Mechanisms-Nadaraya-Watson课后题
#2.What is the value of our learned w in the parametric attention pooling experiment? Why does it make the weighted region sharper when visualizing the attention weights?
w用于调节各xi和x的注意力值,可以通过net打印w值 w值19.0512,远大于1,所以放大了距离近值的影响,因此注意力图就更加尖锐
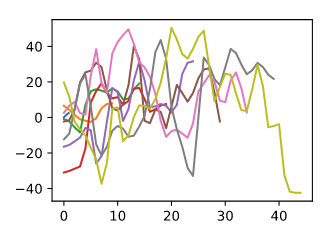
# 3.How can we add hyperparameters to nonparametric Nadaraya-Watson kernel regression to predict better?
### 注意力token长度作为超参,影响最终效果
from matplotlib import pyplot as plt
n_train = 50  # No. of training examples
x_train, _ = torch.sort(torch.rand(n_train) * 5)  # Training inputs
print(x_train)

def f(x):
    return 2 * torch.sin(x) + x**0.8

y_train = f(x_train) + torch.normal(0.0, 0.5, (n_train,))  # Training outputs

x_test = torch.arange(0, super_parameter*0.1, 0.1)
y_truth = f(x_test)
plt.plot(x_test, y_truth)
### 定义注意力tokn长度
for super_parameter in range(10, 50, 5):
    x_train, _ = torch.sort(torch.rand(super_parameter) * super_parameter)  # Training inputs
    y_train = f(x_train) + torch.normal(0.0, super_parameter, (super_parameter,))

    x_test = torch.arange(0, super_parameter, 1)  # Testing examples
    x_test_repeat = x_test.repeat_interleave(super_parameter).reshape(-1, super_parameter)
    attention_weight = torch.nn.functional.softmax(-(x_test_repeat-x_train)**2/2, dim=1)
    y_pre = torch.matmul(attention_weight, y_train)
    plt.plot(x_test, y_pre)
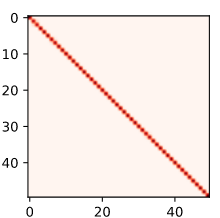
- Design another parametric attention pooling for the kernel regression of this section. Train this new model and visualize its attention weights.
class NWKernelRegression(nn.Module):
    def __init__(self, **kwargs):
        super().__init__(**kwargs)
        self.w = nn.Parameter(torch.rand((1,), requires_grad=True))

    def forward(self, queries, keys, values):
        # Shape of the output `queries` and `attention_weights`:
        # (no. of queries, no. of key-value pairs)

        queries = queries.repeat_interleave(keys.shape[1]).reshape(
            (-1, keys.shape[1]))

        self.attention_weights = nn.functional.softmax(
            -((queries - keys)*self.w**3)**2 / 2, dim=1)
        # Shape of `values`: (no. of queries, no. of key-value pairs)
        return torch.bmm(self.attention_weights.unsqueeze(1),
                         values.unsqueeze(-1)).reshape(-1)

net = NWKernelRegression()
loss = nn.MSELoss(reduction='none')
trainer = torch.optim.SGD(net.parameters(), lr=0.5)
# animator = d2l.Animator(xlabel='epoch', ylabel='loss', xlim=[1, 5])

n_test = 50
n_train = 50  # No. of training examples
x_train, _ = torch.sort(torch.rand(n_train) * 5)
def f(x):
    return 2 * torch.sin(x) + x**0.8
y_train = f(x_train) + torch.normal(0.0, 0.5, (n_train,))  # Training outputs
keys = x_train.repeat((n_test, 1))
# Shape of `value`: (`n_test`, `n_train`)
values = y_train.repeat((n_test, 1))
x_test = torch.arange(0, 5, 0.1)
y_hat = net(x_test, keys, values).unsqueeze(1).detach()

for epoch in range(5):
    trainer.zero_grad()
    l = loss(net(x_train, keys, values), y_train) / 2
    l.sum().backward()
    trainer.step()
    print(f'epoch {epoch + 1}, loss {float(l.sum()):.6f}')
    print("net*", net.w)
    print("**")
print(net.attention_weights)

from matplotlib import pyplot as plt
# plt.plot(x_test, y_hat)
pcm = plt.imshow(net.attention_weights.detach(), cmap='Reds')
fig.colorbar(pcm, shrink=0.6)
plt.show()

 浙公网安备 33010602011771号