
决策树的图形可视化
在Python 中使用 Matplotlib 注释绘制决策树形图
声明:本篇博文是学习《机器学习实战》一书的方式路程,系原创,若转载请标明来源。
上次我们对数据生成决策树有了一定了解,但树是以字典的形式表达的,非常不易于理解;因此,通过决策树的图形可视化有助于我们对决策树的理解和认识。利用强大的Matplotlib 库就可以解决实际的需求。
1 生成决策树的完整的代码
新建一个test.py 文件,用于写决策树的建立代码
  1 # coding=utf-8
  2 from math import log
  3 import operator
  4 def calcShannonEnt(dataSet):
  5     numEntries = len(dataSet)
  6     labelCounts = {}
  7     for featVec in dataSet:
  8         currentLabel = featVec[-1] # 提取类标号的属性值
  9         # 把类标号不同的属性值及其个数存入字典中
 10         if currentLabel not in labelCounts .keys():
 11             labelCounts [currentLabel ]=0
 12         labelCounts [currentLabel]+=1
 13     shannonEnt = 0.0
 14     # 计算类标号的平均信息量,如公式中H(S)
 15     for key in labelCounts :
 16         prob = float(labelCounts [key])/numEntries
 17         shannonEnt -= prob * log(prob,2)
 18     return shannonEnt
 19
 20 def createDataSet():
 21     dataSet = [[1, 1, 'yes'],
 22                [1, 1, 'yes'],
 23                [1, 0, 'no'],
 24                [0, 1, 'no'],
 25                [0, 1, 'no']]
 26     labels = ['no surfacing','flippers']
 27     #change to discrete values
 28     return dataSet, labels
 29 def createDataSet1():
 30     dataSet = [[u'小于等于5',u'高',u'否',u'一般',u'否'],
 31                [u'小于等于5', u'高', u'否', u'好', u'否'],
 32                [u'5到10', u'高', u'否', u'一般', u'否'],
 33                [u'大于等于10', u'中', u'否', u'一般', u'是'],
 34                [u'大于等于10', u'低', u'是', u'一般', u'是'],
 35                [u'5到10', u'中', u'否', u'好', u'否'],
 36                [u'5到10', u'高', u'是', u'一般', u'是'],
 37                [u'小于等于5', u'中', u'否', u'一般', u'否'],
 38                [u'5到10', u'中', u'否', u'好', u'否'],
 39                [u'大于等于10', u'高', u'是', u'好', u'是'],
 40                [u'5到10', u'低', u'是', u'一般', u'是'],
 41                [u'小于等于5', u'中', u'是', u'一般', u'是'],
 42                [u'小于等于5', u'低', u'是', u'一般', u'是'],
 43                [u'大于等于10', u'中', u'是', u'好', u'是']]
 44     labels = [u'役龄',u'价格',u'是否关键部件',u'磨损程度']
 45     return dataSet ,labels
 46
 47 # 按照给定特征划分数据集,把符合给定属性值的对象组成新的列表
 48 def splitDataSet(dataSet,axis,value):
 49     retDataSet = []
 50     for featVec in dataSet:
 51         # 选择符合给定属性值的对象
 52         if featVec[axis] == value:
 53             reduceFeatVec = featVec[:axis] # 对对象的属性值去除给定的特征的属性值
 54             reduceFeatVec.extend(featVec[axis+1:])
 55             retDataSet.append(reduceFeatVec ) # 把符合且处理过的对象添加到新的列表中
 56     return retDataSet
 57
 58 # 选取最佳特征的信息增益,并返回其列号
 59 def chooseBestFeaturesplit(dataSet):
 60     numFeatures = len(dataSet[0])-1  # 获得样本集S 除类标号之外的属性个数,如公式中的k
 61     baseEntropy = calcShannonEnt(dataSet)  # 获得类标号属性的平均信息量,如公式中H(S)
 62
 63     bestInfoGain = 0.0 # 对最佳信息增益的初始化
 64     bestFeature = -1 # 最佳信息增益的属性在样本集中列号的初始化
 65
 66     # 对除类标号之外的所有样本属性一一计算其平均信息量
 67     for i in range(numFeatures ):
 68         featList = [example[i] for example in dataSet] # 提取第i 个特征的所有属性值
 69         uniqueVals = set(featList ) # 第i 个特征所有不同属性值的集合,如公式中 aq
 70         newEntropy = 0.0 # 对第i 个特征的平均信息量的初始化
 71         # 计算第i 个特征的不同属性值的平均信息量,如公式中H(S| Ai)
 72         for value in uniqueVals:
 73             subDataSet = splitDataSet(dataSet,i,value ) # 提取第i 个特征,其属性值为value的对象集合
 74             prob = len (subDataSet )/float(len(dataSet)) # 计算公式中P(Cpq)的概率
 75             newEntropy += prob * calcShannonEnt(subDataSet ) # 第i个特征的平均信息量,如 公式中H(S| Ai)
 76         infoGain = baseEntropy - newEntropy  # 第i 个的信息增益量
 77         if (infoGain > bestInfoGain  ): # 选取最佳特征的信息增益,并返回其列号
 78             bestInfoGain   = infoGain
 79
 80             bestFeature = i
 81     return bestFeature
 82
 83 # 选择列表中重复次数最多的一项
 84 def majorityCnt(classList):
 85     classCount= {}
 86     for vote in classList :
 87         if vote not in classCount .keys():
 88             classCount [vote] =0
 89         classCount[vote] += 1
 90     sortedClassCount = sorted(classCount.iteritems() ,
 91                                   key=operator.itemgetter(1),
 92                                   reverse= True ) # 按逆序进行排列,并返回由元组组成元素的列表
 93     return sortedClassCount[0][0]
 94
 95 # 创建决策树
 96 def createTree(dataSet,labels):
 97     Labels = labels [:]  # 防止改变最初的特征列表
 98     classList = [example[-1] for example in dataSet ] # 获得样本集中的类标号所有属性值
 99     if classList.count(classList [0]) == len(classList): # 类标号的属性值完全相同则停止继续划分
100         return classList[0]
101     if len(dataSet[0]) == 1: # 遍历完所有的特征时,仍然类标号不同的属性值,则返回出现次数最多的属性值
102         return majorityCnt(classList)
103     bestFeat = chooseBestFeaturesplit(dataSet) # 选择划分最佳的特征,返回的是特征在样本集中的列号
104     bestFeatLabel = Labels[bestFeat]  # 提取最佳特征的名称
105     myTree = {bestFeatLabel :{}} # 创建一个字典,用于存放决策树
106     del(Labels[bestFeat]) # 从特征列表中删除已经选择的最佳特征
107     featValues = [example[bestFeat] for example in dataSet ] # 提取最佳特征的所有属性值
108     uniqueVals = set(featValues ) # 获得最佳特征的不同的属性值
109     for value in uniqueVals :
110         subLabels = Labels[:] #  把去除最佳特征的特征列表赋值于subLabels
111         myTree [bestFeatLabel][value] = createTree(splitDataSet(dataSet ,bestFeat ,value ),
112                                                    subLabels ) # 递归调用createTree()
113     return myTree
114
115 # 决策树的存储
116 def storeTree(inputTree,filename):
117     import pickle
118     fw = open(filename,'w')
119     pickle.dump(inputTree ,fw)
120     fw.close()
121
122 def grabTree(filename):
123     import pickle
124     fr = open(filename)
125     return pickle.load(fr)
126
127
128 # 使用决策树的分类函数
129 def classify(inputTree,featLabels,testVec):
130     firstStr = inputTree.keys()[0]  # 获得距离根节点最近的最佳特征
131     secondDict = inputTree[firstStr ]  # 最佳特征的分支
132     featIndex = featLabels .index(firstStr) # 获取最佳特征在特征列表中索引号
133     for key in secondDict .keys(): # 遍历分支
134         if testVec [featIndex ] == key: # 确定待查数据和最佳特征的属性值相同的分支
135             if type(secondDict [key]).__name__ == 'dict': # 判断找出的分支是否是“根节点”
136                 classLabel = classify(secondDict[key],featLabels ,testVec) # 利用递归调用查找叶子节点
137             else:
138                 classLabel  = secondDict [key]  # 找出的分支是叶子节点
139     return classLabel
2 决策树的图形可视化
另外新建一个文件 treeplotter.py , 编写决策树图形可视化的代码。
 1 # coding=utf-8
 2 import matplotlib.pyplot as plt
 3 import sys
 4 import test
 5 reload(sys)
 6 sys.setdefaultencoding('utf-8')
 7 decisionNode = dict(boxstyle="sawtooth", fc="0.8")
 8 leafNode = dict(boxstyle="round4", fc="0.8")
 9 arrow_args = dict(arrowstyle="<-")
10
11 # 获得叶子节点的数目
12 def getNumLeafs(myTree):
13     numLeafs = 0
14     firstStr = myTree.keys()[0]
15     secondDict = myTree[firstStr]
16     for key in secondDict.keys():
17         if type(secondDict[key]).__name__=='dict':#test to see if the nodes are dictonaires, if not they are leaf nodes
18             numLeafs += getNumLeafs(secondDict[key])
19         else:   numLeafs +=1
20     return numLeafs
21
22 # 获得决策树的层数
23 def getTreeDepth(myTree):
24     maxDepth = 0
25     firstStr = myTree.keys()[0]
26     secondDict = myTree[firstStr]
27     for key in secondDict.keys():
28         if type(secondDict[key]).__name__=='dict':#test to see if the nodes are dictonaires, if not they are leaf nodes
29             thisDepth = 1 + getTreeDepth(secondDict[key])
30         else:   thisDepth = 1
31         if thisDepth > maxDepth: maxDepth = thisDepth
32     return maxDepth
33
34 def plotNode(nodeTxt, centerPt, parentPt, nodeType):
35     createPlot.ax1.annotate(nodeTxt, xy=parentPt,  xycoords='axes fraction',
36              xytext=centerPt, textcoords='axes fraction',
37              va="center", ha="center", bbox=nodeType, arrowprops=arrow_args )
38
39 def plotMidText(cntrPt, parentPt, txtString):
40     xMid = (parentPt[0]-cntrPt[0])/2.0 + cntrPt[0]
41     yMid = (parentPt[1]-cntrPt[1])/2.0 + cntrPt[1]
42     createPlot.ax1.text(xMid, yMid, txtString, va="center", ha="center", rotation=30)
43
44 def plotTree(myTree, parentPt, nodeTxt):#if the first key tells you what feat was split on
45     numLeafs = getNumLeafs(myTree)  #this determines the x width of this tree
46     depth = getTreeDepth(myTree)
47     firstStr = myTree.keys()[0]     #the text label for this node should be this
48     cntrPt = (plotTree.xOff + (1.0 + float(numLeafs))/2.0/plotTree.totalW, plotTree.yOff)
49     plotMidText(cntrPt, parentPt, nodeTxt)
50     plotNode(firstStr, cntrPt, parentPt, decisionNode)
51     secondDict = myTree[firstStr]
52     plotTree.yOff = plotTree.yOff - 1.0/plotTree.totalD
53     for key in secondDict.keys():
54         if type(secondDict[key]).__name__=='dict':#test to see if the nodes are dictonaires, if not they are leaf nodes
55             plotTree(secondDict[key],cntrPt,str(key))        #recursion
56         else:   #it's a leaf node print the leaf node
57             plotTree.xOff = plotTree.xOff + 1.0/plotTree.totalW
58             plotNode(secondDict[key], (plotTree.xOff, plotTree.yOff), cntrPt, leafNode)
59             plotMidText((plotTree.xOff, plotTree.yOff), cntrPt, str(key))
60     plotTree.yOff = plotTree.yOff + 1.0/plotTree.totalD
61 #if you do get a dictonary you know it's a tree, and the first element will be another dict
62
63 def createPlot(inTree):
64     fig = plt.figure(1, facecolor='white')
65     fig.clf()
66     axprops = dict(xticks=[], yticks=[])
67     createPlot.ax1 = plt.subplot(111, frameon=False, **axprops)    #no ticks
68     #createPlot.ax1 = plt.subplot(111, frameon=False) #ticks for demo puropses
69     plotTree.totalW = float(getNumLeafs(inTree))
70     plotTree.totalD = float(getTreeDepth(inTree))
71     plotTree.xOff = -0.5/plotTree.totalW; plotTree.yOff = 1.0;
72     plotTree(inTree, (0.5,1.0), '')
73     plt.show()
74
75
76 if __name__ == '__main__':
77     dataSet, labels = test.createDataSet1()
78     myTree = test.createTree(dataSet, labels)
79     createPlot(myTree)
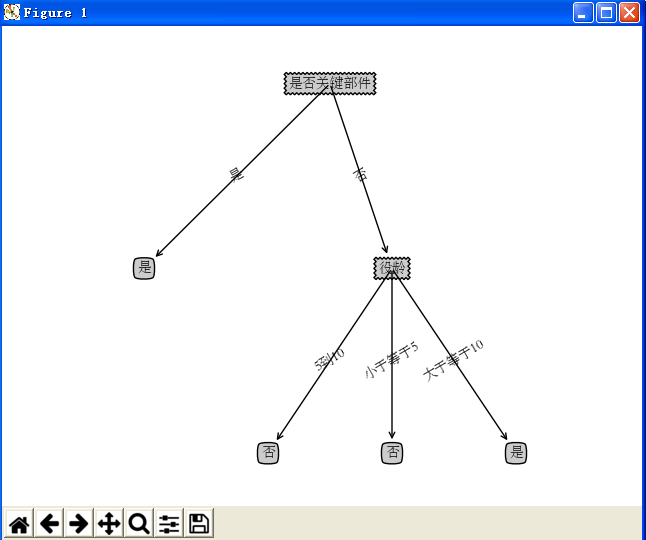
3 运行结果显示

 浙公网安备 33010602011771号