echart w3cschool 学习
基础定义
如何快速上手ECharts
教程转载自https://www.w3cschool.cn/echarts_tutorial/,基于echart5版本组件,代码测试地址为https://echarts.apache.org/examples/zh/editor.html,将学习代码复制到打开的编辑器即可显示图表。


 1 // 指定图表的配置项和数据
 2         var option = {
 3             title: {
 4                 text: 'ECharts 入门示例'
 5             },
 6             tooltip: {},
 7             legend: {
 8                 data:['销量']
 9             },
10             xAxis: {
11                 data: ["衬衫","羊毛衫","雪纺衫","裤子","高跟鞋","袜子"]
12             },
13             yAxis: {},
14             series: [{
15                 name: '销量',
16                 type: 'bar',
17                 data: [5, 20, 36, 10, 10, 20]
18             }]
19         };
ECharts个性化图表样式的实现
绘制饼状图
 1 option ={
 2     series : [
 3         {
 4             name: '访问来源',
 5             type: 'pie',//饼状图类型
 6             radius: '55%',//图表半径
 7             data:[
 8                 {value:235, name:'视频广告'},
 9                 {value:274, name:'联盟广告'},
10                 {value:310, name:'邮件营销'},
11                 {value:335, name:'直接访问'},
12                 {value:400, name:'搜索引擎'}
13             ]
14         }
15     ]
16 }
绘制南丁格尔图
ECharts 中的 饼图 也支持通过设置 roseType 显示成南丁格尔图
 1 option ={
 2     series : [
 3         {
 4             name: '访问来源',
 5             type: 'pie',//饼状图类型
 6             radius: '55%',//图表半径
 7             data:[
 8                 {value:235, name:'视频广告'},
 9                 {value:274, name:'联盟广告'},
10                 {value:310, name:'邮件营销'},
11                 {value:335, name:'直接访问'},
12                 {value:400, name:'搜索引擎'}
13             ],
14             roseType: 'angle',//玫瑰图类型
15         }
16     ]
17 }
配置阴影
 1 option ={
 2     series : [
 3         {
 4             name: '访问来源',
 5             type: 'pie',//饼状图类型
 6             radius: '55%',//图表半径
 7             data:[
 8                 {value:235, name:'视频广告'},
 9                 {value:274, name:'联盟广告'},
10                 {value:310, name:'邮件营销'},
11                 {value:335, name:'直接访问'},
12                 {value:400, name:'搜索引擎'}
13             ],
14             roseType: 'angle',//玫瑰图类型
15             itemStyle: {
16      //normal 选项显示的是正常展示下的样式
17     normal: {
18         // 阴影的大小
19         shadowBlur:100,
20         // 阴影水平方向上的偏移
21         shadowOffsetX: 0,
22         // 阴影垂直方向上的偏移
23         shadowOffsetY: 0,
24         // 阴影颜色
25         shadowColor: 'rgba(0, 0, 0, 0.5)'
26     },
27     //emphasis 是当鼠标 hover 时候的高亮样式
28      emphasis: {
29         shadowBlur: 400,
30         shadowColor: 'rgba(0, 0, 0, 0.5)'
31     }
32 }
33         }
34     ]
35 }
设置深色背景和浅色标签
注意:label 和 labelLine 的样式有 normal 和 emphasis 两个状态,这与 itemStyle 相同。
 1 option ={
 2     series : [
 3         {
 4             name: '访问来源',
 5             type: 'pie',//饼状图类型
 6             radius: '55%',//图表半径
 7             data:[
 8                 {value:235, name:'视频广告'},
 9                 {value:274, name:'联盟广告'},
10                 {value:310, name:'邮件营销'},
11                 {value:335, name:'直接访问'},
12                 {value:400, name:'搜索引擎'}
13             ],
14             roseType: 'angle',//玫瑰图类型
15         }
16     ],
17     //深色主题
18      backgroundColor: '#2c343c',
19      //背景色设置完成后,同样将文本的样式设置为全局的文本样式
20  textStyle: {
21         color: 'rgba(255, 255, 255, 0.3)'
22     },
23     //每个系列的文本设置在 label.normal.textStyle
24     label: {
25     normal: {
26         textStyle: {
27             color: 'rgba(255, 255, 255, 0.3)'
28         }
29     }
30 },
31 //标签的视觉引导线的颜色设置为浅色
32 labelLine: {
33     normal: {
34         lineStyle: {
35             color: 'rgba(255, 255, 255, 0.3)'
36         }
37     }
38 }
39 }
扇形的颜色
(1)通过设置颜色实现图形的层次感和空间感。
 1 option ={
 2     series : [
 3         {
 4             name: '访问来源',
 5             type: 'pie',//饼状图类型
 6             radius: '55%',//图表半径
 7             data:[
 8                 {value:235, name:'视频广告'},
 9                 {value:274, name:'联盟广告'},
10                 {value:310, name:'邮件营销'},
11                 {value:335, name:'直接访问'},
12                 {value:400, name:'搜索引擎'}
13             ],
14             roseType: 'angle',//玫瑰图类型
15
16                 itemStyle: {
17     normal: {
18         // 设置扇形的颜色
19         color: '#c23531',
20         shadowBlur: 200,
21         shadowColor: 'rgba(0, 0, 0, 0.5)'
22     }
23 },
24         }
25     ],
26
27     //深色主题
28      backgroundColor: '#2c343c',
29      //背景色设置完成后,同样将文本的样式设置为全局的文本样式
30  textStyle: {
31         color: 'rgba(255, 255, 255, 0.3)'
32     },
33     //每个系列的文本设置在 label.normal.textStyle
34     label: {
35     normal: {
36         textStyle: {
37             color: 'rgba(255, 255, 255, 0.3)'
38         }
39     }
40 },
41 //标签的视觉引导线的颜色设置为浅色
42 labelLine: {
43     normal: {
44         lineStyle: {
45             color: 'rgba(255, 255, 255, 0.3)'
46         }
47     }
48 }
49 }
(2)通过 visualMap 组件将数值的大小映射到明暗度
 1 option ={
 2   backgroundColor: '#2c343c',
 3   visualMap: {
 4     // 不显示 visualMap 组件,只用于明暗度的映射
 5     show: false,
 6     // 映射的最小值为 80
 7     min: 80,
 8     // 映射的最大值为 600
 9     max: 800,
10     inRange: {
11         // 明暗度的范围是 0 到 1
12         colorLightness: [0, 1]
13     }
14 },
15     series : [
16         {
17             name: '访问来源',
18             type: 'pie',//饼状图类型
19             radius: '55%',//图表半径
20             data:[
21                 {value:235, name:'视频广告'},
22                 {value:274, name:'联盟广告'},
23                 {value:310, name:'邮件营销'},
24                 {value:335, name:'直接访问'},
25                 {value:400, name:'搜索引擎'}
26             ],
27             roseType: 'angle',//玫瑰图类型
28              itemStyle: {
29         normal: {
30           color: '#c23531',
31           shadowBlur: 200,
32           shadowColor: 'rgba(0, 0, 0, 0.5)'
33         }
34       }
35         }
36     ],
37
38     //每个系列的文本设置在 label.normal.textStyle
39     label: {
40     normal: {
41         textStyle: {
42             color: 'rgba(255, 255, 255, 0.3)'
43         }
44     }
45 },
46 //标签的视觉引导线的颜色设置为浅色
47 labelLine: {
48     normal: {
49         lineStyle: {
50             color: 'rgba(255, 255, 255, 0.3)'
51         }
52     }
53 }
54 }
异步数据加载
function fetchData(cb) {
  // 通过 setTimeout 模拟异步加载
  setTimeout(function () {
    cb({
      categories: ['衬衫', '羊毛衫', '雪纺衫', '裤子', '高跟鞋', '袜子'],
      data: [5, 20, 36, 10, 10, 20]
    });
  }, 1000);
}
// 初始 option
option = {
  title: {
    text: '异步数据加载示例'
  },
  tooltip: {},
  legend: {
    data: ['销量']
  },
  xAxis: {
    data: []
  },
  yAxis: {},
  series: [
    {
      name: '销量',
      type: 'bar',
      data: []
    }
  ]
};
fetchData(function (data) {
  myChart.setOption({
    xAxis: {
      data: data.categories
    },
    series: [
      {
        // 根据名字对应到相应的系列
        name: '销量',
        data: data.data
      }
    ]
  });
});
Echarts 数据区域缩放组件(dataZoom)
  1 var data1 = [];
  2 var data2 = [];
  3 var data3 = [];
  4 var random = function (max) {
  5   return (Math.random() * max).toFixed(3);
  6 };
  7 for (var i = 0; i < 500; i++) {
  8   data1.push([random(15), random(10), random(1)]);
  9   data2.push([random(10), random(10), random(1)]);
 10   data3.push([random(15), random(10), random(1)]);
 11 }
 12 option = {
 13   animation: false,
 14   legend: {
 15     data: ['scatter', 'scatter2', 'scatter3']
 16   },
 17   tooltip: {},
 18   xAxis: {
 19     type: 'value',
 20     min: 'dataMin',
 21     max: 'dataMax',
 22     splitLine: {
 23       show: true
 24     }
 25   },
 26   yAxis: {
 27     type: 'value',
 28     min: 'dataMin',
 29     max: 'dataMax',
 30     splitLine: {
 31       show: true
 32     }
 33   },
 34   //dataZoom 组件是对数轴(axis) 进行 数据窗口缩放 和 数据窗口平移 操作。
 35   //dataZoom 的运行原理是通过 数据过滤 来达到 数据窗口缩放 的效果。数据过滤模式的设置不同,效果也不同
 36   //dataZoom 的数据窗口范围的设置,目前支持两种形式:百分比形式:参见 dataZoom.start 和 dataZoom.end。绝对数值形式:参见 dataZoom.startValue 和 dataZoom.endValue。
 37  // 这个dataZoom组件,默认控制x轴。
 38   dataZoom: [
 39     {
 40       // 这个 dataZoom 组件是 slider 型 dataZoom 组件
 41       type: 'slider',
 42       show: true,
 43       xAxisIndex: [0],
 44       start: 1, // 左边在 1% 的位置。
 45       end: 35,// 右边在 35% 的位置。
 46     },
 47     {
 48       type: 'slider',
 49       show: true,
 50       yAxisIndex: [0],
 51       left: '93%',
 52       start: 29,
 53       end: 36
 54     },
 55     {
 56       type: 'inside',// 这个 dataZoom 组件是 inside 型 dataZoom 组件
 57       xAxisIndex: [0],
 58       start: 1, // 左边在 1% 的位置。
 59       end: 35// 右边在 35% 的位置。
 60     },
 61     {
 62       type: 'inside',
 63       yAxisIndex: [0],
 64       start: 29,
 65       end: 36
 66     },
 67   ],
 68   series: [
 69     {
 70       name: 'scatter',
 71       type: 'scatter',
 72       itemStyle: {
 73         normal: {
 74           opacity: 0.8
 75         }
 76       },
 77       symbolSize: function (val) {
 78         return val[2] * 40;
 79       },
 80       data: data1
 81     },
 82     {
 83       name: 'scatter2',
 84       type: 'scatter',
 85       itemStyle: {
 86         normal: {
 87           opacity: 0.8
 88         }
 89       },
 90       symbolSize: function (val) {
 91         return val[2] * 40;
 92       },
 93       data: data2
 94     },
 95     {
 96       name: 'scatter3',
 97       type: 'scatter',
 98       itemStyle: {
 99         normal: {
100           opacity: 0.8
101         }
102       },
103       symbolSize: function (val) {
104         return val[2] * 40;
105       },
106       data: data3
107     }
108   ]
109 };
移动端自适应
$.when(
  $.getScript(ROOT_PATH + '/data/asset/data/timelineGDP.js'),
  $.getScript(ROOT_PATH + '/data/asset/data/draggable.js')
).done(function () {
  draggable.init($('div[_echarts_instance_]')[0], myChart, {
    width: 700,
    height: 400,
    throttle: 70
  });

  option = {
    baseOption: {
      title: {
        text: '南丁格尔玫瑰图',
        subtext: '纯属虚构',
        x: 'center'
      },
      tooltip: {

      },
      legend: {
        data: [
          'rose1',
          'rose2',
          'rose3',
          'rose4',
          'rose5',
          'rose6',
          'rose7',
          'rose8'
        ]
      },
      toolbox: {
        show: true,
        feature: {
          mark: { show: true },
          dataView: { show: true, readOnly: false },
          magicType: {
            show: true,
            type: ['pie', 'funnel']
          },
          restore: { show: true },
          saveAsImage: { show: true }
        }
      },
      calculable: true,
      series: [
        {
          name: '半径模式',
          type: 'pie',
          roseType: 'radius',
          label: {
            normal: {
              show: false
            },
            emphasis: {
              show: true
            }
          },
          lableLine: {
            normal: {
              show: false
            },
            emphasis: {
              show: true
            }
          },
          data: [
            { value: 10, name: 'rose1' },
            { value: 5, name: 'rose2' },
            { value: 15, name: 'rose3' },
            { value: 25, name: 'rose4' },
            { value: 20, name: 'rose5' },
            { value: 35, name: 'rose6' },
            { value: 30, name: 'rose7' },
            { value: 40, name: 'rose8' }
          ]
        },
        {
          name: '面积模式',
          type: 'pie',
          roseType: 'area',
          data: [
            { value: 10, name: 'rose1' },
            { value: 5, name: 'rose2' },
            { value: 15, name: 'rose3' },
            { value: 25, name: 'rose4' },
            { value: 20, name: 'rose5' },
            { value: 35, name: 'rose6' },
            { value: 30, name: 'rose7' },
            { value: 40, name: 'rose8' }
          ]
        }
      ]
    },
    media: [
      {
        option: {
          legend: {
            right: 'center',
            bottom: 0,
            orient: 'horizontal'
          },
          series: [
            {
              radius: [20, '50%'],
              center: ['25%', '50%']
            },
            {
              radius: [30, '50%'],
              center: ['75%', '50%']
            }
          ]
        }
      },
      {
        query: {
          minAspectRatio: 1
        },
        option: {
          legend: {
            right: 'center',
            bottom: 0,
            orient: 'horizontal'
          },
          series: [
            {
              radius: [20, '50%'],
              center: ['25%', '50%']
            },
            {
              radius: [30, '50%'],
              center: ['75%', '50%']
            }
          ]
        }
      },
      {
        query: {
          maxAspectRatio: 1
        },
        option: {
          legend: {
            right: 'center',
            bottom: 0,
            orient: 'horizontal'
          },
          series: [
            {
              radius: [20, '50%'],
              center: ['50%', '30%']
            },
            {
              radius: [30, '50%'],
              center: ['50%', '70%']
            }
          ]
        }
      },
      {
        query: {
          maxWidth: 500
        },
        option: {
          legend: {
            right: 10,
            top: '15%',
            orient: 'vertical'
          },
          series: [
            {
              radius: [20, '50%'],
              center: ['50%', '30%']
            },
            {
              radius: [30, '50%'],
              center: ['50%', '75%']
            }
          ]
        }
      }
    ]
  };
  myChart.setOption(option);
});
视觉映射
连续型
 1 option = {
 2
 3   visualMap: {
 4     type: 'continuous',
 5     min: 0,
 6     max: 1000000,
 7     text: ['High', 'Low'],
 8     realtime: false,
 9     calculable: true,
10     color: ['orangered', 'yellow', 'lightskyblue']
11   },
12   series: [
13     {
14       name: 'World Population (2010)',
15       type: 'map',
16       mapType: 'world',
17       roam: true,
18       itemStyle: {
19         emphasis: { label: { show: true } }
20       },
21       data: [
22         { name: 'Afghanistan', value: 28397.812 },
23         { name: 'Angola', value: 19549.124 },
24         { name: 'Albania', value: 3150.143 },
25         { name: 'United Arab Emirates', value: 8441.537 },
26         { name: 'Argentina', value: 40374.224 },
27         { name: 'Armenia', value: 2963.496 },
28         { name: 'French Southern and Antarctic Lands', value: 268.065 },
29         { name: 'Australia', value: 22404.488 },
30         { name: 'Austria', value: 8401.924 },
31         { name: 'Azerbaijan', value: 9094.718 },
32         { name: 'Burundi', value: 9232.753 },
33         { name: 'Belgium', value: 10941.288 },
34         { name: 'Benin', value: 9509.798 },
35         { name: 'Burkina Faso', value: 15540.284 },
36         { name: 'Bangladesh', value: 151125.475 },
37         { name: 'Bulgaria', value: 7389.175 },
38         { name: 'The Bahamas', value: 66402.316 },
39         { name: 'Bosnia and Herzegovina', value: 3845.929 },
40         { name: 'Belarus', value: 9491.07 },
41         { name: 'Belize', value: 308.595 },
42         { name: 'Bermuda', value: 64.951 },
43         { name: 'Bolivia', value: 716.939 },
44         { name: 'Brazil', value: 195210.154 },
45         { name: 'Brunei', value: 27.223 },
46         { name: 'Bhutan', value: 716.939 },
47         { name: 'Botswana', value: 1969.341 },
48         { name: 'Central African Republic', value: 4349.921 },
49         { name: 'Canada', value: 34126.24 },
50         { name: 'Switzerland', value: 7830.534 },
51         { name: 'Chile', value: 17150.76 },
52         { name: 'China', value: 1359821.465 },
53         { name: 'Ivory Coast', value: 60508.978 },
54         { name: 'Cameroon', value: 20624.343 },
55         { name: 'Democratic Republic of the Congo', value: 62191.161 },
56         { name: 'Republic of the Congo', value: 3573.024 },
57         { name: 'Colombia', value: 46444.798 },
58         { name: 'Costa Rica', value: 4669.685 },
59         { name: 'Cuba', value: 11281.768 },
60         { name: 'Northern Cyprus', value: 1.468 },
61         { name: 'Cyprus', value: 1103.685 },
62         { name: 'Czech Republic', value: 10553.701 },
63         { name: 'Germany', value: 83017.404 },
64
65       ]
66     }
67   ]
68 };
分段型
 1 option = {
 2
 3   visualMap: {
 4      type: 'piecewise',
 5     min: 0,
 6     max: 2000000,
 7     splitNumber: 5,
 8
 9     color: ['orangered', 'yellow', 'lightskyblue']
10   },
11   series: [
12     {
13       name: 'World Population (2010)',
14       type: 'map',
15       mapType: 'world',
16       roam: true,
17       itemStyle: {
18         emphasis: { label: { show: true } }
19       },
20       data: [
21         { name: 'Afghanistan', value: 28397.812 },
22         { name: 'Angola', value: 19549.124 },
23         { name: 'Albania', value: 3150.143 },
24         { name: 'United Arab Emirates', value: 8441.537 },
25         { name: 'Argentina', value: 40374.224 },
26         { name: 'Armenia', value: 2963.496 },
27         { name: 'French Southern and Antarctic Lands', value: 268.065 },
28         { name: 'Australia', value: 22404.488 },
29         { name: 'Austria', value: 8401.924 },
30         { name: 'Azerbaijan', value: 9094.718 },
31         { name: 'Burundi', value: 9232.753 },
32         { name: 'Belgium', value: 10941.288 },
33         { name: 'Benin', value: 9509.798 },
34         { name: 'Burkina Faso', value: 15540.284 },
35         { name: 'Bangladesh', value: 151125.475 },
36         { name: 'Bulgaria', value: 7389.175 },
37         { name: 'The Bahamas', value: 66402.316 },
38         { name: 'Bosnia and Herzegovina', value: 3845.929 },
39         { name: 'Belarus', value: 9491.07 },
40         { name: 'Belize', value: 308.595 },
41         { name: 'Bermuda', value: 64.951 },
42         { name: 'Bolivia', value: 716.939 },
43         { name: 'Brazil', value: 195210.154 },
44         { name: 'Brunei', value: 27.223 },
45         { name: 'Bhutan', value: 716.939 },
46         { name: 'Botswana', value: 1969.341 },
47         { name: 'Central African Republic', value: 4349.921 },
48         { name: 'Canada', value: 34126.24 },
49         { name: 'Switzerland', value: 7830.534 },
50         { name: 'Chile', value: 17150.76 },
51         { name: 'China', value: 1359821.465 },
52         { name: 'Ivory Coast', value: 60508.978 },
53         { name: 'Cameroon', value: 20624.343 },
54         { name: 'Democratic Republic of the Congo', value: 62191.161 },
55         { name: 'Republic of the Congo', value: 3573.024 },
56         { name: 'Colombia', value: 46444.798 },
57         { name: 'Costa Rica', value: 4669.685 },
58         { name: 'Cuba', value: 11281.768 },
59         { name: 'Northern Cyprus', value: 1.468 },
60         { name: 'Cyprus', value: 1103.685 },
61         { name: 'Czech Republic', value: 10553.701 },
62         { name: 'Germany', value: 83017.404 },
63
64       ]
65     }
66   ]
67 };
视觉映射方式的配置
 1 option = {
 2     visualMap: [
 3         {
 4             type: 'piecewise'
 5             min: 0,
 6             max: 5000,
 7             dimension: 3,       // series.data 的第四个维度(即 value[3])被映射
 8             seriesIndex: 4,     // 对第四个系列进行映射。
 9             inRange: {          // 选中范围中的视觉配置
10
11           colorLightness: [0.2, 1], // 映射到明暗度上。也就是对本来的颜色进行明暗度处理。 // 本来的颜色可能是从全局色板中选取的颜色,visualMap组件并不关心。
12
13                 color: ['blue', '#121122', 'red'], // 定义了图形颜色映射的颜色列表,
14                                                     // 数据最小值映射到'blue'上,
15                                                     // 最大值映射到'red'上,
16                                                     // 其余自动线性计算。
17                 symbolSize: [30, 100]               // 定义了图形尺寸的映射范围,
18                                                     // 数据最小值映射到30上,
19                                                     // 最大值映射到100上,
20                                                     // 其余自动线性计算。
21             },
22             outOfRange: {       // 选中范围外的视觉配置
23                 symbolSize: [30, 100]
24             }
25         },
26         ...
27     ]
28 };
富文本标签的应用
富文本标签定义
  1 const weatherIcons = {
  2   Sunny: ROOT_PATH + '/data/asset/img/weather/sunny_128.png',
  3   Cloudy: ROOT_PATH + '/data/asset/img/weather/cloudy_128.png',
  4   Showers: ROOT_PATH + '/data/asset/img/weather/showers_128.png'
  5 };
  6 option = {
  7   title: {
  8     text: 'Weather Statistics',
  9     subtext: 'Fake Data',
 10     left: 'center'
 11   },
 12   tooltip: {
 13     trigger: 'item',
 14     formatter: '{a} <br/>{b} : {c} ({d}%)'
 15   },
 16   legend: {
 17     bottom: 10,
 18     left: 'center',
 19     data: ['CityA', 'CityB', 'CityD', 'CityC', 'CityE']
 20   },
 21   series: [
 22     {
 23       type: 'pie',
 24       radius: '65%',
 25       center: ['50%', '50%'],
 26       selectedMode: 'single',
 27       data: [
 28         {
 29           value: 1548,
 30           name: 'CityE',
 31           //统计标签
 32           label: {
 33             formatter: [
 34               '{title|{b}}{abg|}',//文本标题
 35               '  {weatherHead|Weather}{valueHead|Days}{rateHead|Percent}',//列标题
 36               '{hr|}',
 37               '  {Sunny|}{value|202}{rate|55.3%}',
 38               '  {Cloudy|}{value|142}{rate|38.9%}',
 39               '  {Showers|}{value|21}{rate|5.8%}'
 40             ].join('\n'),
 41             backgroundColor: '#eee',
 42             borderColor: '#777',
 43             borderWidth: 1,
 44             borderRadius: 4,
 45             //富文本样式
 46             rich: {
 47               title: {
 48                 color: '#eee',
 49                 align: 'center'
 50               },
 51               abg: {
 52                 backgroundColor: '#333',
 53                 width: '100%',
 54                 align: 'right',
 55                 height: 25,
 56                 borderRadius: [4, 4, 0, 0]
 57               },
 58               Sunny: {
 59                 height: 30,
 60                 align: 'left',
 61                 backgroundColor: {
 62                   image: weatherIcons.Sunny
 63                 }
 64               },
 65               Cloudy: {
 66                 height: 30,
 67                 align: 'left',
 68                 backgroundColor: {
 69                   image: weatherIcons.Cloudy
 70                 }
 71               },
 72               Showers: {
 73                 height: 30,
 74                 align: 'left',
 75                 backgroundColor: {
 76                   image: weatherIcons.Showers
 77                 }
 78               },
 79               weatherHead: {
 80                 color: '#333',
 81                 height: 24,
 82                 align: 'left'
 83               },
 84               hr: {
 85                 borderColor: '#777',
 86                 width: '100%',
 87                 borderWidth: 0.5,
 88                 height: 0
 89               },
 90               value: {
 91                 width: 20,
 92                 padding: [0, 20, 0, 30],
 93                 align: 'left'
 94               },
 95               valueHead: {
 96                 color: '#333',
 97                 width: 20,
 98                 padding: [0, 20, 0, 30],
 99                 align: 'center'
100               },
101               rate: {
102                 width: 40,
103                 align: 'right',
104                 padding: [0, 10, 0, 0]
105               },
106               rateHead: {
107                 color: '#333',
108                 width: 40,
109                 align: 'center',
110                 padding: [0, 10, 0, 0]
111               }
112             }
113           }
114         },
115         { value: 735, name: 'CityC' },
116         { value: 510, name: 'CityD' },
117         { value: 434, name: 'CityB' },
118         { value: 335, name: 'CityA' }
119       ],
120       emphasis: {
121         itemStyle: {
122           shadowBlur: 10,
123           shadowOffsetX: 0,
124           shadowColor: 'rgba(0, 0, 0, 0.5)'
125         }
126       }
127     }
128   ]
129 };
  1 const weatherIcons = {
  2   Sunny: ROOT_PATH + '/data/asset/img/weather/sunny_128.png',
  3   Cloudy: ROOT_PATH + '/data/asset/img/weather/cloudy_128.png',
  4   Showers: ROOT_PATH + '/data/asset/img/weather/showers_128.png'
  5 };
  6 const seriesLabel = {
  7   show: true
  8 };
  9 option = {
 10   title: {
 11     text: 'Weather Statistics'
 12   },
 13   tooltip: {
 14     trigger: 'axis',
 15     axisPointer: {
 16       type: 'shadow'
 17     }
 18   },
 19   legend: {
 20     data: ['City Alpha', 'City Beta', 'City Gamma']
 21   },
 22   grid: {
 23     left: 100
 24   },
 25   toolbox: {
 26     show: true,
 27     feature: {
 28       saveAsImage: {}
 29     }
 30   },
 31   xAxis: {
 32     type: 'value',
 33     name: 'Days',
 34     axisLabel: {
 35       formatter: '{value}'
 36     }
 37   },
 38   yAxis: {
 39     type: 'category',
 40     inverse: true,
 41     data: ['Sunny', 'Cloudy', 'Showers'],
 42     axisLabel: {
 43       formatter: function (value) {
 44         return '{' + value + '| }\n{value|' + value + '}';
 45       },
 46       margin: 20,
 47       rich: {
 48         value: {
 49           lineHeight: 30,
 50           align: 'center'
 51         },
 52         Sunny: {
 53           height: 40,
 54           align: 'center',
 55           backgroundColor: {
 56             image: weatherIcons.Sunny
 57           }
 58         },
 59         Cloudy: {
 60           height: 40,
 61           align: 'center',
 62           backgroundColor: {
 63             image: weatherIcons.Cloudy
 64           }
 65         },
 66         Showers: {
 67           height: 40,
 68           align: 'center',
 69           backgroundColor: {
 70             image: weatherIcons.Showers
 71           }
 72         }
 73       }
 74     }
 75   },
 76   series: [
 77     {
 78       name: 'City Alpha',
 79       type: 'bar',
 80       data: [165, 170, 30],
 81       label: seriesLabel,
 82       markPoint: {
 83         symbolSize: 1,
 84         symbolOffset: [0, '50%'],
 85         label: {
 86           formatter: '{a|{a}\n}{b|{b} }{c|{c}}',
 87           backgroundColor: 'rgb(242,242,242)',
 88           borderColor: '#aaa',
 89           borderWidth: 1,
 90           borderRadius: 4,
 91           padding: [4, 10],
 92           lineHeight: 26,
 93           // shadowBlur: 5,
 94           // shadowColor: '#000',
 95           // shadowOffsetX: 0,
 96           // shadowOffsetY: 1,
 97           position: 'right',
 98           distance: 20,
 99           rich: {
100             a: {
101               align: 'center',
102               color: '#fff',
103               fontSize: 18,
104               textShadowBlur: 2,
105               textShadowColor: '#000',
106               textShadowOffsetX: 0,
107               textShadowOffsetY: 1,
108               textBorderColor: '#333',
109               textBorderWidth: 2
110             },
111             b: {
112               color: '#333'
113             },
114             c: {
115               color: '#ff8811',
116               textBorderColor: '#000',
117               textBorderWidth: 1,
118               fontSize: 22
119             }
120           }
121         },
122         data: [
123           { type: 'max', name: 'max days: ' },
124           { type: 'min', name: 'min days: ' }
125         ]
126       }
127     },
128     {
129       name: 'City Beta',
130       type: 'bar',
131       label: seriesLabel,
132       data: [150, 105, 110]
133     },
134     {
135       name: 'City Gamma',
136       type: 'bar',
137       label: seriesLabel,
138       data: [220, 82, 63]
139     }
140   ]
141 };
自定义象形图富文本标签
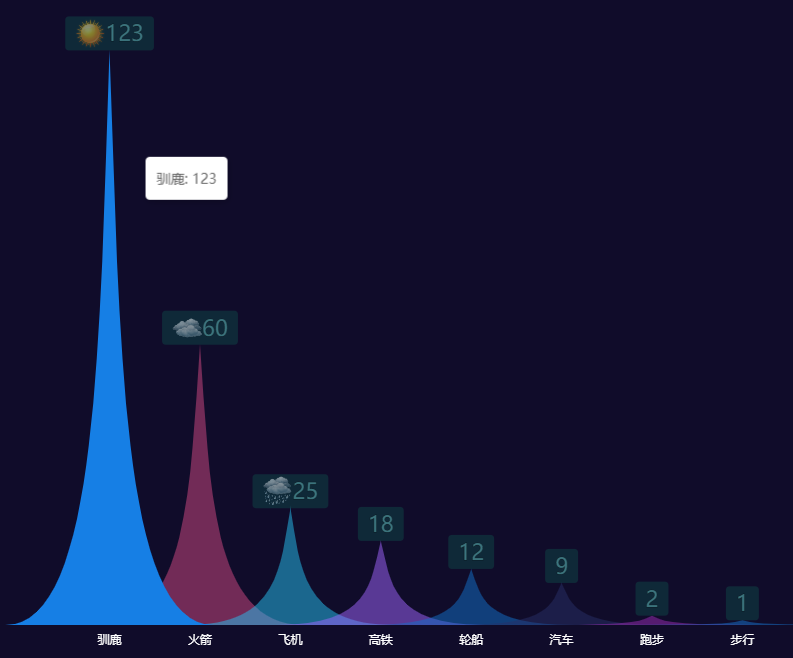
 1 const colors= ["#1576d2", "#d14a82", "#26c1f2", "#a166ff", "#1271cc", "#272f67", "rgba(156, 43, 182, 1)","#1576d2", "#d14a82", "#26c1f2", "#a166ff", "#1271cc"]
 2 const labelRich = {
 3           labelImage0:{
 4            height: 30,
 5           align: 'center',
 6           backgroundColor: {
 7             image:ROOT_PATH + '/data/asset/img/weather/sunny_128.png',
 8           },
 9           },
10         labelImage1:{
11            height: 30,
12           align: 'center',
13           backgroundColor: {
14             image:ROOT_PATH + '/data/asset/img/weather/cloudy_128.png',
15           },
16         },
17         labelImage2:{
18            height: 30,
19           align: 'center',
20           backgroundColor: {
21             image:ROOT_PATH + '/data/asset/img/weather/showers_128.png',
22           },
23         },
24          labelText: {
25               color: 'rgb(103,194,199)',
26               textBorderColor: '#000',
27               textBorderWidth: 1,
28               fontSize: 22
29             }
30 };
31 option = {
32   tooltip: {
33     trigger: 'axis',
34     axisPointer: {
35       type: 'none'
36     },
37     formatter: function (params) {
38       return params[0].name + ': ' + params[0].value;
39     }
40   },
41   xAxis: {
42     data: ['驯鹿', '火箭', '飞机', '高铁', '轮船', '汽车', '跑步', '步行'],
43     axisTick: { show: false },
44     axisLine: { show: false },
45     axisLabel: {
46       color: 'white'
47     }
48   },
49   yAxis: {
50     splitLine: { show: false },
51     axisTick: { show: false },
52     axisLine: { show: false },
53     axisLabel: { show: false }
54   },
55
56   series: [
57     {
58       name: '',
59       type: 'pictorialBar',
60       barCategoryGap: '-130%',
61
62       // symbol: 'path://M0,10 L10,10 L5,0 L0,10 z',
63       symbol: 'path://M0,10 L10,10 C5.5,10 5.5,5 5,0 C4.5,5 4.5,10 0,10 z',
64       itemStyle: {
65          color:function(params){
66         return colors[params.dataIndex]
67       },
68         opacity: 0.5
69       },
70       emphasis: {
71         itemStyle: {
72           opacity: 1
73         }
74       },
75       data: [12300, 60, 25, 18, 12, 9, 2, 1],
76       z: 10,
77        label: {
78          show:true,
79          formatter:function(params){
80                   const values = params.data; // 内容
81                   var labelcolor="labelImage"+params.dataIndex;
82                   return `{${labelcolor}|}{labelText|${values}}`;
83                 },
84           backgroundColor: 'rgb(14,69,70)',
85           borderRadius: 4,
86           padding: [4, 10],
87           lineHeight: 26,
88           // shadowBlur: 5,
89           // shadowColor: '#000',
90           // shadowOffsetX: 0,
91           // shadowOffsetY: 1,
92           position: 'top',//标签停靠位置方向
93           distance: 0,//标签停靠位置距离原点距离
94           rich:labelRich
95         },
96     },
97   ]
98 };
动态颜色的富文本标签
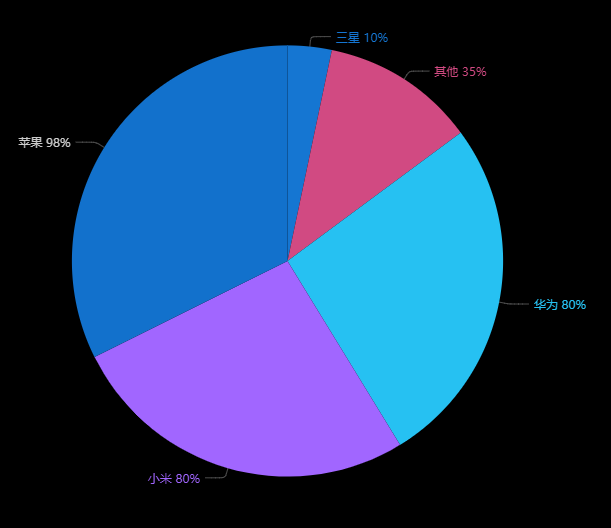
 1 const colors= ["#1576d2", "#d14a82", "#26c1f2", "#a166ff", "#1271cc", "#272f67", "rgba(156, 43, 182, 1)"]
 2 var richT= {// 这个'value'样式表示文字颜色为白色
 3                     labelcolor0: {
 4                        color: colors[0],
 5                     },
 6                      labelcolor1: {
 7                        color: colors[1],
 8                     },
 9                      labelcolor2: {
10                        color: colors[2],
11                     },
12                     labelcolor3: {
13                        color: colors[3],
14                     },
15                 };
16
17 option = {
18     backgroundColor: '#000',
19     title: {
20         text: 'Customized Pie',
21         left: 'center',
22         top: 20,
23         textStyle: {
24             color: '#ccc'
25         }
26     },
27     tooltip: {
28         trigger: 'item',
29         formatter: '{a} <br/>{b} : {c} ({d}%)'
30     },
31     series: [
32         {
33             name: '访问来源',
34             type: 'pie',
35             radius: '55%',
36             center: ['50%', '50%'],
37
38             data: [
39                 {value: 80, name: '华为'},
40                 {value: 98, name: '苹果'},
41                 {value: 10, name: '三星'},
42                 {value: 80, name: '小米'},
43                 {value: 35, name: '其他'}
44             ].sort(function (a, b) { return a.value - b.value; }),
45             itemStyle:{
46                 color:function(params){
47                return colors[params.dataIndex]
48             },
49             },
50             label: {
51
52                 // 这里定义了文本 百分比 是'value'样式的
53                 formatter:function(params){
54                   const values = params.data; // 内容
55                   var labelcolor="labelcolor"+params.dataIndex;
56                   return `{${labelcolor}|${values.name} ${values.value}%}`;
57                 },
58                 rich:richT
59             },
60             labelLine: {
61                 lineStyle: {
62                     color: 'rgba(255, 255, 255, 0.3)'
63                 },
64                 smooth: 0.2,
65                 length: 10,
66                 length2: 20
67             }
68         }
69     ]
70 };

 浙公网安备 33010602011771号