matplotlib横向双柱状图_三柱状图_汉字(horizontal double bar graph & triple bar graph)
Mac机子:
双柱状:
import numpy as np
import matplotlib.pyplot as plt


def bar_number_h(category):
    for rect in category:
        w = rect.get_width()
        plt.text(w, rect.get_y()+rect.get_height()/2, '%d' %int(w), ha='left', va='center')


def draw():
    #中文字符
    plt.rcParams['font.sans-serif'] = ['Arial Unicode MS']

    #数据, 之后要导入表格数据
    Y = ['地铁','公交车','小汽车','出租车','自行车', '步行', '其他']
    year2017 = [635,630,916,103,453,1145,42]
    year2018 = [600,618,934,110,462,1128,41]

    #绘图
    Y_axis = np.arange(len(Y))

    #plt.barh(Y_axis - 0.2, year2017, 0.4, label = '2017')
    #plt.barh(Y_axis + 0.2, year2018, 0.4, label = '2018')

    b2017 = plt.barh(Y_axis - 0.2, year2017, 0.4, label = '2017')
    b2018 = plt.barh(Y_axis + 0.2, year2018, 0.4, label = '2018')

    bar_number_h(b2017)
    bar_number_h(b2018)

    plt.yticks(Y_axis, Y)
    plt.ylabel("出行方式")
    plt.xlabel("出行量")
    plt.title("出行量与出行方")
    plt.legend()
    plt.show()


draw()
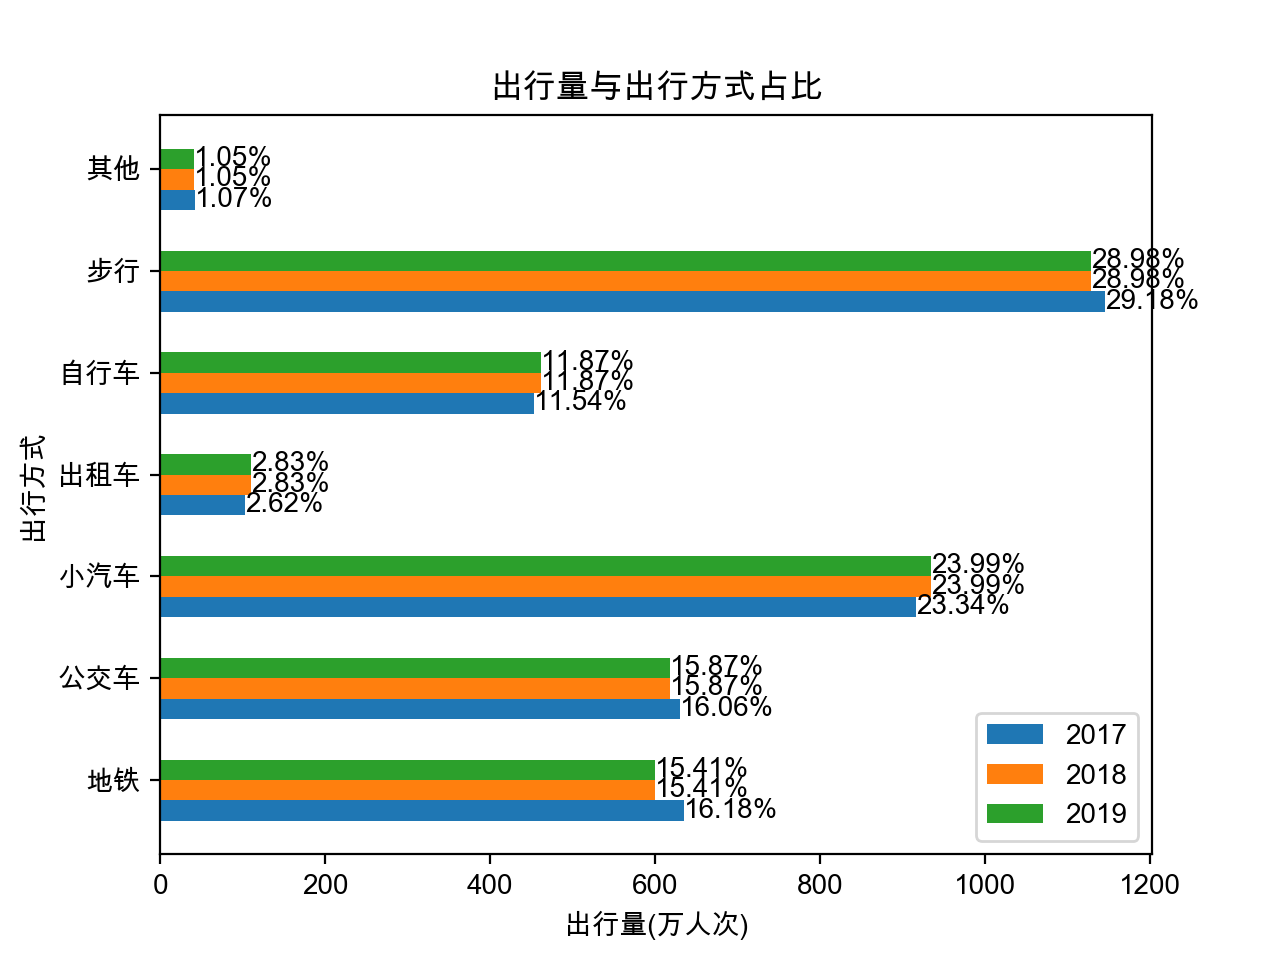
三柱状:
import numpy as np
import matplotlib.pyplot as plt
import math

#标百分比
def bar_number_h(category, year):
    for rect in category:
        w = rect.get_width() #柱状图数值
        total = sum(year)    # 总数
        percent = str(round((w/total)*100, 2))+"%" #百分比
        plt.text(w, rect.get_y()+rect.get_height()/2, percent, ha='left', va='center')#'%d'%int(w)


def draw():
    #中文字符
    plt.rcParams['font.sans-serif'] = ['Arial Unicode MS']

    #数据, 之后要导入表格数据
    Y = ['地铁','公交车','小汽车','出租车','自行车', '步行', '其他']
    year2017 = [635,630,916,103,453,1145,42]
    year2018 = [600,618,934,110,462,1128,41]
    year2019 = [600,618,934,110,462,1128,41]

    #绘图
    Y_axis = np.arange(len(Y))
    X_axis = range(0, 8, 1)

    b2017 = plt.barh(Y_axis - 0.3, year2017, 0.2, label = '2017')
    b2018 = plt.barh(Y_axis - 0.1, year2018, 0.2, label = '2018')
    b2019 = plt.barh(Y_axis + 0.1, year2018, 0.2, label = '2019')

    bar_number_h(b2017, year2017)
    bar_number_h(b2018, year2018)
    bar_number_h(b2019, year2019)

    plt.yticks(Y_axis, Y)
    plt.ylabel("出行方式")
    plt.xlabel("出行量(万人次)")
    plt.title("出行量与出行方式占比")
    plt.legend()
    plt.show()


draw()
字体参考:
https://blog.csdn.net/Parzival_/article/details/110932195?spm=1001.2014.3001.5501

 浙公网安备 33010602011771号