程序的测量和计时
当需要优化一个程序的时候,我们需要通过测量程序的运行时间来判断程序是不是真的优化成功了,最简单的方法就是记录一下程序运行开始的时间和结束的时间,然后计算两者的差值得到运行的时间,但是如果系统有其他因素干扰怎么办?程序运行的时候,CPU被抢占,导致外部记录的时间增长,就会导致测量的时间不准确。
测量时间的系统中的变量
测量程序时间的时候会有很多变量,如后台进程的运行、系统中断、代码和数据对齐、线程的设置、操作系统调度器、系统中的其他用户运行的程序、同系统中的其他用户影响、CPU的电压降压和降频、网络传输影响。
很多因素会干扰到测量,面对这么多干扰该怎么做?先看一个问题。
如果你是一名奥林匹克的教练,下面有两名选手的射击结果,你会更加愿意选择哪一名选手加入队伍?
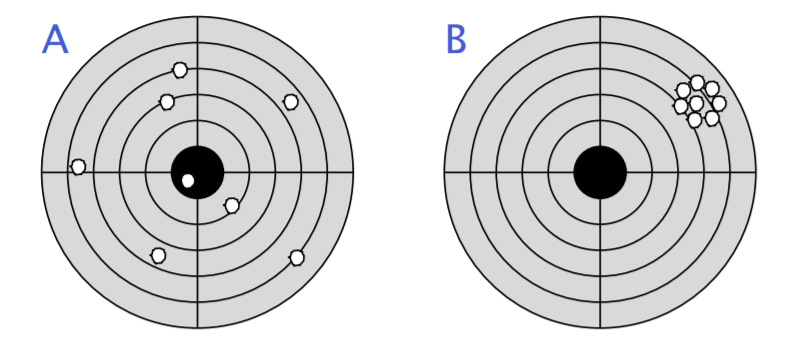
B 会更好,因为教练只要不断教B把射击的方向往靶心打就能获得很好的成绩。而A的变量太多,不知道从哪里开始教。如果测量程序的时候,把环境中影响运行速度的变量减少,甚至形成一个绝对无噪音的系统,就能测得一个准确值,只要不断的比较这个值就能判断程序是不是更快了。
所以,如果我们能尽可能的降低系统中的变量,就能得到一个更加精准的测量值。
测量程序的方法
从程序外部测量和观察(time)
工具就是 shell 命令 /usr/bin/time
time 命令会输出三行,分别是:
real:wall-clock,代表真实世界的时间
user:处理器处理这个程序在 user-mode 花费的时间
sys: 处理器处理这个程序在 kernel mode 花费的时间
并且注意 user + sys 不一定等于 real,因为 CPU 可能会被抢占或者主动放弃。
通过修改程序测算 (clock_gettime)
1、通过函数 clock_gettime(CLOCK_MONOTONIC, …) 能够获得一个精准且自增的时间,自增是指时钟不会因为外部因素而回到之前的时间。
#include <time.h>
struct timespec start, end;
clock_gettime(CLOCK_MONOTONIC, &start);
function_to_measure();
clock_gettime(CLOCK_MONOTONIC, &end);
double tdiff = (end.tv_sec - start.tv_sec)
+ 1e-9*(end.tv_nsec - start.tv_nsec);
时间通常由寄存器或者操作系统维护,所以获取时间都需要走系统调用,但是 clock_gettime 能够在 80ns 左右处理完成。
2、直接读取寄存器TSC(time-stamp counter)的函数:rdtsc()
static __inline__ unsigned long long rdtsc(void)
{
unsigned hi, lo;
__asm__ __volatile__ ("rdtsc" : "=a"(lo), "=d"(hi));
return ( ((unsigned long long)lo)
| (((unsigned long long)hi)<<32));
}
rdtsc 会返回自从启动以来运行的时钟周期(cycle),并且只需要 30ns 左右就能处理完。
看上去 rdtsc() 的方式更快,但是 rdtsc() 是不建议使用的,原因如下:
- 同一台机器上CPU不同核心上的 TSC 返回的值可能不一样
- TSC 可能不是常速度增长的
- 如何把时钟频率转化为时间需要一些技巧
利用中断得到堆栈信息剖析程序 (gprof)
面对一个运行中的程序,可以用 gdb attach 上去,然后把 stack 打出来。如果周期性地不断统计stack的函数,就能够得到在这段时间内哪个函数最耗时,这种方法叫做 “poor man’s profiler”,而 gprof 也就是这么做的。
硬件计数 (perf)
libpfm4 库虚拟化了硬件计数器,能够让每个进程都能有硬件事件的计数器,而一个很知名的软件 perf 使用了这个库做统计,利用 perf stat 就能知道程序运行后,相关计数器的情况,但是在一些虚拟化和云上只能支持部分计数器。
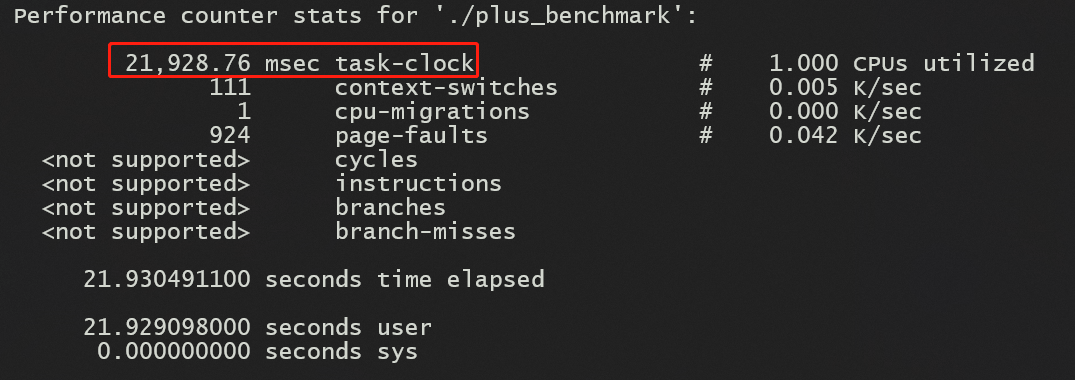
如图,这是我在 WSL 运行 perf stat 得到的结果,可以知道在benchmark的过程中花了多少时间、上下文切换了多少次,发生了多少次页错误。
模拟执行 (cachegrind)
将程序运行的执行模拟执行,能够精准地得到性能数据,常用的工具有 cachegrind。
实践和方法论
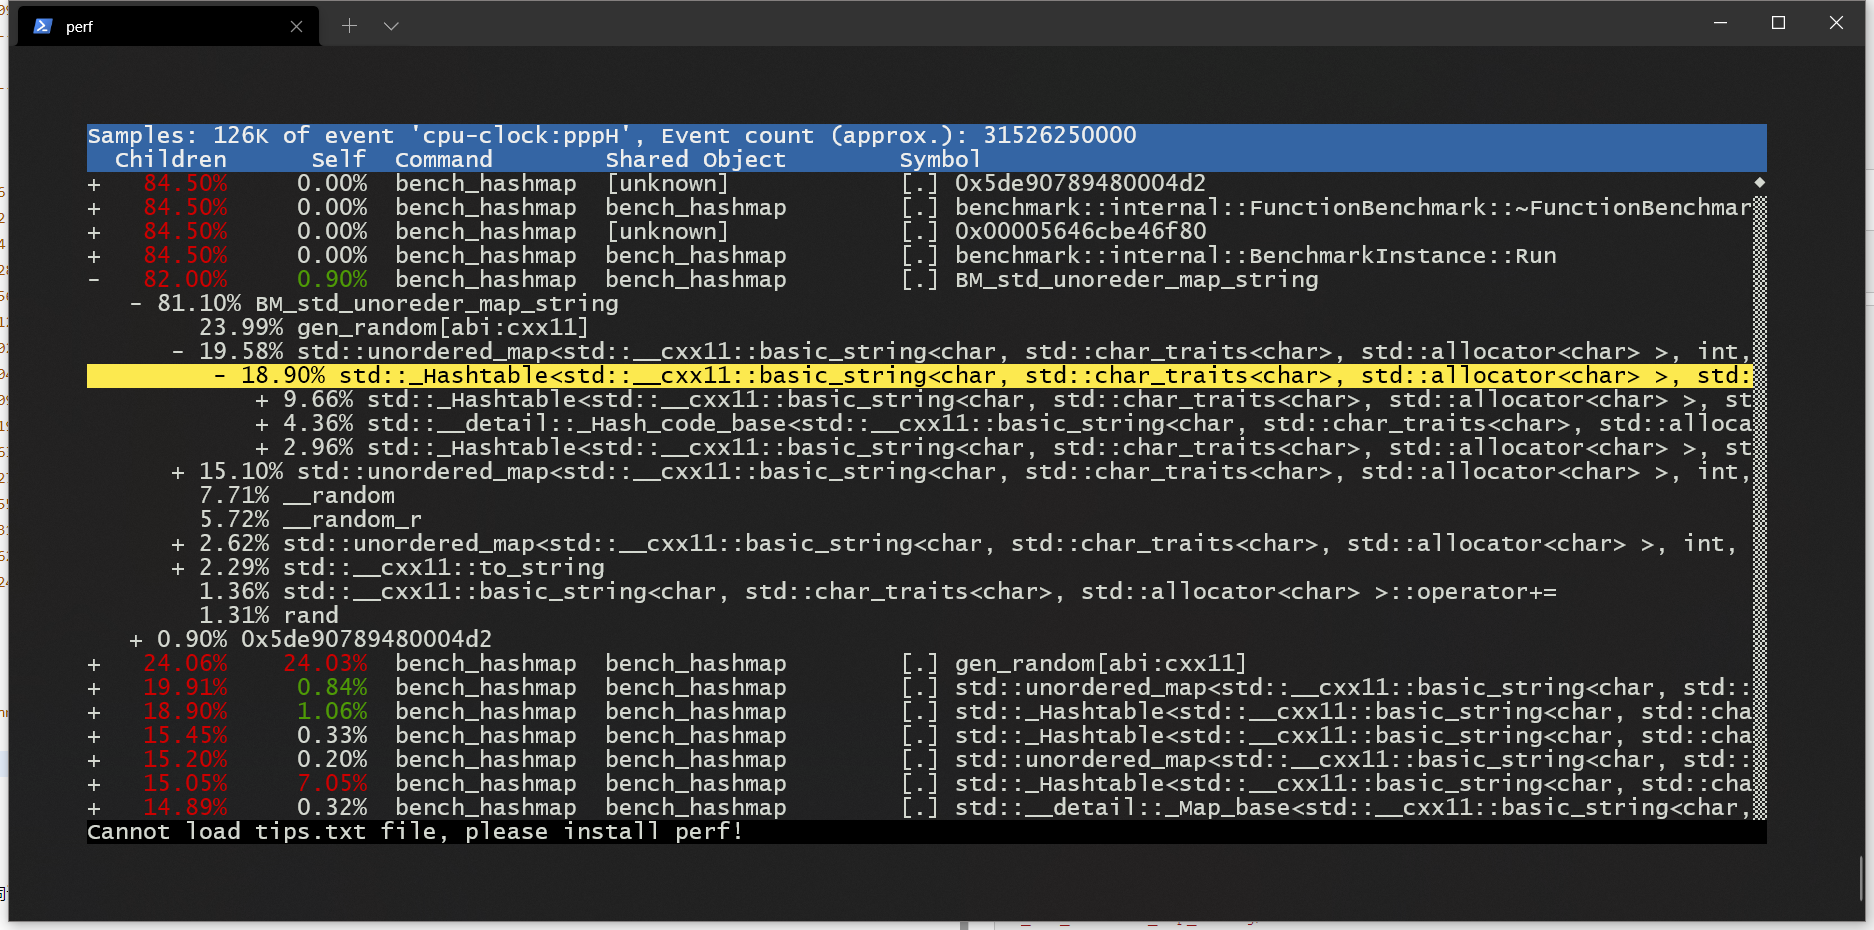
C++ 可以使用 google benchmark + perf 的方法来测量和提高,其中 google benchmark 能够帮你做一些 Marco Benchmark,比如在一个hashmap中查找一个key具体花了多长时间,而 perf record/report 能够帮助你采样程序执行过程的栈信息,得到程序最耗时的部分。
以 hashmap 为例子,我们可以写一个简单的例子:
#include <benchmark/benchmark.h>
#include <vector>
#include <unordered_map>

std::string gen_random(const int len) {
    static const char alphanum[] =
        "0123456789"
        "ABCDEFGHIJKLMNOPQRSTUVWXYZ"
        "abcdefghijklmnopqrstuvwxyz";
    std::string tmp_s;
    tmp_s.reserve(len);

    for (int i = 0; i < len; ++i) {
        tmp_s += alphanum[rand() % (sizeof(alphanum) - 1)];
    }

    return tmp_s;
}

static void BM_std_unoreder_map_string(benchmark::State& state) {
  // hashmap size set to state.range(0).
  size_t n = state.range(0);
  size_t str_len = 20;
  std::unordered_map<std::string, int> hashmap;
  for (int i = 0; i < n; ++i) {
    hashmap[gen_random(str_len) + std::to_string(i)] = i;
  }

  for (auto _ : state) {
    auto x = gen_random(str_len);
    hashmap.find(x);
  }
}
// state.range(0) = 1, 2, 4, 8 .... 1 << 20
BM_std_unoreder_map_string->RangeMultiplier(2)->Range(2, 1 << 20);
// Run the benchmark
BENCHMARK_MAIN();
编译并执行:
g++ bench_hashmap.cc -lbenchmark -lpthread -o bench_hashmap
./bench_hashmap
Running ./bench_hashmap
Run on (2 X 2595.12 MHz CPU s)
CPU Caches:
  L1 Data 32 KiB (x2)
  L1 Instruction 32 KiB (x2)
  L2 Unified 4096 KiB (x2)
  L3 Unified 16384 KiB (x1)
Load Average: 0.24, 0.12, 0.09
------------------------------------------------------------------------------
Benchmark                                    Time             CPU   Iterations
------------------------------------------------------------------------------
BM_std_unoreder_map_string/2               323 ns          323 ns      2150285
BM_std_unoreder_map_string/4               329 ns          329 ns      2123106
BM_std_unoreder_map_string/8               340 ns          340 ns      2020744
BM_std_unoreder_map_string/16              341 ns          341 ns      2046727
BM_std_unoreder_map_string/32              341 ns          341 ns      2059667
BM_std_unoreder_map_string/64              342 ns          342 ns      2077136
BM_std_unoreder_map_string/128             356 ns          356 ns      2066642
BM_std_unoreder_map_string/256             358 ns          358 ns      1954444
BM_std_unoreder_map_string/512             355 ns          355 ns      1934426
BM_std_unoreder_map_string/1024            357 ns          357 ns      1956012
BM_std_unoreder_map_string/2048            356 ns          356 ns      1963245
BM_std_unoreder_map_string/4096            356 ns          356 ns      1960173
BM_std_unoreder_map_string/8192            365 ns          365 ns      1931352
BM_std_unoreder_map_string/16384           370 ns          370 ns      1895805
BM_std_unoreder_map_string/32768           380 ns          380 ns      1847477
BM_std_unoreder_map_string/65536           429 ns          429 ns      1637434
BM_std_unoreder_map_string/131072          500 ns          500 ns      1000000
BM_std_unoreder_map_string/262144          570 ns          570 ns      1232023
BM_std_unoreder_map_string/524288          620 ns          620 ns      1145109
运行 perf
$ perf record -g ./bench_hashmap
$ perf report -g
虽然测量的方式有很多种,并且不同语言的实践方法可能不一样,但是最终的方法论还是一样的:
1、测量程序A的耗时
2、对程序做一些优化得到A',希望相比于以前有优化
3、测量A'的耗时
4、如果A' < A,代表程序优化成功
5、如果失败,回到第二步重新优化
本文来自博客园,作者:pokpok,转载请注明原文链接:https://www.cnblogs.com/pokpok/p/15852623.html

 浙公网安备 33010602011771号