给kprobe添加字符数据显示方式
目前kprobe不支持单个字符的输出显示方式,下面的patch给kprobe增加了一种%c的数据显示方式:
From aafaf9fde1e72fb734a48840645ec43dce56661d Mon Sep 17 00:00:00 2001
From: Donglin Peng <dolinux.peng@gmail.com>
Date: Tue, 13 Dec 2022 00:56:20 -0800
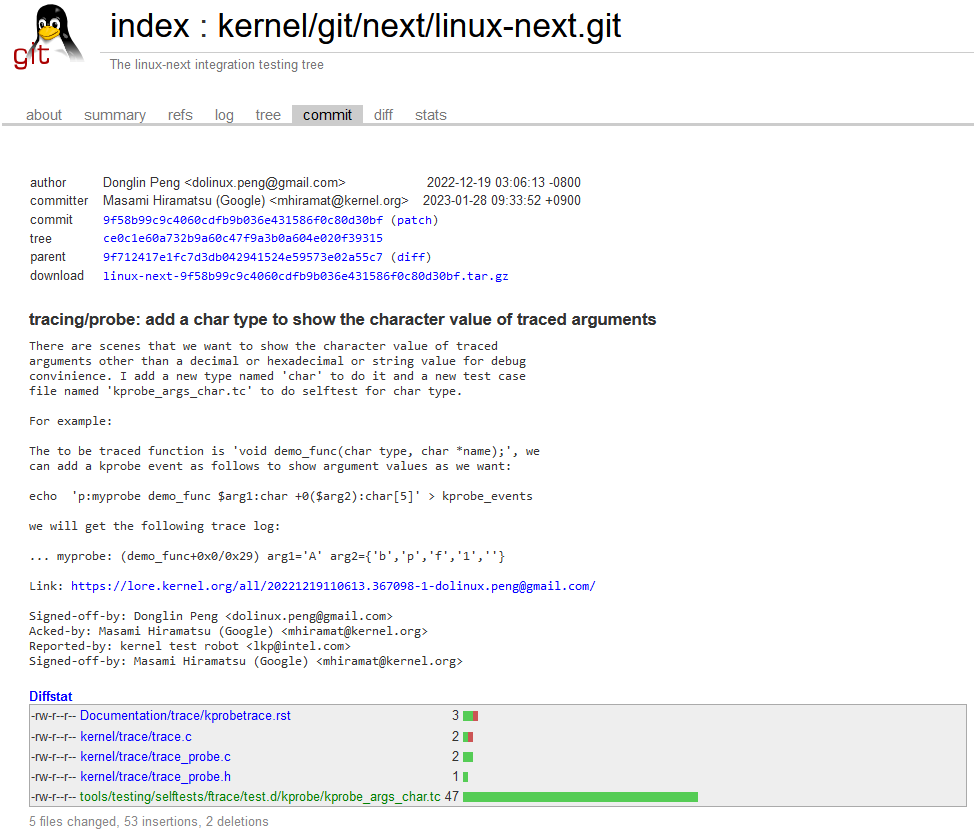
Subject: [PATCH] tracing/probe: add a char type to print the character value
of traced arguments
There are scenes that we want to show the character value of traced
arguments other than a decimal or hexadecimal or string value for debug
convinience. Add a new type named 'char' to do it.
For example:
echo 'p:myprobe xxxx $arg1:char' > kprobe_events
Signed-off-by: Donglin Peng <dolinux.peng@gmail.com>
---
Documentation/trace/kprobetrace.rst | 3 ++-
kernel/trace/trace_probe.c | 2 ++
2 files changed, 4 insertions(+), 1 deletion(-)
diff --git a/Documentation/trace/kprobetrace.rst b/Documentation/trace/kprobetrace.rst
index 4274cc6a2f94..007972a3c5c4 100644
--- a/Documentation/trace/kprobetrace.rst
+++ b/Documentation/trace/kprobetrace.rst
@@ -58,7 +58,7 @@ Synopsis of kprobe_events
NAME=FETCHARG : Set NAME as the argument name of FETCHARG.
FETCHARG:TYPE : Set TYPE as the type of FETCHARG. Currently, basic types
(u8/u16/u32/u64/s8/s16/s32/s64), hexadecimal types
- (x8/x16/x32/x64), "string", "ustring" and bitfield
+ (x8/x16/x32/x64), "char", "string", "ustring" and bitfield
are supported.
(\*1) only for the probe on function entry (offs == 0).
@@ -80,6 +80,7 @@ E.g. 'x16[4]' means an array of x16 (2bytes hex) with 4 elements.
Note that the array can be applied to memory type fetchargs, you can not
apply it to registers/stack-entries etc. (for example, '$stack1:x8[8]' is
wrong, but '+8($stack):x8[8]' is OK.)
+Char type can be used to show the character value of traced arguments.
String type is a special type, which fetches a "null-terminated" string from
kernel space. This means it will fail and store NULL if the string container
has been paged out. "ustring" type is an alternative of string for user-space.
diff --git a/kernel/trace/trace_probe.c b/kernel/trace/trace_probe.c
index 36dff277de46..a4abf7f6c295 100644
--- a/kernel/trace/trace_probe.c
+++ b/kernel/trace/trace_probe.c
@@ -50,6 +50,7 @@ DEFINE_BASIC_PRINT_TYPE_FUNC(x8, u8, "0x%x")
DEFINE_BASIC_PRINT_TYPE_FUNC(x16, u16, "0x%x")
DEFINE_BASIC_PRINT_TYPE_FUNC(x32, u32, "0x%x")
DEFINE_BASIC_PRINT_TYPE_FUNC(x64, u64, "0x%Lx")
+DEFINE_BASIC_PRINT_TYPE_FUNC(char, u8, "%c")
int PRINT_TYPE_FUNC_NAME(symbol)(struct trace_seq *s, void *data, void *ent)
{
@@ -93,6 +94,7 @@ static const struct fetch_type probe_fetch_types[] = {
ASSIGN_FETCH_TYPE_ALIAS(x16, u16, u16, 0),
ASSIGN_FETCH_TYPE_ALIAS(x32, u32, u32, 0),
ASSIGN_FETCH_TYPE_ALIAS(x64, u64, u64, 0),
+ ASSIGN_FETCH_TYPE_ALIAS(char, u8, u8, 0),
ASSIGN_FETCH_TYPE_ALIAS(symbol, ADDR_FETCH_TYPE, ADDR_FETCH_TYPE, 0),
ASSIGN_FETCH_TYPE_END
--
2.25.1
下面是使用方法:
echo 'p:test_bpf1 test_bpf_dump name=+0(+8($arg1)):string name_c8=+0(+8($arg1)):char name_c8_array=+0(+8($arg1)):char[6]' > kprobe_events
下面是trace输出:
#           TASK-PID     CPU#  |||||  TIMESTAMP  FUNCTION
#              | |         |   |||||     |         |
            bash-431     [003] .....  1616.184892: test_bpf1: (test_bpf_dump+0x0/0x65) name="bpf1" name_c8=b name_c8_array={b,p,f,1,,}
目前这个patch已经合入社区:
本文来自博客园,作者:dolinux,未经同意,禁止转载

 浙公网安备 33010602011771号