关于机器学习的几件小事(一)——聚类模型
 聚类属于无监督学习,模型好坏评价方式和监督学习中求误差(真实值)的方式不同
聚类效果没有对不对,只有好不好
通常来说,如果模型在不同簇之间表现出差异性(相互远离),相同簇中表现处相似性(相互靠近),那么这个模型就被认为是好的模型
聚类属于无监督学习,模型好坏评价方式和监督学习中求误差(真实值)的方式不同
聚类效果没有对不对,只有好不好
通常来说,如果模型在不同簇之间表现出差异性(相互远离),相同簇中表现处相似性(相互靠近),那么这个模型就被认为是好的模型
Kmeans 聚类模型
聚类属于无监督学习,模型好坏评价方式和监督学习中求误差(真实值)的方式不同。聚类效果没有对不对,只有好不好。通常来说,如果模型在不同簇之间表现出差异性(相互远离),相同簇中表现处相似性(相互靠近),那么这个模型就被认为是好的模型。
from sklearn.cluster import KMeans
from sklearn.datasets import make_blobs


def load_data():
    """ 构造聚类数据集 """
    x, y = make_blobs(n_samples=500, n_features=2, centers=4, random_state=1)
    return x, y


if __name__ == "__main__":
    x, y = load_data()
    model = KMeans(n_clusters=4, random_state=0).fit(x)
    labels = model.labels_
    centroid = model.cluster_centers_
    inertia = model.inertia_
    print("簇类标签:{}".format(labels))
    print("质心:{}".format(centroid))
    print("cost fun inertia_: {}".format(inertia))
曾今使用过 inertia 来作为模型评估指标,将不同 n_clusters 对应的 inertia_ 值绘制成一个曲线,观察肘部的位置,将其对应的 n_clusters 作为最佳的分类数。inertia_ 是一个距离概念,我们只知道它越小越好,但是到底小到成什么程度算好呢?这个就很难定论。inertia_ 需要计算距离,如果输入 x 的维度非常高,那么整个聚类过程的计算量会非常大。同时 inertia_ 会随着 n_clusters 的增大而减小,这并不意味着随着 n_cluster 的增加模型效果越来越好了。
轮廓系数
- 样本与其自身所在的簇中的其他样本的相似度a,等于样本与同一簇中所有其他点之间的平均距离
- 样本与其他簇中的样本的相似度b,等于样本与下一个最近的簇中的所有点之间的平均距离
- 根据聚类的要求”簇内差异小,簇外差异大“,我们希望b永远大于a,并且大得越多越好。\(s = \dfrac{b-a}{max(a, b)}\)
- 可知轮廓系数的取值范围是\((-1, 1)\)
- 总结:轮廓系数越接近1模型效果越好,负数则表示模型效果非常差
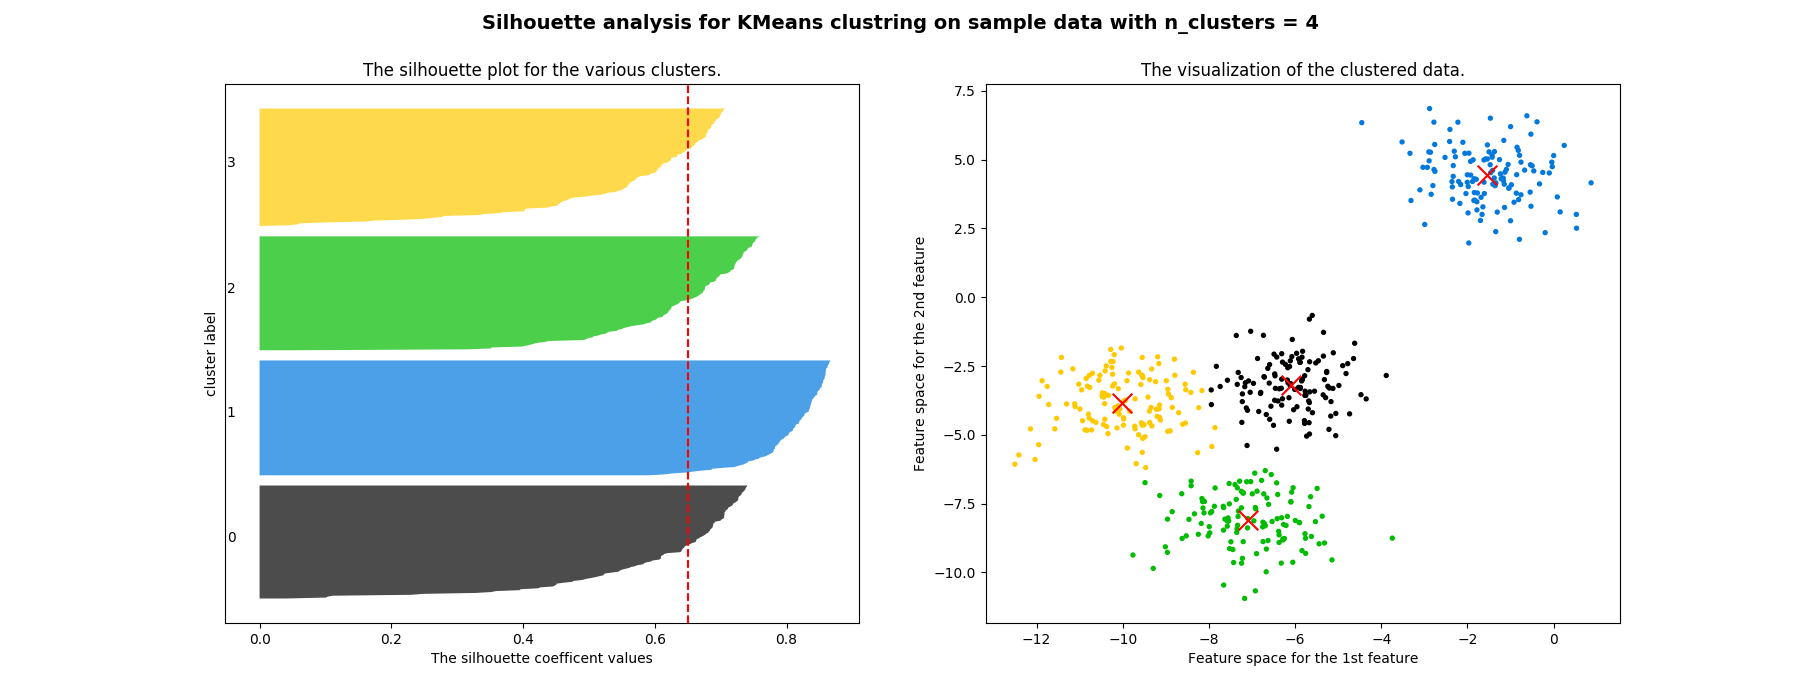
轮廓系数分布图
- 红色的虚线表示所有样本的平均轮廓系数
- 不同颜色块表示了各个样本的轮廓系数
- 左图不仅能看出轮廓系数,还能看出不同簇内元素的数量
- 右图是样本在二维平面的分布
参考代码:
from sklearn.datasets import make_blobs
import numpy as np
from sklearn.cluster import KMeans
from sklearn.metrics import silhouette_score, silhouette_samples
import matplotlib.pyplot as plt
import matplotlib.cm as cm


def load_data():
    """ 构造聚类数据集 """
    x, y = make_blobs(n_samples=500, n_features=2, centers=4, random_state=1)
    return x, y

def kmeans(x, k):
    """ 训练并可视化 """
    fig, (ax1, ax2) = plt.subplots(1, 2)
    fig.set_size_inches(18, 7)
    model = KMeans(n_clusters=k, random_state=10).fit(x)
    cluster_labels = model.labels_
    # 平均轮廓系数
    silhouette_avg = silhouette_score(x, cluster_labels)
    # 样本轮廓系数
    sample_silhouette_values = silhouette_samples(x, cluster_labels)
    # y 轴初始值
    y_lower = 10
    for i in range(k):
        # 第 i 个簇的轮廓系数, cluster_labels == i 这是布尔索引
        ith_cluster_silhouette_values = sample_silhouette_values[cluster_labels == i]
        # 排序(为了可视化)
        ith_cluster_silhouette_values.sort()
        size_cluster_i = ith_cluster_silhouette_values.shape[0]
        # 上界
        y_upper = y_lower + size_cluster_i
        color = cm.nipy_spectral(float(i) / k)
        ax1.fill_betweenx(np.arange(y_lower, y_upper)
                        , ith_cluster_silhouette_values
                        , facecolor=color
                        , alpha=0.7
                        )
        ax1.text(-0.05
                , y_lower + 0.5 * size_cluster_i
                , str(i)
                )
        y_lower = y_upper + 10
    ax1.set_title("The silhouette plot for the various clusters.")
    ax1.set_xlabel("The silhouette coefficent values")
    ax1.set_ylabel("cluster label")
    ax1.axvline(x=silhouette_avg, color='red', linestyle="--")
    ax1.set_yticks([])
    colors = cm.nipy_spectral(cluster_labels.astype(float) / k)
    ax2.scatter(x[:, 0], x[:, 1]
                , marker='o'
                , s=8
                , c=colors
                )
    centers = model.cluster_centers_
    ax2.scatter(centers[:, 0], centers[:, 1]
                , marker='x'
                , c='red'
                , s=200
                , alpha=1
                    )
    ax2.set_title("The visualization of the clustered data.")
    ax2.set_xlabel("Feature space for the 1st feature")
    ax2.set_ylabel("Feature space for the 2nd feature")
    plt.suptitle(("Silhouette analysis for KMeans clustring on sample data "
                "with n_clusters = %d" % k),
                fontsize=14,
                fontweight='bold')
    plt.savefig('./silhouette_img.png')


if __name__ == "__main__":
    x, y = load_data()
    kmeans(x, 4)

 浙公网安备 33010602011771号