Kubernetes Logging with Filebeat and Elasticsearch
Basic Infrastructure for ELk
1.Introduction
This is the first post of a 2 part series where we will set-up production grade Kubernetes logging for applications deployed in the cluster and the cluster itself. We will be using Elasticsearch as the logging backend for this. The Elasticsearch setup will be extremely scalable and fault tolerant.
2. Deployment Architecture

- Elasticsearch Data Node Pods are deployed as a Stateful Set with a headless service to provide Stable Network Identities.
- Elasticsearch Master Node Pods are deployed as a Replica Set with a headless service which will help in Auto-discovery.
- Elasticsearch Client Node Pods are deployed as a Replica Set with an internal service which will allow access to the Data Nodes for R/W requests.
- Kibana and ElasticHQ Pods are deployed as Replica Sets with Services accessible outside the Kubernetes cluster but still internal to your Subnetwork (not publicly exposed unless otherwise required).
- HPA (Horizontal Pod Auto-scaler) deployed for Client Nodes to enable auto-scaling under high load.
Important things to keep in mind:
- Setting
ES_JAVA_OPTSenv variable. - Setting
CLUSTER_NAMEenv variable. - Setting
NUMBER_OF_MASTERS(to avoid split-brain problem) env variable for master deployment. In case of 3 masters we have set it as 2. - Setting correct
Pod-AntiAffinitypolicies among similar pods in order to ensure HA if a worker node fails.
Let's jump right at deploying these services to our GKE cluster.
2.1 Deployment and Headless Service for Master Nodes
Deploy the following manifest to create master nodes and the headless service:
apiVersion: v1
kind: Namespace
metadata:
  name: elasticsearch
---
apiVersion: apps/v1beta1
kind: Deployment
metadata:
  name: es-master
  namespace: elasticsearch
  labels:
    component: elasticsearch
    role: master
spec:
  replicas: 3
  template:
    metadata:
      labels:
        component: elasticsearch
        role: master
    spec:
      affinity:
        podAntiAffinity:
          preferredDuringSchedulingIgnoredDuringExecution:
          - weight: 100
            podAffinityTerm:
              labelSelector:
                matchExpressions:
                - key: role
                  operator: In
                  values:
                  - master
              topologyKey: kubernetes.io/hostname
      initContainers:
      - name: init-sysctl
        image: busybox:1.27.2
        command:
        - sysctl
        - -w
        - vm.max_map_count=262144
        securityContext:
          privileged: true
      containers:
      - name: es-master
        image: quay.io/pires/docker-elasticsearch-kubernetes:6.2.4
        env:
        - name: NAMESPACE
          valueFrom:
            fieldRef:
              fieldPath: metadata.namespace
        - name: NODE_NAME
          valueFrom:
            fieldRef:
              fieldPath: metadata.name
        - name: CLUSTER_NAME
          value: my-es
        - name: NUMBER_OF_MASTERS
          value: "2"
        - name: NODE_MASTER
          value: "true"
        - name: NODE_INGEST
          value: "false"
        - name: NODE_DATA
          value: "false"
        - name: HTTP_ENABLE
          value: "false"
        - name: ES_JAVA_OPTS
          value: -Xms256m -Xmx256m
        - name: PROCESSORS
          valueFrom:
            resourceFieldRef:
              resource: limits.cpu
        resources:
          limits:
            cpu: 2
        ports:
        - containerPort: 9300
          name: transport
        volumeMounts:
        - name: storage
          mountPath: /data
      volumes:
          - emptyDir:
              medium: ""
            name: "storage"
---
apiVersion: v1
kind: Service
metadata:
  name: elasticsearch-discovery
  namespace: elasticsearch
  labels:
    component: elasticsearch
    role: master
spec:
  selector:
    component: elasticsearch
    role: master
  ports:
  - name: transport
    port: 9300
    protocol: TCP
  clusterIP: None
If you follow the logs of any of the master-node pods, you will witness the master election among them. This is when the master-node pods choose which one is the leader of the group. When following the logs of the master-nodes, you will also see when new data and client nodes are added.
root$ kubectl -n elasticsearch logs -f po/es-master-594b58b86c-9jkj2 | grep ClusterApplierService
[2018-10-21T07:41:54,958][INFO ][o.e.c.s.ClusterApplierService] [es-master-594b58b86c-9jkj2] detected_master {es-master-594b58b86c-bj7g7}{1aFT97hQQ7yiaBc2CYShBA}{Q3QzlaG3QGazOwtUl7N75Q}{10.9.126.87}{10.9.126.87:9300}, added {{es-master-594b58b86c-lfpps}{wZQmXr5fSfWisCpOHBhaMg}{50jGPeKLSpO9RU_HhnVJCA}{10.9.124.81}{10.9.124.81:9300},{es-master-594b58b86c-bj7g7}{1aFT97hQQ7yiaBc2CYShBA}{Q3QzlaG3QGazOwtUl7N75Q}{10.9.126.87}{10.9.126.87:9300},}, reason: apply cluster state (from master [master {es-master-594b58b86c-bj7g7}{1aFT97hQQ7yiaBc2CYShBA}{Q3QzlaG3QGazOwtUl7N75Q}{10.9.126.87}{10.9.126.87:9300} committed version [3]])
It can be seen above that the es-master pod named es-master-594b58b86c-bj7g7 was elected as the leader and the other 2 pods were added to the cluster.
The headless service named elasticsearch-discovery is set by default as an env variable in the docker image and is used for discovery among the nodes. This can of course be overridden.
2.2 Data Nodes Deployment
We will use the following manifest to deploy Stateful Set and Headless Service for Data Nodes:
apiVersion: v1
kind: Namespace
metadata:
  name: elasticsearch
---
apiVersion: storage.k8s.io/v1beta1
kind: StorageClass
metadata:
  name: fast
provisioner: kubernetes.io/gce-pd
parameters:
  type: pd-ssd
  fsType: xfs
allowVolumeExpansion: true
---
apiVersion: apps/v1beta1
kind: StatefulSet
metadata:
  name: es-data
  namespace: elasticsearch
  labels:
    component: elasticsearch
    role: data
spec:
  serviceName: elasticsearch-data
  replicas: 3
  template:
    metadata:
      labels:
        component: elasticsearch
        role: data
    spec:
      affinity:
        podAntiAffinity:
          preferredDuringSchedulingIgnoredDuringExecution:
          - weight: 100
            podAffinityTerm:
              labelSelector:
                matchExpressions:
                - key: role
                  operator: In
                  values:
                  - data
              topologyKey: kubernetes.io/hostname
      initContainers:
      - name: init-sysctl
        image: busybox:1.27.2
        command:
        - sysctl
        - -w
        - vm.max_map_count=262144
        securityContext:
          privileged: true
      containers:
      - name: es-data
        image: quay.io/pires/docker-elasticsearch-kubernetes:6.2.4
        env:
        - name: NAMESPACE
          valueFrom:
            fieldRef:
              fieldPath: metadata.namespace
        - name: NODE_NAME
          valueFrom:
            fieldRef:
              fieldPath: metadata.name
        - name: CLUSTER_NAME
          value: my-es
        - name: NODE_MASTER
          value: "false"
        - name: NODE_INGEST
          value: "false"
        - name: HTTP_ENABLE
          value: "false"
        - name: ES_JAVA_OPTS
          value: -Xms256m -Xmx256m
        - name: PROCESSORS
          valueFrom:
            resourceFieldRef:
              resource: limits.cpu
        resources:
          limits:
            cpu: 2
        ports:
        - containerPort: 9300
          name: transport
        volumeMounts:
        - name: storage
          mountPath: /data
  volumeClaimTemplates:
  - metadata:
      name: storage
      annotations:
        volume.beta.kubernetes.io/storage-class: "fast"
    spec:
      accessModes: [ "ReadWriteOnce" ]
      storageClassName: fast
      resources:
        requests:
          storage: 10Gi
---
apiVersion: v1
kind: Service
metadata:
  name: elasticsearch-data
  namespace: elasticsearch
  labels:
    component: elasticsearch
    role: data
spec:
  ports:
  - port: 9300
    name: transport
  clusterIP: None
  selector:
    component: elasticsearch
    role: data
The headless service in the case of data nodes provides stable network identities to the nodes and also helps with the data transfer among them.
It is important to format the persistent volume before attaching it to the pod. This can be done by specifying the volume type when creating the storage class. We can also set a flag to allow volume expansion on the fly. More can be read about that here.
parameters:
 type: pd-ssd
 fsType: xfs
allowVolumeExpansion: true
2.3 Client Nodes Deployment
We will use the following manifest to create the Deployment and External Service for the Client Nodes:
apiVersion: apps/v1beta1
kind: Deployment
metadata:
  name: es-client
  namespace: elasticsearch
  labels:
    component: elasticsearch
    role: client
spec:
  replicas: 2
  template:
    metadata:
      labels:
        component: elasticsearch
        role: client
    spec:
      affinity:
        podAntiAffinity:
          preferredDuringSchedulingIgnoredDuringExecution:
          - weight: 100
            podAffinityTerm:
              labelSelector:
                matchExpressions:
                - key: role
                  operator: In
                  values:
                  - client
              topologyKey: kubernetes.io/hostname
      initContainers:
      - name: init-sysctl
        image: busybox:1.27.2
        command:
        - sysctl
        - -w
        - vm.max_map_count=262144
        securityContext:
          privileged: true
      containers:
      - name: es-client
        image: quay.io/pires/docker-elasticsearch-kubernetes:6.2.4
        env:
        - name: NAMESPACE
          valueFrom:
            fieldRef:
              fieldPath: metadata.namespace
        - name: NODE_NAME
          valueFrom:
            fieldRef:
              fieldPath: metadata.name
        - name: CLUSTER_NAME
          value: my-es
        - name: NODE_MASTER
          value: "false"
        - name: NODE_DATA
          value: "false"
        - name: HTTP_ENABLE
          value: "true"
        - name: ES_JAVA_OPTS
          value: -Xms256m -Xmx256m
        - name: NETWORK_HOST
          value: _site_,_lo_
        - name: PROCESSORS
          valueFrom:
            resourceFieldRef:
              resource: limits.cpu
        resources:
          limits:
            cpu: 1
        ports:
        - containerPort: 9200
          name: http
        - containerPort: 9300
          name: transport
        volumeMounts:
        - name: storage
          mountPath: /data
      volumes:
          - emptyDir:
              medium: ""
            name: storage
---
apiVersion: v1
kind: Service
metadata:
  name: elasticsearch
  namespace: elasticsearch
  labels:
    component: elasticsearch
    role: client
spec:
  selector:
    component: elasticsearch
    role: client
  ports:
  - name: http
    port: 9200
  type: LoadBalancer
The purpose of the service deployed here is to access the ES Cluster from outside the Kubernetes cluster but still internal to our subnet. The annotation “cloud.google.com/load-balancer-type: Internal” ensures this.
However, if the application reading/writing to our ES cluster is deployed within the cluster then the Elasticsearch service can be accessed by http://elasticsearch.elasticsearch:9200.
Once all components are deployed we should verify the following:
- Elasticsearch deployment from inside the Kubernetes cluster using an Ubuntu container.
root$ kubectl run my-shell --rm -i --tty --image ubuntu -- bash
root@my-shell-68974bb7f7-pj9x6:/# curl http://elasticsearch.elasticsearch:9200/_cluster/health?pretty
{
"cluster_name" : "my-es",
"status" : "green",
"timed_out" : false,
"number_of_nodes" : 7,
"number_of_data_nodes" : 2,
"active_primary_shards" : 0,
"active_shards" : 0,
"relocating_shards" : 0,
"initializing_shards" : 0,
"unassigned_shards" : 0,
"delayed_unassigned_shards" : 0,
"number_of_pending_tasks" : 0,
"number_of_in_flight_fetch" : 0,
"task_max_waiting_in_queue_millis" : 0,
"active_shards_percent_as_number" : 100.0
}
-
Elasticsearch deployment from outside the cluster using the GCP Internal Load balancer IP (in this case 10.9.120.8). When we check the health using curl
http://10.9.120.8:9200/_cluster/health?prettythe output should be the same as above. -
Anti-Affinity Rules for our ES-Pods:
root$ kubectl -n elasticsearch get pods -o wide
NAME                         READY     STATUS    RESTARTS   AGE       IP            NODE
es-client-69b84b46d8-kr7j4   1/1       Running   0          10m       10.8.14.52   gke-cluster1-pool1-d2ef2b34-t6h9
es-client-69b84b46d8-v5pj2   1/1       Running   0          10m       10.8.15.53   gke-cluster1-pool1-42b4fbc4-cncn
es-data-0                    1/1       Running   0          12m       10.8.16.58   gke-cluster1-pool1-4cfd808c-kpx1
es-data-1                    1/1       Running   0          12m       10.8.15.52   gke-cluster1-pool1-42b4fbc4-cncn
es-master-594b58b86c-9jkj2   1/1       Running   0          18m       10.8.15.51   gke-cluster1-pool1-42b4fbc4-cncn
es-master-594b58b86c-bj7g7   1/1       Running   0          18m       10.8.16.57   gke-cluster1-pool1-4cfd808c-kpx1
es-master-594b58b86c-lfpps   1/1       Running   0          18m       10.8.14.51   gke-cluster1-pool1-d2ef2b34-t6h9
2.4 Scaling Considerations
We can deploy auto scalers for our client nodes depending on our CPU thresholds. A sample HPA for client node might look something like this:
apiVersion: autoscaling/v1
kind: HorizontalPodAutoscaler
metadata:
 name: es-client
 namespace: elasticsearch
spec:
 maxReplicas: 5
 minReplicas: 2
 scaleTargetRef:
   apiVersion: extensions/v1beta1
   kind: Deployment
   name: es-client
targetCPUUtilizationPercentage: 80
Whenever the autoscaler kicks in, we can watch the new client-node pods being added to the cluster by observing the logs of any of the master-node pods.
In case of Data-Node Pods all we have to do is increase the number of replicas using the K8 Dashboard or GKE console. The newly created data node will be automatically added to the cluster and will start replicating data from other nodes.
Master-Node Pods do not require auto scaling as they only store cluster-state information. In case you want to add more data nodes make sure there is not an even number of master nodes in the cluster. Also, make sure the environment variable NUMBER_OF_MASTERS is updated accordingly.
# Check logs of es-master leader pod
root$ kubectl -n elasticsearch logs po/es-master-594b58b86c-bj7g7 | grep ClusterApplierService
[2018-10-21T07:41:53,731][INFO ][o.e.c.s.ClusterApplierService] [es-master-594b58b86c-bj7g7] new_master {es-master-594b58b86c-bj7g7}{1aFT97hQQ7yiaBc2CYShBA}{Q3QzlaG3QGazOwtUl7N75Q}{10.9.126.87}{10.9.126.87:9300}, added {{es-master-594b58b86c-lfpps}{wZQmXr5fSfWisCpOHBhaMg}{50jGPeKLSpO9RU_HhnVJCA}{10.9.124.81}{10.9.124.81:9300},}, reason: apply cluster state (from master [master {es-master-594b58b86c-bj7g7}{1aFT97hQQ7yiaBc2CYShBA}{Q3QzlaG3QGazOwtUl7N75Q}{10.9.126.87}{10.9.126.87:9300} committed version [1] source [zen-disco-elected-as-master ([1] nodes joined)[{es-master-594b58b86c-lfpps}{wZQmXr5fSfWisCpOHBhaMg}{50jGPeKLSpO9RU_HhnVJCA}{10.9.124.81}{10.9.124.81:9300}]]])

[2018-10-21T07:41:55,162][INFO ][o.e.c.s.ClusterApplierService] [es-master-594b58b86c-bj7g7] added {{es-master-594b58b86c-9jkj2}{x9Prp1VbTq6_kALQVNwIWg}{7NHUSVpuS0mFDTXzAeKRcg}{10.9.125.81}{10.9.125.81:9300},}, reason: apply cluster state (from master [master {es-master-594b58b86c-bj7g7}{1aFT97hQQ7yiaBc2CYShBA}{Q3QzlaG3QGazOwtUl7N75Q}{10.9.126.87}{10.9.126.87:9300} committed version [3] source [zen-disco-node-join[{es-master-594b58b86c-9jkj2}{x9Prp1VbTq6_kALQVNwIWg}{7NHUSVpuS0mFDTXzAeKRcg}{10.9.125.81}{10.9.125.81:9300}]]])

[2018-10-21T07:48:02,485][INFO ][o.e.c.s.ClusterApplierService] [es-master-594b58b86c-bj7g7] added {{es-data-0}{SAOhUiLiRkazskZ_TC6EBQ}{qirmfVJBTjSBQtHZnz-QZw}{10.9.126.88}{10.9.126.88:9300},}, reason: apply cluster state (from master [master {es-master-594b58b86c-bj7g7}{1aFT97hQQ7yiaBc2CYShBA}{Q3QzlaG3QGazOwtUl7N75Q}{10.9.126.87}{10.9.126.87:9300} committed version [4] source [zen-disco-node-join[{es-data-0}{SAOhUiLiRkazskZ_TC6EBQ}{qirmfVJBTjSBQtHZnz-QZw}{10.9.126.88}{10.9.126.88:9300}]]])

[2018-10-21T07:48:21,984][INFO ][o.e.c.s.ClusterApplierService] [es-master-594b58b86c-bj7g7] added {{es-data-1}{fiv5Wh29TRWGPumm5ypJfA}{EXqKGSzIQquRyWRzxIOWhQ}{10.9.125.82}{10.9.125.82:9300},}, reason: apply cluster state (from master [master {es-master-594b58b86c-bj7g7}{1aFT97hQQ7yiaBc2CYShBA}{Q3QzlaG3QGazOwtUl7N75Q}{10.9.126.87}{10.9.126.87:9300} committed version [5] source [zen-disco-node-join[{es-data-1}{fiv5Wh29TRWGPumm5ypJfA}{EXqKGSzIQquRyWRzxIOWhQ}{10.9.125.82}{10.9.125.82:9300}]]])

[2018-10-21T07:50:51,245][INFO ][o.e.c.s.ClusterApplierService] [es-master-594b58b86c-bj7g7] added {{es-client-69b84b46d8-v5pj2}{MMjA_tlTS7ux-UW44i0osg}{rOE4nB_jSmaIQVDZCjP8Rg}{10.9.125.83}{10.9.125.83:9300},}, reason: apply cluster state (from master [master {es-master-594b58b86c-bj7g7}{1aFT97hQQ7yiaBc2CYShBA}{Q3QzlaG3QGazOwtUl7N75Q}{10.9.126.87}{10.9.126.87:9300} committed version [6] source [zen-disco-node-join[{es-client-69b84b46d8-v5pj2}{MMjA_tlTS7ux-UW44i0osg}{rOE4nB_jSmaIQVDZCjP8Rg}{10.9.125.83}{10.9.125.83:9300}]]])
The logs of the leading master pod clearly depict when each node gets added to the cluster. It is extremely useful in case of debugging issues。
3. Deploying Kibana and ES-HQ
Kibana is a simple tool to visualize ES-data and ES-HQ helps in the administration and monitoring of Elasticsearch clusters. For our Kibana and ES-HQ deployment we keep the following things in mind:
We must provide the name of the ES-Cluster as an environment variable to the docker image.
The service to access the Kibana/ES-HQ deployment is internal to our organisation only, i.e. No public IP is created. We will need to use a GCP Internal load balancer.
3.1 Kibana Deployment
We will use the following manifest to create Kibana Deployment and Service:
apiVersion: apps/v1
kind: Deployment
metadata:
  namespace: logging
  name: kibana
  labels:
    component: kibana
spec:
  replicas: 1
  selector:
    matchLabels:
     component: kibana
  template:
    metadata:
      labels:
        component: kibana
    spec:
      containers:
      - name: kibana
        image: docker.elastic.co/kibana/kibana-oss:6.2.2
        env:
        - name: CLUSTER_NAME
          value: my-es
        - name: ELASTICSEARCH_URL
          value: http://elasticsearch.elasticsearch:9200
        resources:
          limits:
            cpu: 200m
          requests:
            cpu: 100m
        ports:
        - containerPort: 5601
          name: http
---
apiVersion: v1
kind: Service
metadata:
  namespace: logging
  name: kibana
  annotations:
    cloud.google.com/load-balancer-type: "Internal"
  labels:
    component: kibana
spec:
  selector:
    component: kibana
  ports:
  - name: http
    port: 5601
  type: LoadBalancer
3.2 ES-HQ Deployment
We will use the following manifest to create ES-HQ Deployment and Service:
apiVersion: apps/v1beta1
kind: Deployment
metadata:
  name: es-hq
  namespace: elasticsearch
  labels:
    component: elasticsearch
    role: hq
spec:
  replicas: 1
  template:
    metadata:
      labels:
        component: elasticsearch
        role: hq
    spec:
      containers:
      - name: es-hq
        image: elastichq/elasticsearch-hq:release-v3.4.0
        env:
        - name: HQ_DEFAULT_URL
          value: http://elasticsearch:9200
        resources:
          limits:
            cpu: 0.5
        ports:
        - containerPort: 5000
          name: http
---
apiVersion: v1
kind: Service
metadata:
  name: hq
  namespace: elasticsearch
  labels:
    component: elasticsearch
    role: hq
spec:
  selector:
    component: elasticsearch
    role: hq
  ports:
  - name: http
    port: 5000
  type: LoadBalancer
We can access both these services using the newly created Internal LoadBalancers.
Go to http://<External-Ip-Kibana-Service>/app/kibana#/home?_g=()
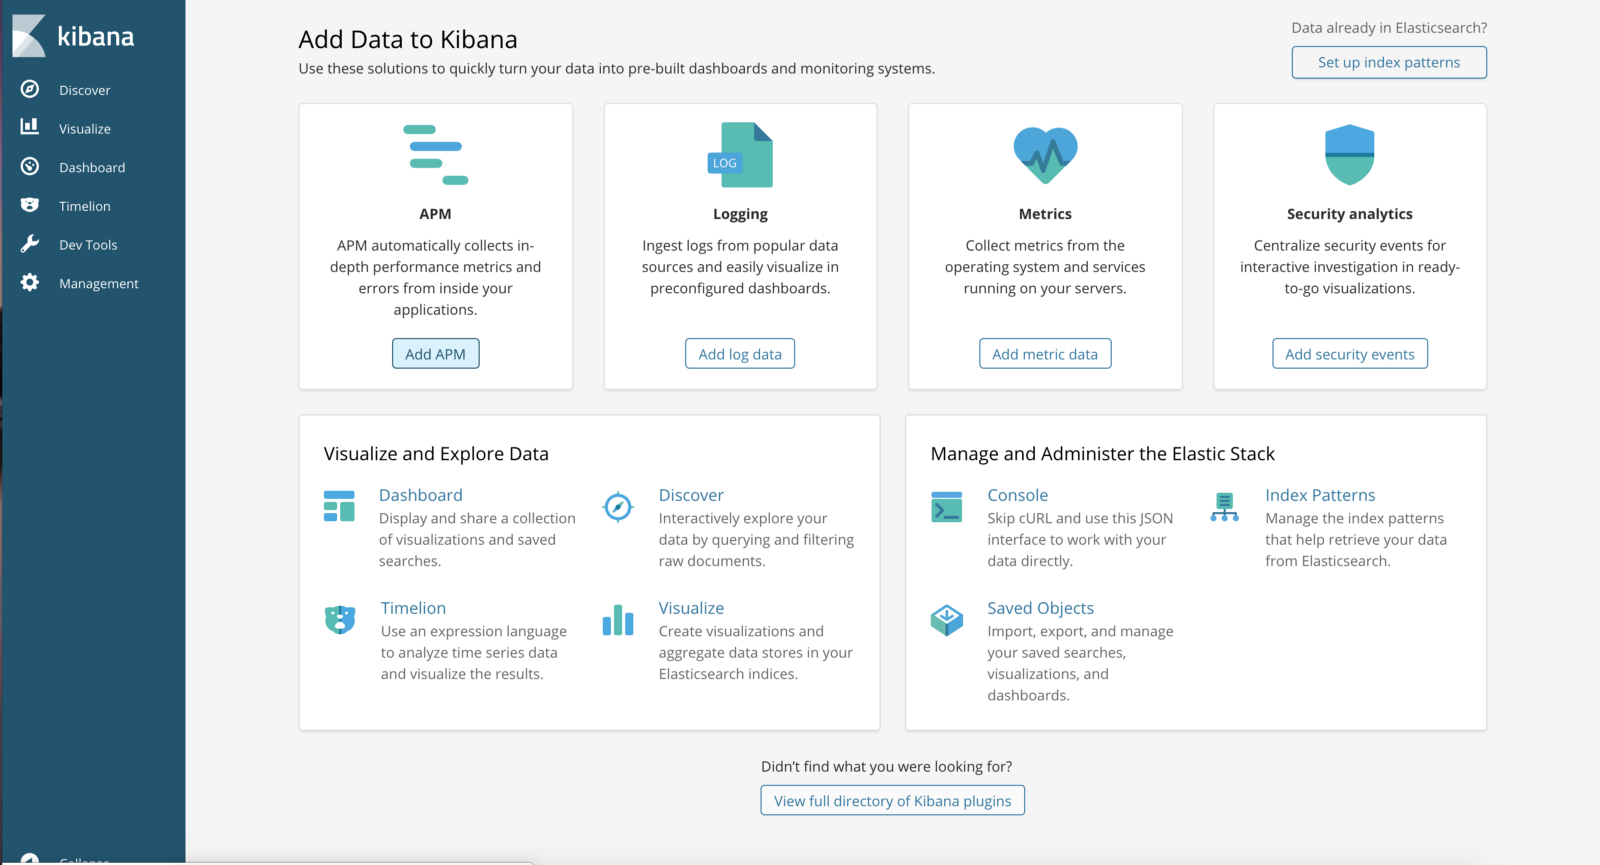
Kibana Dashboard:
Go to http://<External-Ip-ES-Hq-Service>/#!/clusters/my-es
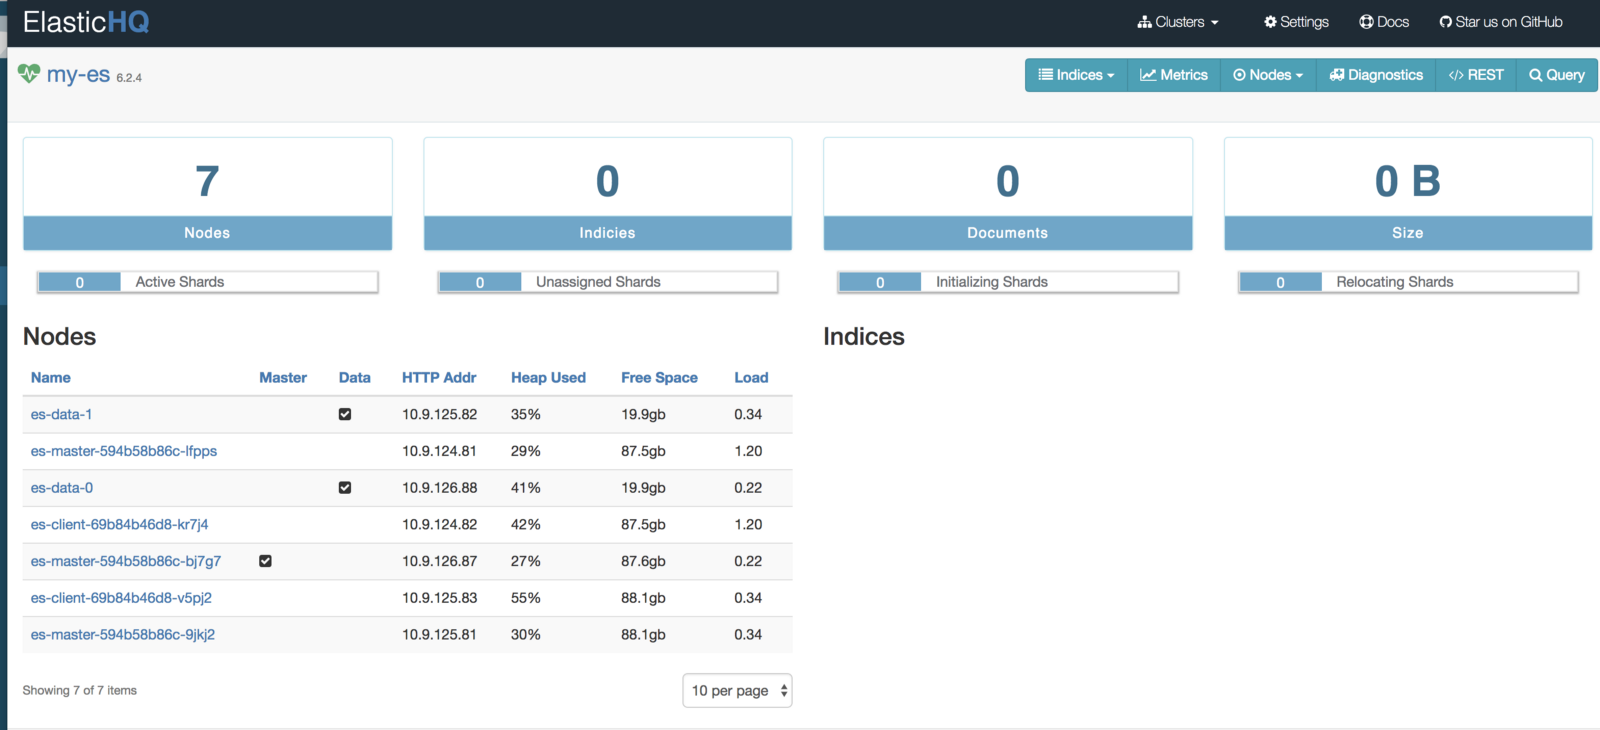
ElasticHQ Dashboard for Cluster Monitoring and Management
4. Conclusion
This concludes deploying ES backend for logging. The Elasticsearch we deployed can be used by other applications as well. The client nodes should scale automatically under high load and data nodes can be added by incrementing the replica count in the statefulset. We will also have to tweak a few env vars but it is fairly straightforward. In the next blog we will learn about deploying a Filebeat DaemonSet in order to send logs to the Elasticsearch backend.
Deploy Filebeat in the Kubernetes Cluster
1. Introduction
In this tutorial we will learn about configuring Filebeat to run as a DaemonSet in our Kubernetes cluster in order to ship logs to the Elasticsearch backend. We are using Filebeat instead of FluentD or FluentBit because it is an extremely lightweight utility and has a first class support for Kubernetes. It is best for production level setups. This blog post is the second in a two-part series. The first post runs through the deployment architecture for the nodes and deploying Kibana and ES-HQ.
2. Deployment Architecture
Filebeat will run as a DaemonSet in our Kubernetes cluster. It will be:
- Deployed in a separate namespace called Logging.
- Pods will be scheduled on both Master nodes and Worker Nodes.
- Master Node pods will forward api-server logs for audit and cluster administration purposes.
- Client Node pods will forward workload related logs for application observability.
2.1 Creating Filebeat ServiceAccount and ClusterRole
Deploy the following manifest to create the required permissions for Filebeat pods.
apiVersion: v1
kind: Namespace
metadata:
  name: logging
---
apiVersion: v1
kind: ServiceAccount
metadata:
  name: filebeat
  namespace: logging
  labels:
    k8s-app: filebeat
---
apiVersion: rbac.authorization.k8s.io/v1beta1
kind: ClusterRole
metadata:
  name: filebeat
  namespace: logging
  labels:
    k8s-app: filebeat
rules:
- apiGroups: [""] # "" indicates the core API group
  resources:
  - namespaces
  - pods
  verbs:
  - get
  - watch
  - list
---
apiVersion: rbac.authorization.k8s.io/v1beta1
kind: ClusterRoleBinding
metadata:
  name: filebeat
  namespace: logging
subjects:
- kind: ServiceAccount
  name: filebeat
  namespace: kube-system
roleRef:
  kind: ClusterRole
  name: filebeat
  apiGroup: rbac.authorization.k8s.io
We should make sure that ClusterRole permissions are as limited as possible from the security point of view. If either of the pods associated with this service account gets compromised then the attacker would not be able to gain access to the entire cluster or applications running in it.
2.2 Creating Filebeat ConfigMap
Use the following manifest to create a ConfigMap which will be used by Filebeat pods.
apiVersion: v1
kind: Namespace
metadata:
  name: logging
---
apiVersion: v1
kind: ConfigMap
metadata:
  name: filebeat-config
  namespace: logging
  labels:
    k8s-app: filebeat
    kubernetes.io/cluster-service: "true"
data:
  filebeat.yml: |-
    filebeat.config:
    #  inputs:
    #    path: ${path.config}/inputs.d/*.yml
    #    reload.enabled: true
      modules:
        path: ${path.config}/modules.d/*.yml
        reload.enabled: true
    filebeat.autodiscover:
      providers:
        - type: kubernetes
          hints.enabled: true
          include_annotations: ["artifact.spinnaker.io/name","ad.datadoghq.com/tags"]
          include_labels: ["app.kubernetes.io/name"]
          labels.dedot: true
          annotations.dedot: true
          templates:
            - condition:
                equals:
                  kubernetes.namespace: myapp   #Set the namespace in which your app is running, can add multiple conditions in case of more than 1 namespace.
              config:
                - type: docker
                  containers.ids:
                    - "${data.kubernetes.container.id}"
                  multiline:
                    pattern: '^[A-Za-z ]+[0-9]{2} (?:[01]\d|2[0123]):(?:[012345]\d):(?:[012345]\d)'.   #Timestamp regex for the app logs. Change it as per format.
                    negate: true
                    match: after
            - condition:
                equals:
                  kubernetes.namespace: elasticsearch
              config:
                - type: docker
                  containers.ids:
                    - "${data.kubernetes.container.id}"
                  multiline:
                    pattern: '^\[[0-9]{4}-[0-9]{2}-[0-9]{2}|^[0-9]{4}-[0-9]{2}-[0-9]{2}T'
                    negate: true
                    match: after

    processors:
      - add_cloud_metadata: ~
      - drop_fields:
          when:
            has_fields: ['kubernetes.labels.app']
          fields:
            - 'kubernetes.labels.app'
    output.elasticsearch:
      hosts: ['${ELASTICSEARCH_HOST:elasticsearch}:${ELASTICSEARCH_PORT:9200}']
Important concepts for the Filebeat ConfigMap:
hints.enabled: This activates Filebeat’s hints module for Kubernetes. By using this we can use pod annotations to pass config directly to Filebeat pod. We can specify different multiline patterns and various other types of config. More about this can be read here.include_annotations: Setting this to true enables Filebeat to retain any pod annotation for a particular log entry. These annotations can be later used to filter logs in the Kibana console.include_labels: Setting this to true enables Filebeat to retain any pod labels for a particular log entry. These labels can be later used to filter logs in the Kibana console.
We can also filter logs for a particular namespace and then can process the log entries accordingly. Here docker log processor is used. We can also use different multiline patterns for different namespaces.- The output is set to Elasticsearch because we are using Elasticsearch as the storage backend. Alternatively, this can also point to Redis, Logstash, Kafka or even a File. More about this can be read here.
- Cloud metadata processor includes some host specific fields in the log entry. This is helpful when we try to filter logs specific to a particular worker node.
2.3 Deploying Filebeat DaemonSet
Use the manifest below to deploy the Filebeat DaemonSet.
apiVersion: v1
kind: Namespace
metadata:
  name: logging
---
apiVersion: extensions/v1beta1
kind: DaemonSet
metadata:
  name: filebeat
  namespace: logging
  labels:
    k8s-app: filebeat
spec:
  template:
    metadata:
      labels:
        k8s-app: filebeat
    spec:
      serviceAccountName: filebeat
      terminationGracePeriodSeconds: 30
      tolerations:
      - effect: NoSchedule
        key: node-role.kubernetes.io/master
      containers:
      - name: filebeat
        image: elastic/filebeat:6.5.4
        args: [
          "-c", "/usr/share/filebeat/filebeat.yml",
          "-e",
        ]
        env:
        - name: ELASTICSEARCH_HOST
          value: elasticsearch.elasticsearch
        - name: ELASTICSEARCH_PORT
          value: "9200"
        securityContext:
          runAsUser: 0
          # If using Red Hat OpenShift uncomment this:
          #privileged: true
        resources:
          limits:
            memory: 200Mi
          requests:
            cpu: 100m
            memory: 100Mi
        volumeMounts:
        - name: config
          mountPath: /usr/share/filebeat/filebeat.yml
          readOnly: true
          subPath: filebeat.yml
        - name: inputs
          mountPath: /usr/share/filebeat/inputs.d
          readOnly: true
        - name: data
          mountPath: /usr/share/filebeat/data
        - name: varlibdockercontainers
          mountPath: /var/lib/docker/containers
          readOnly: true
      volumes:
      - name: config
        configMap:
          defaultMode: 0600
          name: filebeat-config
      - name: varlibdockercontainers
        hostPath:
          path: /var/lib/docker/containers
      - name: inputs
        configMap:
          defaultMode: 0600
          name: filebeat-inputs
      # data folder stores a registry of read status for all files, so we don't send everything again on a Filebeat pod restart
      - name: data
        hostPath:
          path: /var/lib/filebeat-data
          type: DirectoryOrCreate
---
Let’s see what is going on here:
Logs for each pod are written to /var/log/docker/containers. We are mounting this directory from the host to the Filebeat pod and then Filebeat processes the logs according to the provided configuration.
We have set the env var ELASTICSEARCH_HOST to elasticsearch.elasticsearch to refer to the Elasticsearch client service which was created in part 1 of this article. In case you already have an Elasticsearch cluster running the env var should be set to point to it.
Please note the following setting in the manifest:
    tolerations:
      - effect: NoSchedule
        key: node-role.kubernetes.io/master
This makes sure that our Filebeat DaemonSet schedules a pod on the master node as well. Once the Filebeat DaemonSet is deployed we can check if our pods get scheduled properly.
root$ kubectl -n logging get pods  -o wide
NAME             READY   STATUS    RESTARTS   AGE   IP            NODE                                         NOMINATED NODE   READINESS GATES
filebeat-4kchs   1/1     Running   0          6d    100.96.8.2    ip-10-10-30-206.us-east-2.compute.internal   <none>           <none>
filebeat-6nrpc   1/1     Running   0          6d    100.96.7.6    ip-10-10-29-252.us-east-2.compute.internal   <none>           <none>
filebeat-7qs2s   1/1     Running   0          6d    100.96.1.6    ip-10-10-30-161.us-east-2.compute.internal   <none>           <none>
filebeat-j5xz6   1/1     Running   0          6d    100.96.5.3    ip-10-10-28-186.us-east-2.compute.internal   <none>           <none>
filebeat-pskg5   1/1     Running   0          6d    100.96.64.4   ip-10-10-29-142.us-east-2.compute.internal   <none>           <none>
filebeat-vjdtg   1/1     Running   0          6d    100.96.65.3   ip-10-10-30-118.us-east-2.compute.internal   <none>           <none>
filebeat-wm24j   1/1     Running   0          6d    100.96.0.4    ip-10-10-28-162.us-east-2.compute.internal   <none>           <none>

root$ kubectl -get nodes -o wide
NAME                                         STATUS   ROLES    AGE   VERSION   INTERNAL-IP    EXTERNAL-IP   OS-IMAGE                       KERNEL-VERSION   CONTAINER-RUNTIME
ip-10-10-28-162.us-east-2.compute.internal   Ready    master   6d    v1.14.8   10.10.28.162   <none>        Debian GNU/Linux 9 (stretch)   4.9.0-9-amd64    docker://18.6.3
ip-10-10-28-186.us-east-2.compute.internal   Ready    node     6d    v1.14.8   10.10.28.186   <none>        Debian GNU/Linux 9 (stretch)   4.9.0-9-amd64    docker://18.6.3
ip-10-10-29-142.us-east-2.compute.internal   Ready    master   6d    v1.14.8   10.10.29.142   <none>        Debian GNU/Linux 9 (stretch)   4.9.0-9-amd64    docker://18.6.3
ip-10-10-29-252.us-east-2.compute.internal   Ready    node     6d    v1.14.8   10.10.29.252   <none>        Debian GNU/Linux 9 (stretch)   4.9.0-9-amd64    docker://18.6.3
ip-10-10-30-118.us-east-2.compute.internal   Ready    master   6d    v1.14.8   10.10.30.118   <none>        Debian GNU/Linux 9 (stretch)   4.9.0-9-amd64    docker://18.6.3
ip-10-10-30-161.us-east-2.compute.internal   Ready    node     6d    v1.14.8   10.10.30.161   <none>        Debian GNU/Linux 9 (stretch)   4.9.0-9-amd64    docker://18.6.3
ip-10-10-30-206.us-east-2.compute.internal   Ready    node     6d    v1.14.8   10.10.30.206   <none>        Debian GNU/Linux 9 (stretch)   4.9.0-9-amd64    docker://18.6.3
If we tail the logs for one of the pods we can clearly see that it connected to Elasticsearch and has started harvester for the files. The snippet below shows this:
2019-11-19T06:22:03.435Z	INFO	log/input.go:138	Configured paths: [/var/lib/docker/containers/c2b29f5e06eb8affb2cce7cf2501f6f824a2fd83418d09823faf4e74a5a51eb7/*.log]
2019-11-19T06:22:03.435Z	INFO	input/input.go:114	Starting input of type: docker; ID: 4134444498769889169
2019-11-19T06:22:04.786Z	INFO	input/input.go:149	input ticker stopped
2019-11-19T06:22:04.786Z	INFO	input/input.go:167	Stopping Input: 4134444498769889169
2019-11-19T06:22:19.295Z	INFO	[monitoring]	log/log.go:144	Non-zero metrics in the last 30s	{"monitoring": {"metrics": {"beat":{"cpu":{"system":{"ticks":641680,"time":{"ms":16}},"total":{"ticks":2471920,"time":{"ms":180},"value":2471920},"user":{"ticks":1830240,"time":{"ms":164}}},"handles":{"limit":{"hard":1048576,"soft":1048576},"open":20},"info":{"ephemeral_id":"007e8090-7c62-4b44-97fb-e74e8177dc54","uptime":{"ms":549390018}},"memstats":{"gc_next":47281968,"memory_alloc":29021760,"memory_total":156062982472}},"filebeat":{"events":{"added":111,"done":111},"harvester":{"closed":2,"open_files":15,"running":13}},"libbeat":{"config":{"module":{"running":0}},"output":{"events":{"acked":108,"batches":15,"total":108},"read":{"bytes":69},"write":{"bytes":123536}},"pipeline":{"clients":1847,"events":{"active":0,"filtered":3,"published":108,"total":111},"queue":{"acked":108}}},"registrar":{"states":{"current":87,"update":111},"writes":{"success":18,"total":18}},"system":{"load":{"1":0.98,"15":1.71,"5":1.59,"norm":{"1":0.0613,"15":0.1069,"5":0.0994}}}}}}

2019-11-19T06:22:49.295Z	INFO	[monitoring]	log/log.go:144	Non-zero metrics in the last 30s	{"monitoring": {"metrics": {"beat":{"cpu":{"system":{"ticks":641720,"time":{"ms":44}},"total":{"ticks":2472030,"time":{"ms":116},"value":2472030},"user":{"ticks":1830310,"time":{"ms":72}}},"handles":{"limit":{"hard":1048576,"soft":1048576},"open":20},"info":{"ephemeral_id":"007e8090-7c62-4b44-97fb-e74e8177dc54","uptime":{"ms":549420018}},"memstats":{"gc_next":47281968,"memory_alloc":38715472,"memory_total":156072676184}},"filebeat":{"events":{"active":12,"added":218,"done":206},"harvester":{"open_files":15,"running":13}},"libbeat":{"config":{"module":{"running":0}},"output":{"events":{"acked":206,"batches":24,"total":206},"read":{"bytes":102},"write":{"bytes":269666}},"pipeline":{"clients":1847,"events":{"active":12,"published":218,"total":218},"queue":{"acked":206}}},"registrar":{"states":{"current":87,"update":206},"writes":{"success":24,"total":24}},"system":{"load":{"1":1.22,"15":1.7,"5":1.58,"norm":{"1":0.0763,"15":0.1063,"5":0.0988}}}}}}

2019-11-19T06:23:19.295Z	INFO	[monitoring]	log/log.go:144	Non-zero metrics in the last 30s	{"monitoring": {"metrics": {"beat":{"cpu":{"system":{"ticks":641750,"time":{"ms":28}},"total":{"ticks":2472110,"time":{"ms":72},"value":2472110},"user":{"ticks":1830360,"time":{"ms":44}}},"handles":{"limit":{"hard":1048576,"soft":1048576},"open":20},"info":{"ephemeral_id":"007e8090-7c62-4b44-97fb-e74e8177dc54","uptime":{"ms":549450017}},"memstats":{"gc_next":47281968,"memory_alloc":43140256,"memory_total":156077100968}},"filebeat":{"events":{"active":-12,"added":43,"done":55},"harvester":{"open_files":15,"running":13}},"libbeat":{"config":{"module":{"running":0}},"output":{"events":{"acked":55,"batches":12,"total":55},"read":{"bytes":51},"write":{"bytes":70798}},"pipeline":{"clients":1847,"events":{"active":0,"published":43,"total":43},"queue":{"acked":55}}},"registrar":{"states":{"current":87,"update":55},"writes":{"success":12,"total":12}},"system":{"load":{"1":0.99,"15":1.67,"5":1.49,"norm":{"1":0.0619,"15":0.1044,"5":0.0931}}}}}}

2019-11-19T06:23:25.261Z	INFO	log/harvester.go:255	Harvester started for file: /var/lib/docker/containers/ccb7dc75ecc755734f6befc4965b9fdae74d59810914101eadf63daa69eb62e2/ccb7dc75ecc755734f6befc4965b9fdae74d59810914101eadf63daa69eb62e2-json.log

2019-11-19T06:23:49.295Z	INFO	[monitoring]	log/log.go:144	Non-zero metrics in the last 30s	{"monitoring": {"metrics": {"beat":{"cpu":{"system":{"ticks":641780,"time":{"ms":28}},"total":{"ticks":2472310,"time":{"ms":196},"value":2472310},"user":{"ticks":1830530,"time":{"ms":168}}},"handles":{"limit":{"hard":1048576,"soft":1048576},"open":21},"info":{"ephemeral_id":"007e8090-7c62-4b44-97fb-e74e8177dc54","uptime":{"ms":549480018}},"memstats":{"gc_next":47789200,"memory_alloc":31372376,"memory_total":156086697176,"rss":-1064960}},"filebeat":{"events":{"active":16,"added":170,"done":154},"harvester":{"open_files":16,"running":14,"started":1}},"libbeat":{"config":{"module":{"running":0}},"output":{"events":{"acked":153,"batches":24,"total":153},"read":{"bytes":115},"write":{"bytes":207569}},"pipeline":{"clients":1847,"events":{"active":16,"filtered":1,"published":169,"total":170},"queue":{"acked":153}}},"registrar":{"states":{"current":87,"update":154},"writes":{"success":25,"total":25}},"system":{"load":{"1":0.87,"15":1.63,"5":1.41,"norm":{"1":0.0544,"15":0.1019,"5":0.0881}}}}}}
Once we have all our pods running, then we can create an index pattern of the type filebeat-* in Kibana. Filebeat indexes are generally timestamped. As soon as we create the index pattern all the searchable available fields can be seen and should be imported. Lastly, we can search through our application logs and create dashboards if needed. It is highly recommended to use JSON logger in our applications because it makes log processing extremely easy and messages can be parsed easily.

 浙公网安备 33010602011771号