机器学习-KNN-ListedColormap绘制
1.了解KDTree:KDTree的思想、划分、实现
2.K近邻(KNN):scikit-learn 中KNN相关的类库概述
原理很简单:K近邻法(KNN)原理小结
取数据集中最近的k个点,然后投票,k个点中标记的众数作为查询点的标记类型。
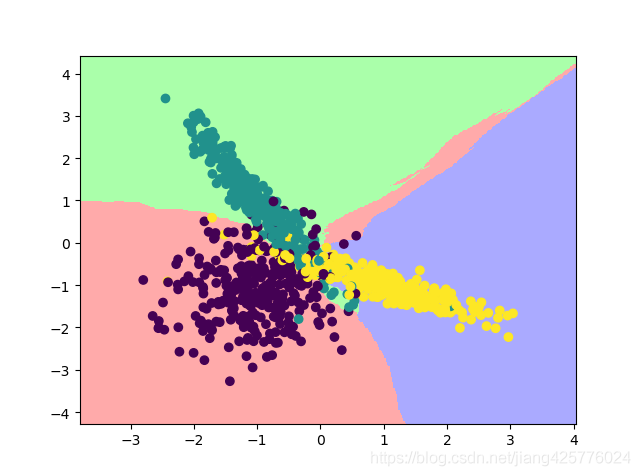
绘制区域图:
import numpy as np
import matplotlib.pyplot as plt
from sklearn import neighbors
from sklearn.datasets.samples_generator import make_classification
from matplotlib.colors import ListedColormap

cmap_light = ListedColormap(['#FFAAAA', '#AAFFAA', '#AAAAFF'])
cmap_bold = ListedColormap(['#FF0000', '#00FF00', '#0000FF'])

# X为样本特征,Y为样本类别输出, 共1000个样本,每个样本2个特征,输出有3个类别,没有冗余特征,每个类别一个簇
X, Y = make_classification(n_samples=1000, n_features=2, n_redundant=0,
                           n_clusters_per_class=1, n_classes=3)

clf = neighbors.KNeighborsClassifier(n_neighbors=15, weights='distance')
clf.fit(X, Y)

# 确认训练集的边界
x_min, x_max = X[:, 0].min() - 1, X[:, 0].max() + 1
y_min, y_max = X[:, 1].min() - 1, X[:, 1].max() + 1

# 生成随机数据来做测试集,然后作预测
xx, yy = np.meshgrid(np.arange(x_min, x_max, 0.02),
                     np.arange(y_min, y_max, 0.02))

# 连接xx,yy。.ravel扁平化
d = np.c_[xx.ravel(), yy.ravel()]
Z = clf.predict(d)

# 画出测试集数据,扁平化后形状变了
Z = Z.reshape(xx.shape)

plt.figure()

# 接收网格化的x,y,z
#https://matplotlib.org/gallery/images_contours_and_fields/pcolormesh_levels.html
plt.pcolormesh(xx, yy, Z, cmap=cmap_light)

plt.xlim(xx.min(), xx.max())
plt.ylim(yy.min(), yy.max())

plt.scatter(X[:, 0], X[:, 1], marker='o', c=Y)
plt.show()

 浙公网安备 33010602011771号