
Perfetto 快速入门:在 Android 上记录跟踪
官网介绍:https://perfetto.dev/docs/quickstart/android-tracing 360 极速浏览器X 翻译网页
https://perfetto.dev/docs/reference/trace-config-proto TraceConfig 配置各个属性介绍
https://perfetto.dev/docs/reference/trace-packet-proto TraceConfig 配置各个属性介绍
https://perfetto.dev/docs/reference/perfetto-cli 命令行抓trace介绍
https://perfetto.dev/docs/case-studies/android-boot-tracing 抓开机trace
https://perfetto.dev/docs/data-sources/frametimeline Expected Timeline 和 Actual Timeline
http://xrefandroid.com/android-14.0.0_r21/xref/external/perfetto/docs/data-sources/ 数据源 配置参考
http://xrefandroid.com/android-14.0.0_r21/xref/frameworks/native/libs/gui/include/gui/JankInfo.h 卡顿原因,Actual Timeline轴下方 Jank type 的值
快速判断属于应用卡顿还是SF卡顿
https://perfetto.dev/docs/data-sources/frametimeline Expected Timeline 和 Actual Timeline
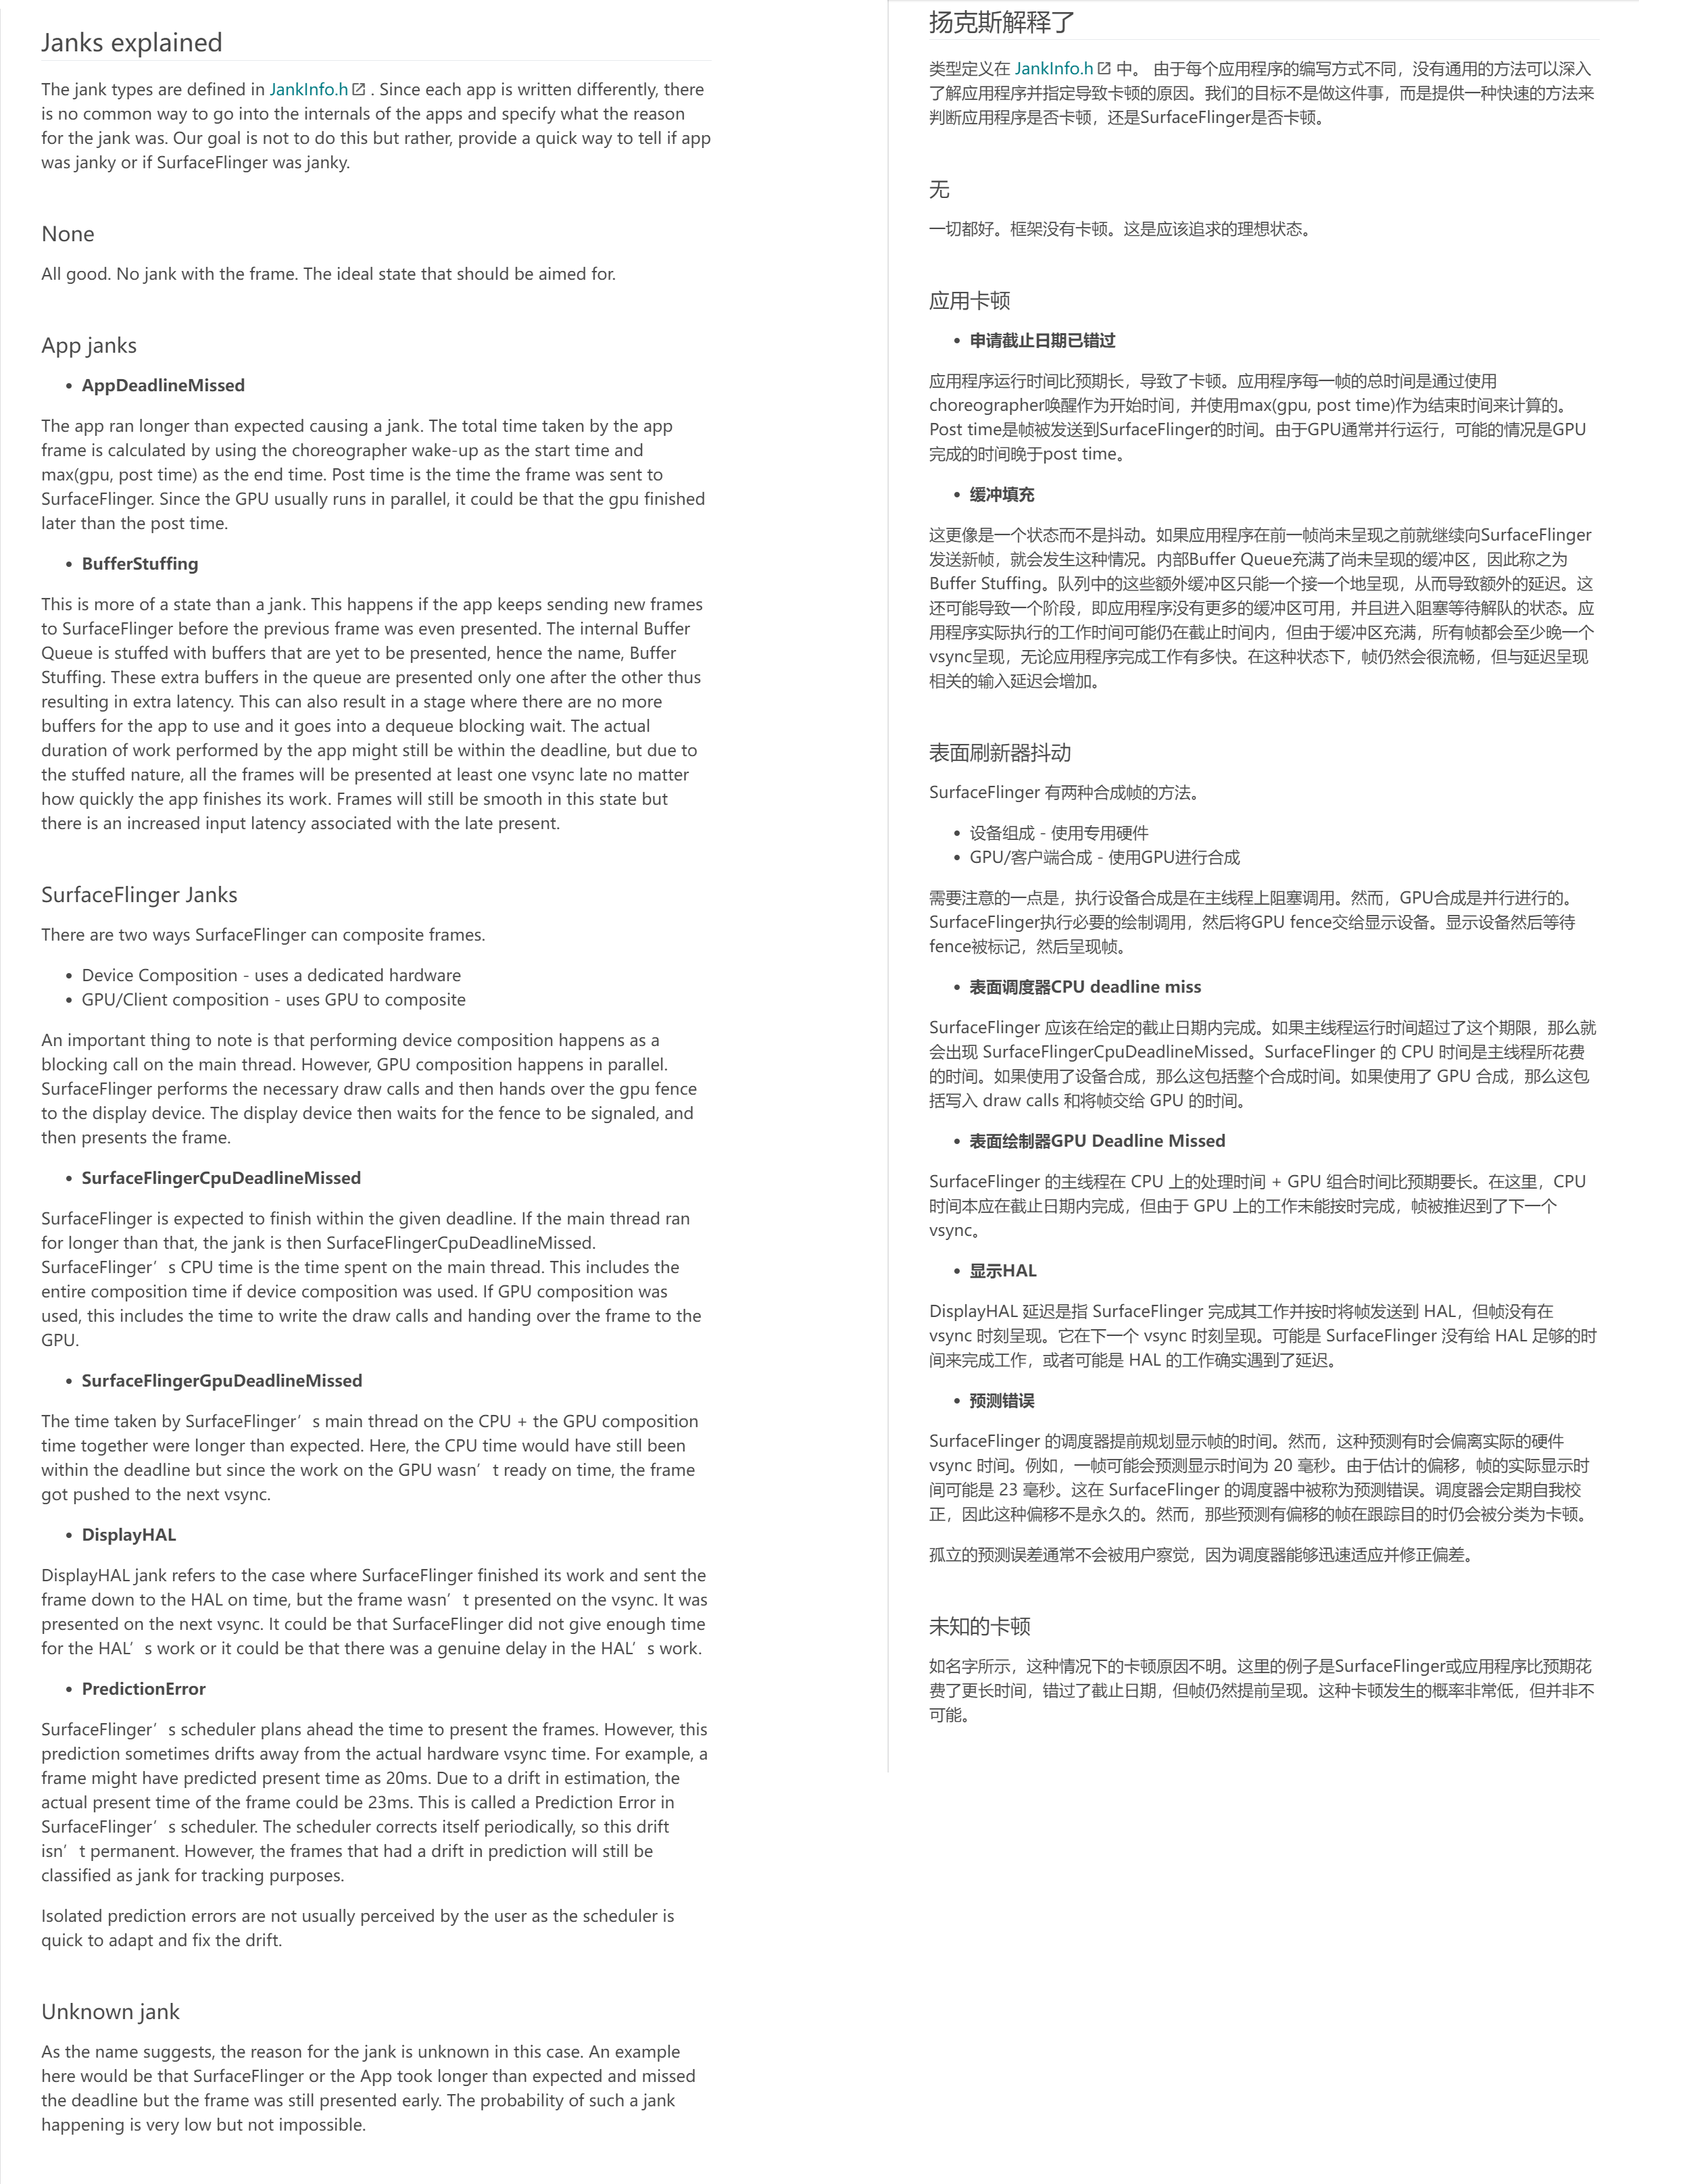
http://xrefandroid.com/android-14.0.0_r21/xref/frameworks/native/libs/gui/include/gui/JankInfo.h 卡顿类型
JankInfo.h 文件:
#pragma once
namespace android {
// Jank information tracked by SurfaceFlinger(SF) for perfetto tracing and telemetry.
enum JankType {
// No Jank
None = 0x0,
// Jank that occurs in the layers below SurfaceFlinger
DisplayHAL = 0x1,
// SF took too long on the CPU; deadline missed during HWC
SurfaceFlingerCpuDeadlineMissed = 0x2,
// SF took too long on the GPU; deadline missed during GPU composition
SurfaceFlingerGpuDeadlineMissed = 0x4,
// Either App or GPU took too long on the frame
AppDeadlineMissed = 0x8,
// Vsync predictions have drifted beyond the threshold from the actual HWVsync
PredictionError = 0x10,
// Janks caused due to the time SF was scheduled to work on the frame
// Example: SF woke up too early and latched a buffer resulting in an early present
SurfaceFlingerScheduling = 0x20,
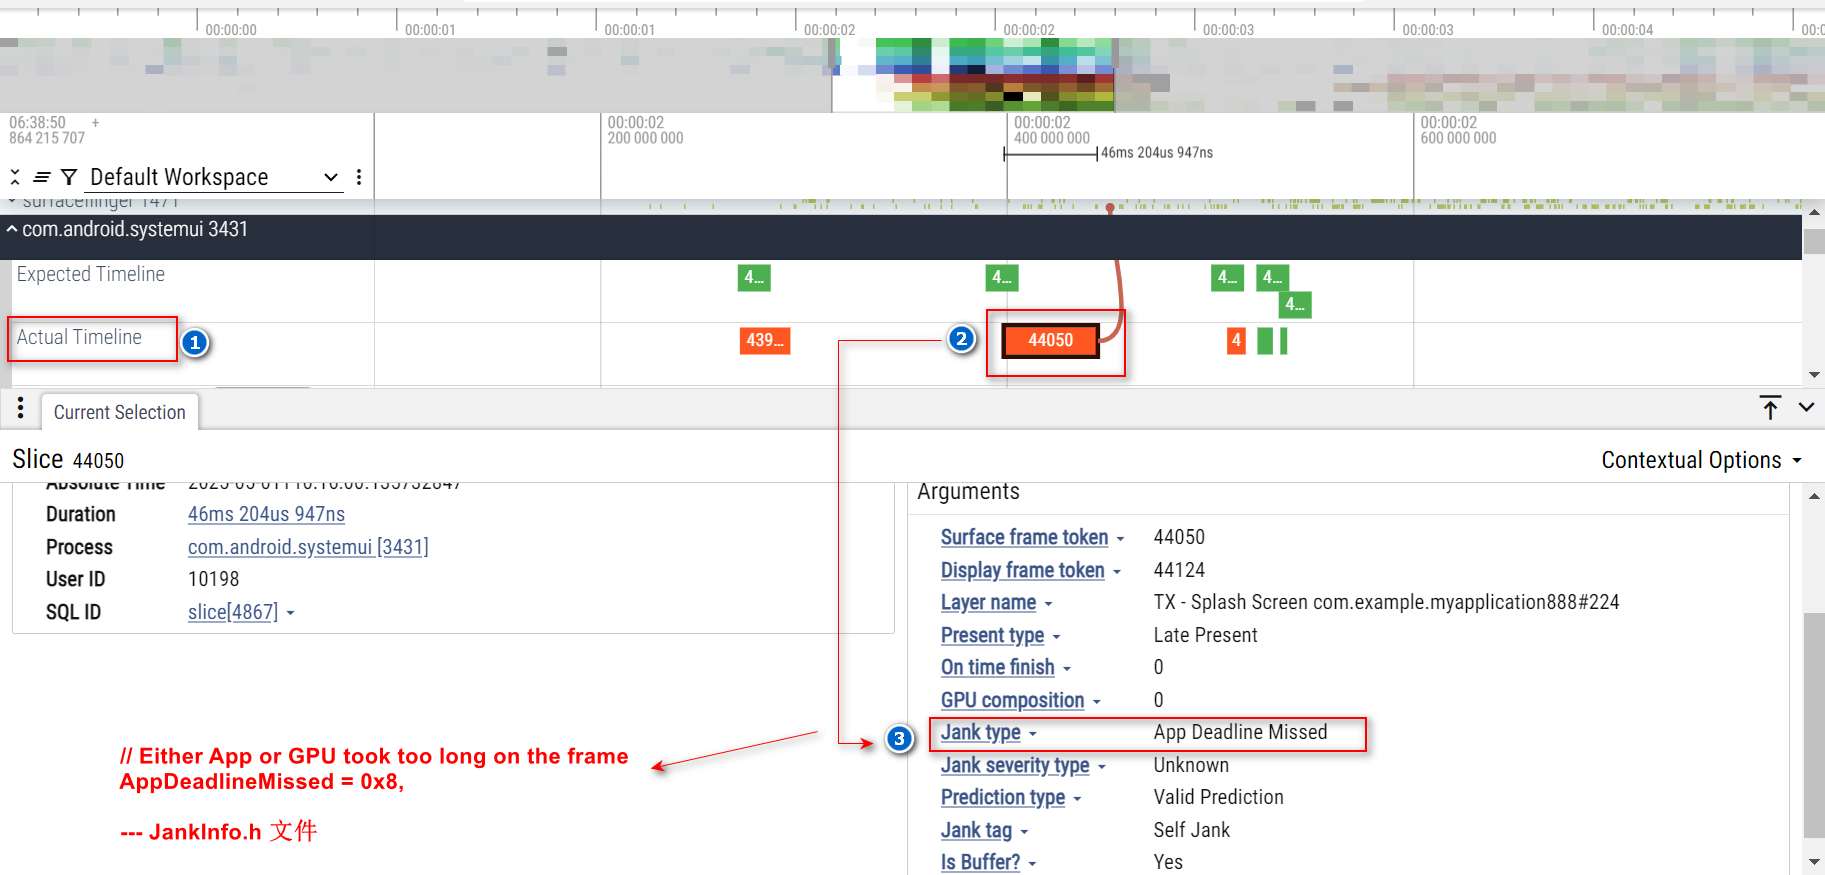
// A buffer is said to be stuffed if it was expected to be presented on a vsync but was
// presented later because the previous buffer was presented in its expected vsync. This
// usually happens if there is an unexpectedly long frame causing the rest of the buffers
// to enter a stuffed state.
BufferStuffing = 0x40,
// Jank due to unknown reasons.
Unknown = 0x80,
// SF is said to be stuffed if the previous frame ran longer than expected resulting in the case
// where the previous frame was presented in the current frame's expected vsync. This pushes the
// current frame to the next vsync. The behavior is similar to BufferStuffing.
SurfaceFlingerStuffing = 0x100,
};
} // namespace android# 卡顿原因,Actual Timeline轴下方 Jank type 的值
# 卡顿原因,Actual Timeline轴下方 Jank tag 的值
颜色条:
const BLUE_COLOR = '#03A9F4';         // Blue 500
const GREEN_COLOR = '#4CAF50';        // Green 500
const YELLOW_COLOR = '#FFEB3B';       // Yellow 500
const RED_COLOR = '#FF5722';          // Red 500
const LIGHT_GREEN_COLOR = '#C0D588';  // Light Green 500
const PINK_COLOR = '#F515E0';         // Pink 500
颜色条 对应 Jank tag 信息:

示例:绿色
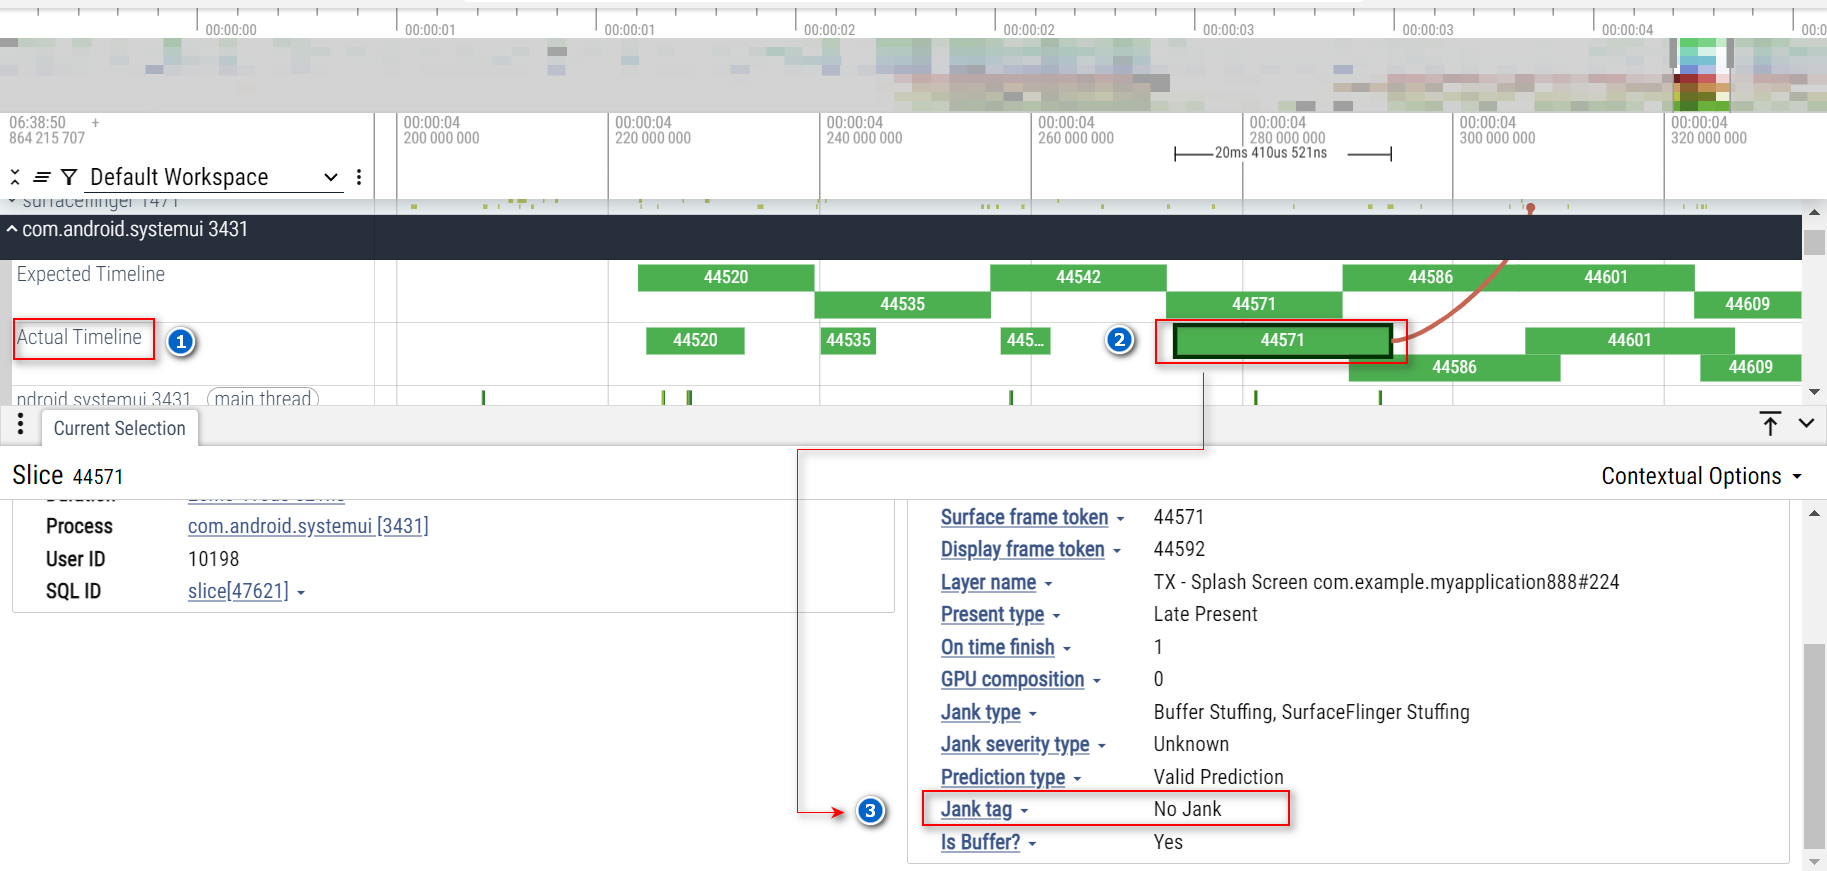
示例: Actual Timeline轴下方 Jank type 和 Jank tag 的值,显示出 应用自身线程 卡顿
常用数据源
Expected Timeline 和 Actual Timeline 数据源
data_sources: {
    config {
        name: "android.surfaceflinger.frametimeline"
    }
}
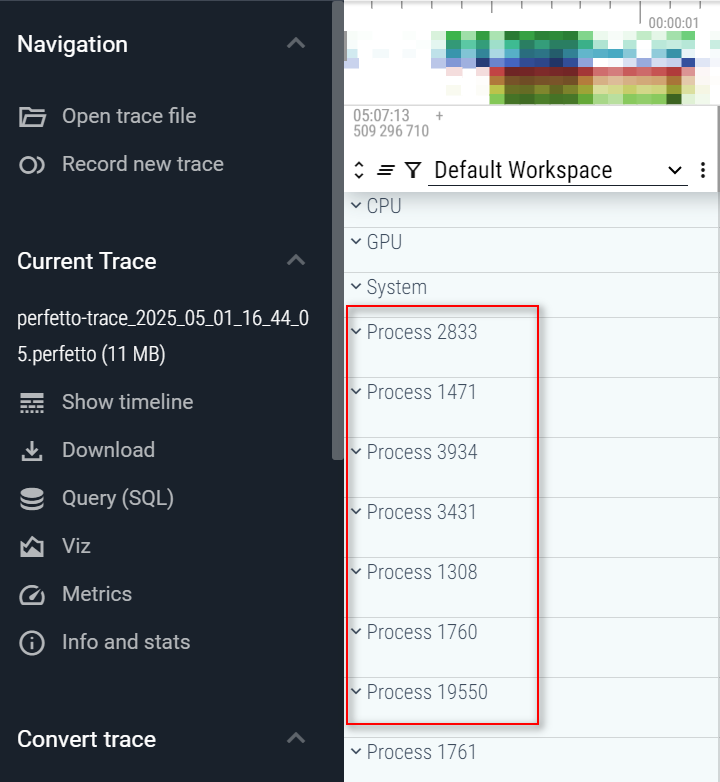
让 线程名称 正常显示
 data_sources: {
     config {
         name: "linux.process_stats"
         target_buffer: 1
         process_stats_config {
             scan_all_processes_on_start: true
             proc_stats_poll_ms: 1000
         }
     }
 }
若不配置上述一段,线程名称 大多是 Process 关键字,如下,不能正常显示线程名称
#
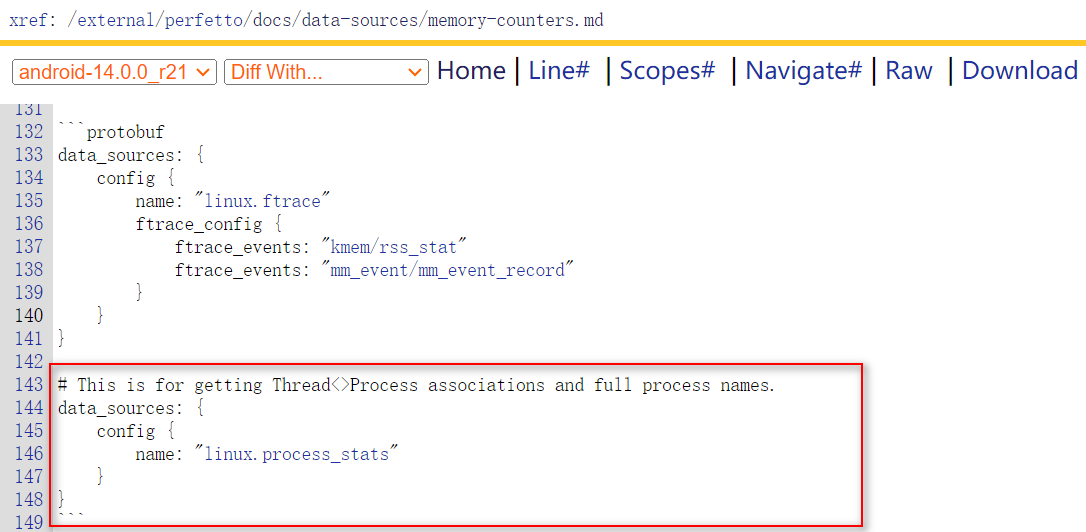
# This is for getting Thread<>Process associations and full process names.
data_sources: {
    config {
        name: "linux.process_stats"
    }
}
#

data_sources: {
    config {
        name: "linux.process_stats"
        process_stats_config {
            scan_all_processes_on_start: true
            proc_stats_poll_ms: 1000
        }
    }
}
Android log
data_sources: {
    config {
        name: "android.log"
        android_log_config {
            min_prio: PRIO_VERBOSE
            filter_tags: "perfetto"
            filter_tags: "my_tag_2"
            log_ids: LID_DEFAULT
            log_ids: LID_RADIO
            log_ids: LID_EVENTS
            log_ids: LID_SYSTEM
            log_ids: LID_CRASH
            log_ids: LID_KERNEL
        }
    }
}
record_android_trace 脚本
https://raw.githubusercontent.com/google/perfetto/main/tools/record_android_trace
或
http://xrefandroid.com/android-14.0.0_r21/xref/external/perfetto/tools/record_android_trace
快速入门:在 Android 上记录跟踪
Perfetto 允许您从各种数据源收集来自 Android 设备的系统级性能跟踪(通过 ftrace 的内核调度器,通过 atrace 的用户空间仪器化,以及本网站中列出的所有其他数据源)。
启动跟踪服务
Perfetto 基于 平台服务 这些服务自 Android 9 (P) 起可用,但仅自 Android 11 (R) 起默认启用。 在 Android 9 (P) 和 10 (Q) 上,您需要执行以下操作以确保在开始之前跟踪服务已启用:
# Needed only on Android 9 (P) and 10 (Q) on non-Pixel phones.
adb shell setprop persist.traced.enable 1
如果你运行的安卓版本早于P,你仍然可以使用record_android_trace脚本来捕获一个 Perfetto 跟踪记录。请参阅下面的 通过 cmdline 录制跟踪记录 部分中的说明。
记录跟踪
命令行工具(以下页面中提供使用示例):
- 使用
tools/record_android_trace辅助脚本。 - 直接使用
/system/bin/perfetto命令在设备[参考].
用户界面工具:
- 通过 Perfetto UI 的记录页面.
- 使用设备上的系统跟踪应用
通过 Perfetto UI 记录跟踪
导航到 ui.perfetto.dev 并从左侧菜单中选择 记录新的跟踪。 从此页面,选择并打开您希望包含在跟踪中的数据源。有关不同数据源的更多详细信息,请参阅 数据源 部分的文档。
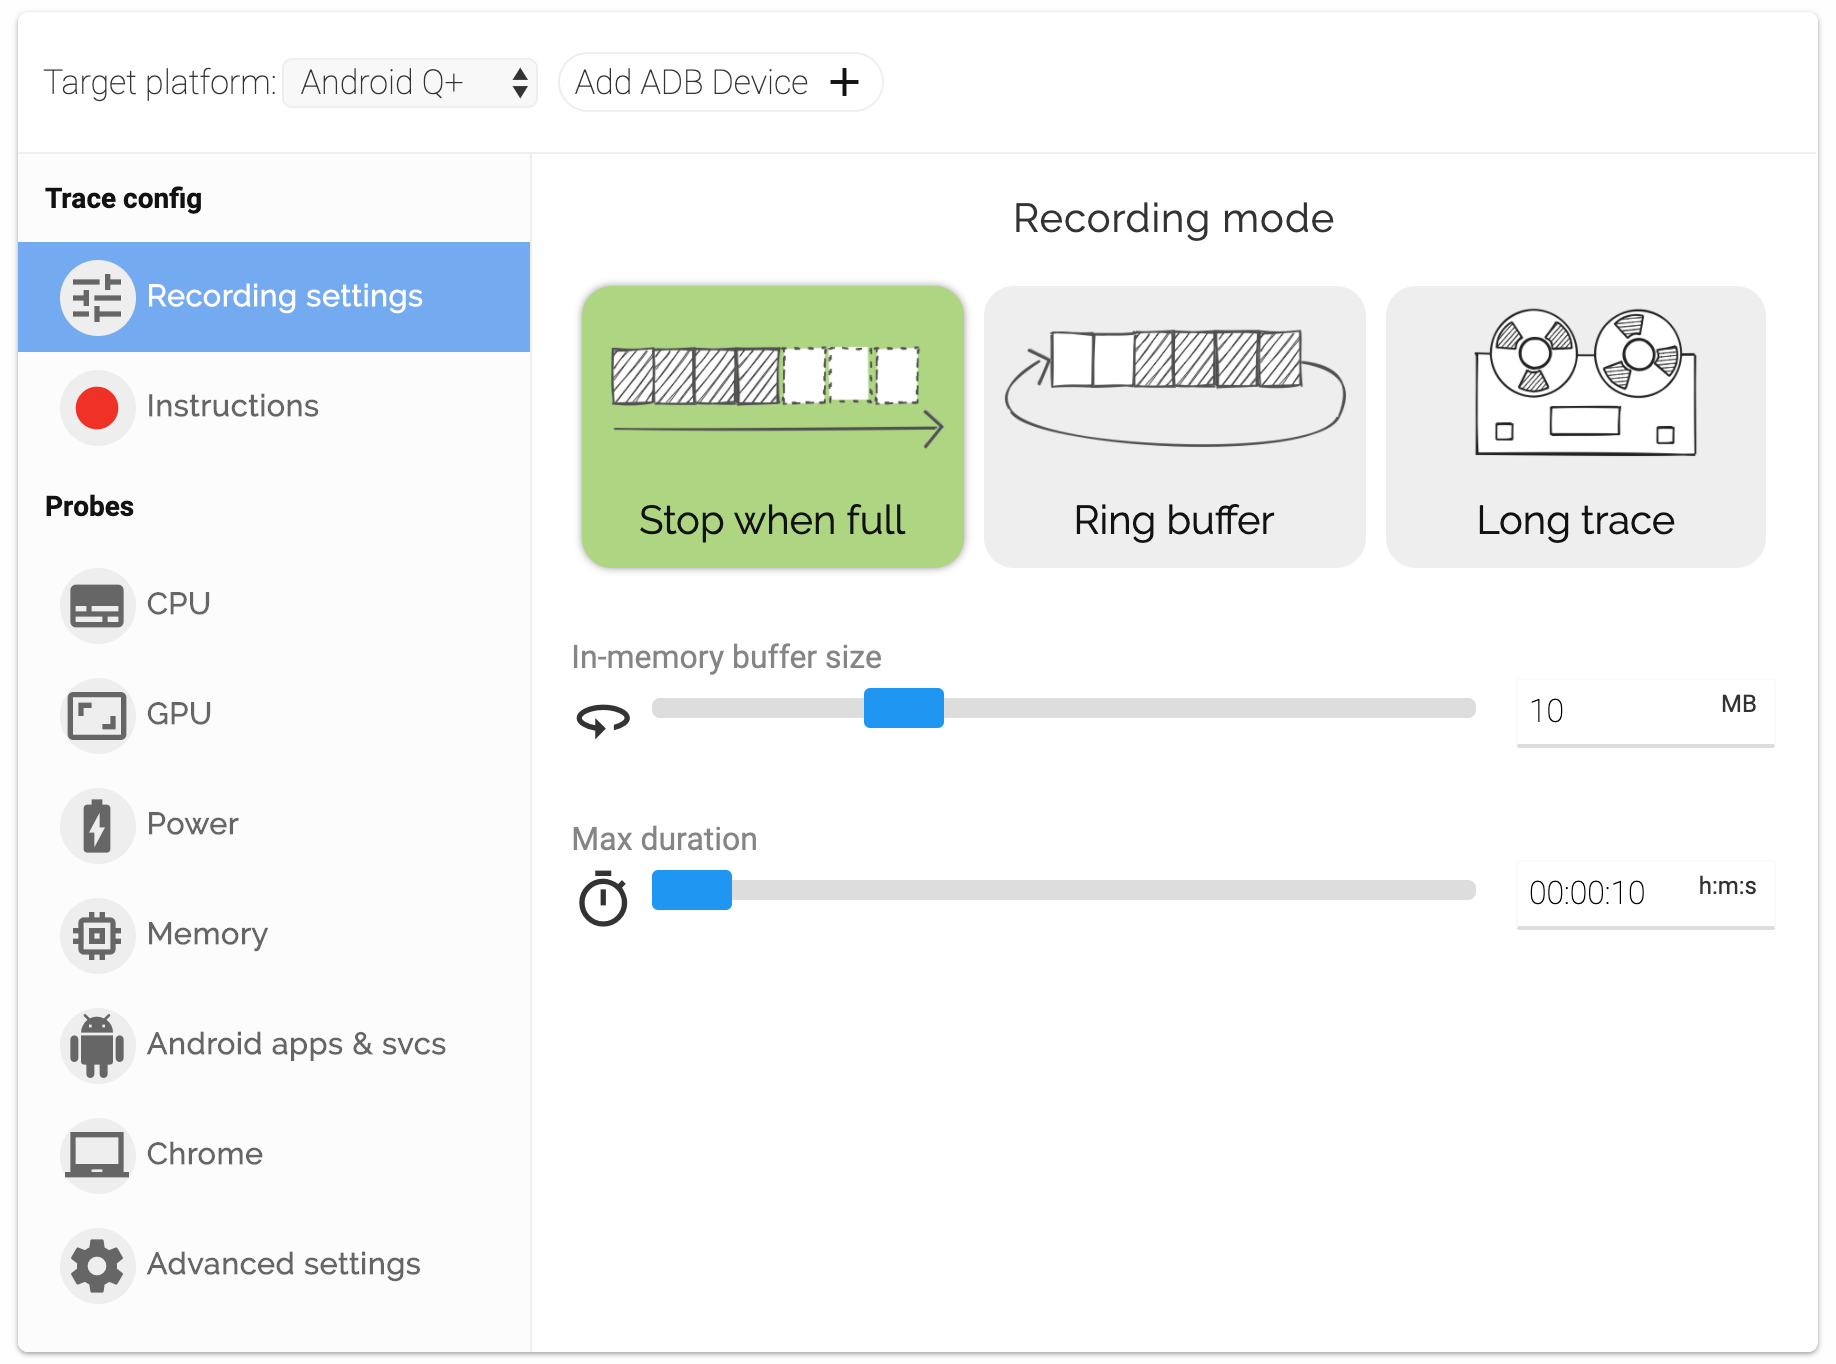
如果你不确定,先打开调度详细信息选项卡下的CPU。
确保您的设备已连接并选择添加 ADB 设备。一旦您的设备成功配对(您可能需要在设备上允许 USB 调试),选择开始录制按钮。
允许时间收集跟踪信息(默认为10秒),然后您应该会看到跟踪信息出现。
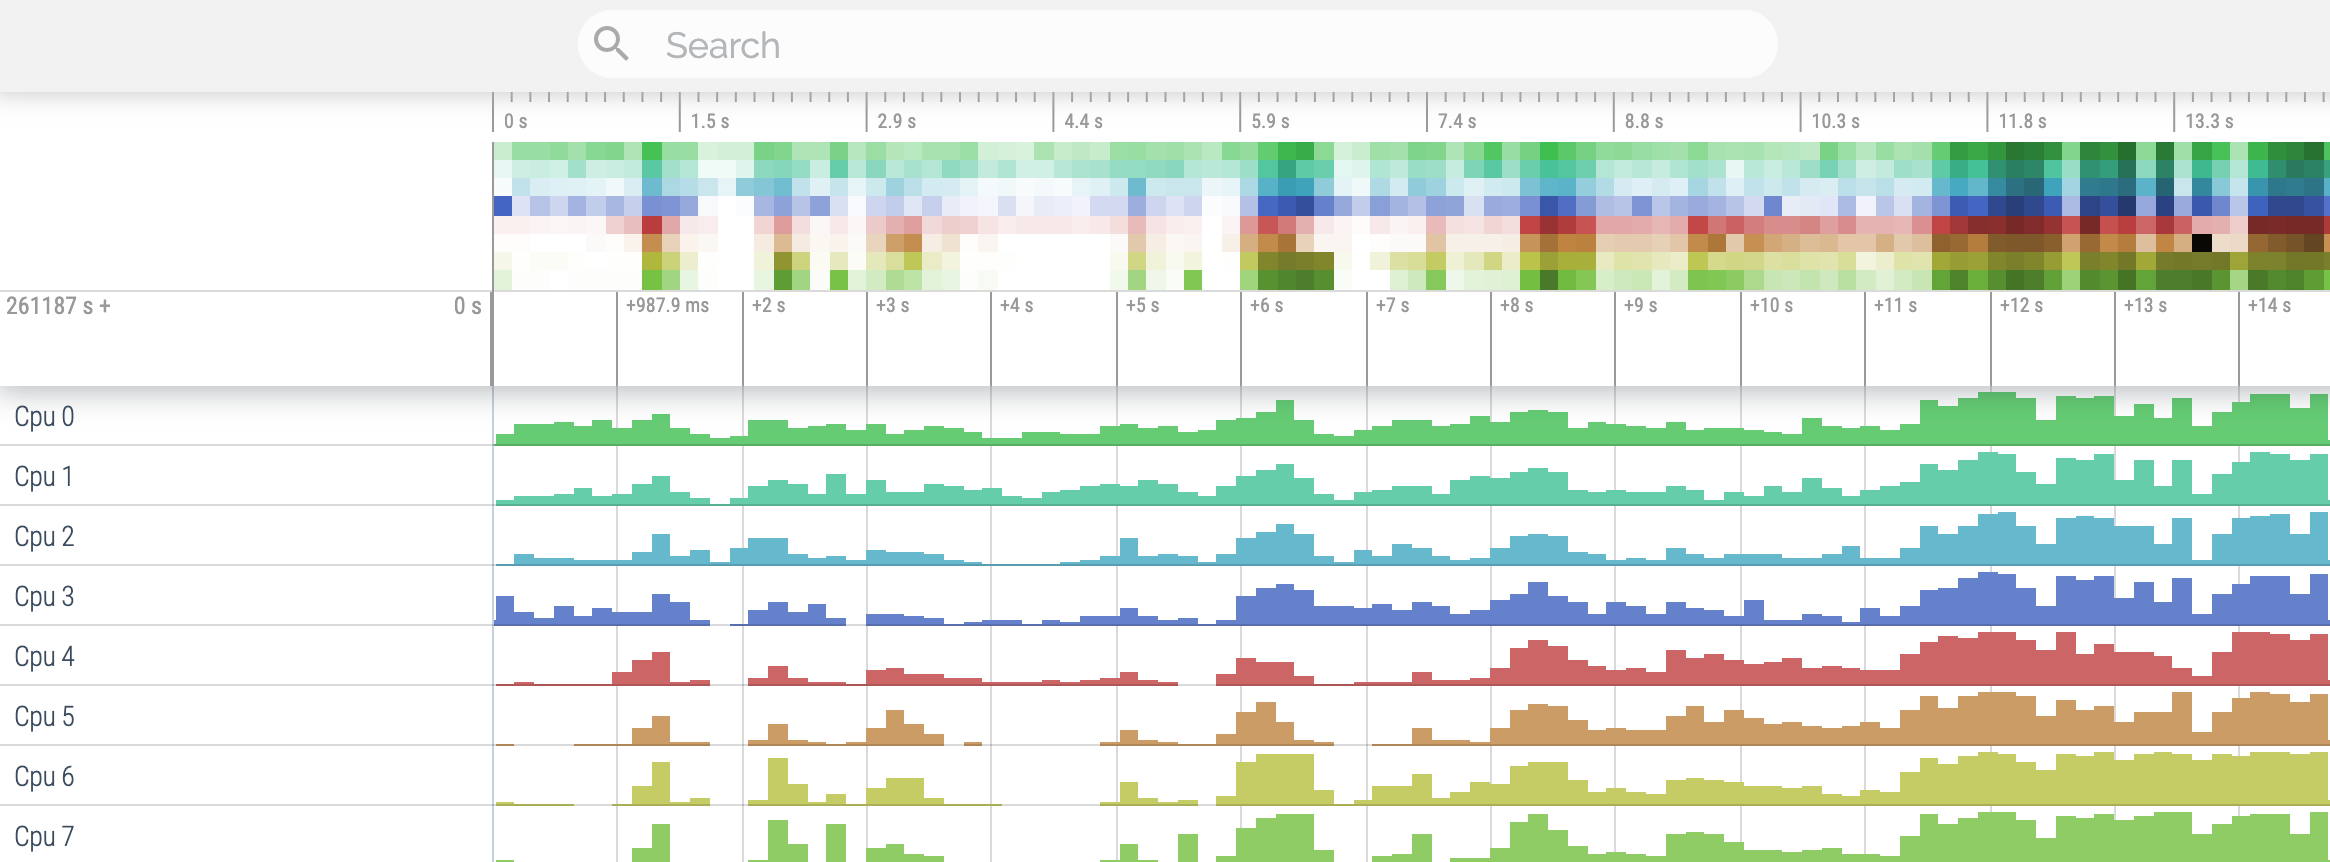
您的跟踪可能因您启用的数据源不同而有所不同。
通过 cmdline 记录跟踪
先决条件
对于基于命令行的工作流程,您需要将adb(安卓调试桥)可执行文件放在您的 PATH 中。适用于 Linux、Mac 或 Windows 的 ADB 二进制文件可以从https://developer.android.com/studio/releases/platform-tools下载。
或
https://dl.google.com/android/repository/platform-tools-latest-windows.zip 选择这个下载
使用助手脚本
我们建议使用tools/record_android_trace脚本来从命令行记录跟踪。这相当于运行adb shell perfetto,但它有助于确保路径正确,在完成后自动拉取跟踪并在浏览器中打开。 tracebox此外,在较早版本的Android上,它负责侧载二进制文件,以弥补缺乏跟踪系统服务的情况。
如果你已经熟悉 systrace 或 atrace,这两个命令行工具都支持类似systrace的语法:
在 Linux 和 Mac 上:
curl -O https://raw.githubusercontent.com/google/perfetto/main/tools/record_android_trace
chmod u+x record_android_trace

# See ./record_android_trace --help for more
./record_android_trace -o trace_file.perfetto-trace -t 30s -b 64mb sched freq idle am wm gfx view binder_driver hal dalvik camera input res memory
在 Windows 上:
curl -O https://raw.githubusercontent.com/google/perfetto/main/tools/record_android_trace
python3 record_android_trace -o trace_file.perfetto-trace -t 30s -b 64mb sched freq idle am wm gfx view binder_driver hal dalvik camera input res memory
使用设备上的 /system/bin/perfetto 命令
或者,如果您想直接使用设备上的二进制文件,请执行以下操作:
adb shell perfetto -o /data/misc/perfetto-traces/trace_file.perfetto-trace -t 20s sched freq idle am wm gfx view binder_driver hal dalvik camera input res memory
直接使用adb shell perfetto工作流程时的注意事项:
- Ctrl+C,通常会导致跟踪优雅地终止,但在使用
adb shell perfetto时不会被传播,仅在通过adb shell使用交互式 PTY 基的会话时才会被传播。 - 在 Android 12 之前的非根设备上,由于 SELinux 规则过于严格,配置只能以
cat config | adb shell perfetto -c -(-: stdin) 作为输入传递。/data/misc/perfetto-configs自从 Android 12 起,可以用于 存储配置。 - 在低于 Android 10 的设备上,adb 无法直接拉取
/data/misc/perfetto-traces。使用adb shell cat /data/misc/perfetto-traces/trace > trace来解决。 - 在捕获更长的跟踪时,例如在基准测试或CI上下文中,使用
PID=$(perfetto --background)并然后kill $PID停止。
完整跟踪配置
简短的语法允许启用数据源的子集;若要完全控制跟踪配置,请在输入中传递完整的跟踪配置。
请参阅跟踪配置页面以及每个数据源文档页面中的示例,以获取有关如何配置Perfetto的各种开关的详细说明。
如果您在 Mac 或 Linux 主机上运行,或者在 Windows 上使用基于 bash 的终端,您可以使用以下内容:
警告:以下命令在 Android P 上无法使用,因为--txt 选项在 Q 中引入。应使用二进制 protobuf 格式;有关详细信息,请参阅 跟踪配置 页面。
cat<<EOF>config.pbtx
duration_ms: 10000

buffers: {
    size_kb: 8960
    fill_policy: DISCARD
}
buffers: {
    size_kb: 1280
    fill_policy: DISCARD
}
data_sources: {
    config {
        name: "linux.ftrace"
        ftrace_config {
            ftrace_events: "sched/sched_switch"
            ftrace_events: "power/suspend_resume"
            ftrace_events: "sched/sched_process_exit"
            ftrace_events: "sched/sched_process_free"
            ftrace_events: "task/task_newtask"
            ftrace_events: "task/task_rename"
            ftrace_events: "ftrace/print"
            atrace_categories: "gfx"
            atrace_categories: "view"
            atrace_categories: "webview"
            atrace_categories: "camera"
            atrace_categories: "dalvik"
            atrace_categories: "power"
        }
    }
}
data_sources: {
    config {
        name: "linux.process_stats"
        target_buffer: 1
        process_stats_config {
            scan_all_processes_on_start: true
        }
    }
}
EOF

./record_android_trace -c config.pbtx -o trace_file.perfetto-trace
或者,当直接使用设备命令时:
cat config.pbtx | adb shell perfetto -c - --txt -o /data/misc/perfetto-traces/trace.perfetto-trace
或者,首先推送跟踪配置文件,然后调用 perfetto:
adb push config.pbtx /data/local/tmp/config.pbtx
adb shell 'cat /data/local/tmp/config.pbtx | perfetto --txt -c - -o /data/misc/perfetto-traces/trace.perfetto-trace'
注意:由于严格的SELinux规则,在非根权限的Android构建中,直接传递文件路径-c /data/local/tmp/config将失败,因此需要 -c - + stdin管道。从Android 12 (S)开始,/data/misc/perfetto-configs/ 可以使用。
使用 adb pull /data/misc/perfetto-traces/trace ~/trace.perfetto-trace 拉取文件,并在 Perfetto UI中打开。
注意:在低于Android 10的设备上,adb无法直接拉取 /data/misc/perfetto-traces。使用 adb shell cat /data/misc/perfetto-traces/trace > trace.perfetto-trace 来绕过。
完整的 cmdline 接口参考可以在 perfetto这里找到 。
抓取开机时的Trace
https://perfetto.dev/docs/case-studies/android-boot-tracing 抓开机trace
1. 新建 config.pbtxt 文件,内容如下:
# One buffer allocated within the central tracing binary for the entire trace,
# shared by the two data sources below.
buffers {
  size_kb: 32768
  fill_policy: DISCARD
}

# Ftrace data from the kernel, mainly the process scheduling events.
data_sources {
  config {
    name: "linux.ftrace"
    target_buffer: 0
    ftrace_config {
      ftrace_events: "sched_switch"
      ftrace_events: "sched_waking"
      ftrace_events: "sched_wakeup_new"

      ftrace_events: "task_newtask"
      ftrace_events: "task_rename"

      ftrace_events: "sched_process_exec"
      ftrace_events: "sched_process_exit"
      ftrace_events: "sched_process_fork"
      ftrace_events: "sched_process_free"
      ftrace_events: "sched_process_hang"
      ftrace_events: "sched_process_wait"
    }
  }
}

# Resolve process commandlines and parent/child relationships, to better
# interpret the ftrace events, which are in terms of pids.
data_sources {
  config {
    name: "linux.process_stats"
    target_buffer: 0
  }
}

# 10s trace, but can be stopped prematurely via `adb shell pkill -u perfetto`.
duration_ms: 10000
2. 依次执行如下命令
$ adb push config.pbtxt /data/misc/perfetto-configs/boottrace.pbtxt // 将 config.pbtxt 文件push到手机中
config.pbtxt: 1 file pushed, 0 skipped. 0.8 MB/s (1138 bytes in 0.001s)
$ adb shell setprop persist.debug.perfetto.boottrace 1
$ adb reboot // 重启手机
$ adb pull /data/misc/perfetto-traces/boottrace.perfetto-trace // 导出trace文件
/data/misc/perfetto-traces/boottrace.perfetto-trace: 1 file pulled, 0 skipped. 26.4 MB/s (12318829 bytes in 0.445s)
3. 使用perfetto打开trace即可

 浙公网安备 33010602011771号