小说网站类型阅读量
一、 选题的背景
在电子阅读的时代,青少年在网上都喜欢看些什么样的书籍?是都市言情?经典文学?惊悚恐怖?只有把握住青少年阅读的趋势,我们的写作者,才能对症下药,提高受众面,写出符合青少年需求,符合时代主旋律的小说,进一步引导青少年培养正确的价值观。通过这次数据分析,我们通过抓取某小说网站的各类小说的阅读量,各个小说的打赏量,分析出目前青少年喜欢看的小说类型,以及阅读量与打赏量的回归关系。
二、
1.爬虫名称: 某小说网站小说类型阅读量,打赏量爬虫。
2.爬取的内容:各小说类型的总阅读量,以及各个小说的阅读量与打赏量。数据特征:阅读量与打赏量都为数字,所在html元素格式相似,均可用re正则表达式提取。
3.思路:总得思路是,先爬虫,后数据分析。爬虫中,先使用requests打开小说网站的小说总库,顺着小说总库网页爬取小说的地址,进入小说介绍页面后提取小说的类型、阅读量、打赏量。 完成爬虫,拿到小说数据以后,进行简单的清洗,绘制相关的统计图,建立回归方程模型,判断小说阅读量与打赏量之间的潜在关系。难点:俗话说,假若你使用re进行数据提取,那么原本你有一个问题,现在有了两个问题,正确写出re的表达式是个难点,同样熟练使用matplotlib,sklearn也是一个难点。
三、
所选的小说网站比较简单,缺乏相应的反爬措施,具体过程。
 1 # -*- coding: UTF-8 -*-
 2 # !/usr/bin/env python3
 3 # Author:  ZhangQiancheng
 4
 5 import re
 6 import time
 7 import requests
 8 import numpy as np
 9 from time import sleep
10 from random import random
11 import matplotlib.pyplot as plt
12 from sklearn import linear_model
13
14
15 class Work(object):
16     def __init__(self):
17         self.novel_urls = []  # 初始化小说地址列表,
18
19         self.novel_type_data = {
20             "玄幻奇幻": 0,
21             "武侠小说": 0,
22             "同人小说": 0,
23             "都市言情": 0,
24             "军事历史": 0,
25             "科幻网游": 0,
26             "恐怖灵异": 0,
27             "青春校园": 0
28         }   # 初始化小说类型数据
29         self.novel_data = {}  # 初始化小说数据
30         plt.rcParams['font.sans-serif'] = ['SimHei']  # 设置matplotlib支持中文
31         self.headers = {"User-Agent": "Mozilla/5.0 (Windows NT 10.0; Win64; x64) AppleWebKit/537.36 (KHTML, like Gecko) Chrome/91.0.4472.114 Safari/537.36"}
32
33     def novel_url_spider(self):
34         """
35         在总库页面中,获取小说链接地址。
36         :return:
37         """
38         for page in range(1, 51):
39             index_url = f"https://b.faloo.com/y_0_0_0_0_0_0_{page}.html"
40             index_res = requests.get(index_url, headers=self.headers)
41             index_res.encoding = "gb2312"  # 网页内容编码转换, 下同。
42             novel_urls_temp = re.findall(r"//b.faloo.com/\d+?\.html", index_res.text)
43             self.novel_urls = list(set([f'https:{i}' for i in novel_urls_temp]))
44             sleep(random())  # 随机休眠, 反爬并减少对目标网站的访问压力。
45             break  # 测试使用,减少爬虫运行时间, 下同
46
47     def novel_data_spider(self):
48         """
49         爬取小说数据,包裹小说类型,小说阅读量,小说打赏量。
50         :return:
51         """
52         self.novel_url_spider()
53         for novel_url in self.novel_urls:
54             novel_res = requests.get(novel_url, headers=self.headers)
55             novel_res.encoding = "gb2312"
56             try:  # 异常捕捉,防止程序崩溃。
57                 # 使用枕着表达式提取数据。
58                 novel_type = re.search('<span class="colorQianHui">小说分类.+?<a href=.+? target="_blank" title=.+?>(.+?)</a>', novel_res.text, flags=re.DOTALL).group(1)
59                 reading_count = re.search(r'<span class="colorQianHui mgLeft20">总阅读数:<span class="colorHei">(\d+?)</span></span>', novel_res.text).group(1)
60                 reading_count = int(reading_count)
61                 reward_count = re.search(r'<span class="colorQianHui mgLeft20">总鲜花数:<span class="colorHei">(\d+?)</span></span>', novel_res.text).group(1)
62             except (AttributeError, ValueError):
63                 print("数据抓取错误")
64                 continue
65             else:
66                 # 将数据插入到对应的列表、字典中。
67                 if novel_type in self.novel_type_data:
68                     self.novel_type_data[novel_type] += reading_count
69                 self.novel_data[novel_url] = {"reading_count": reading_count, "reward_count": reward_count}
70                 print(f'{novel_type}: {reading_count}阅读 - {reward_count}打赏')
71             sleep(random())
72
73         print(self.novel_type_data)
四、爬虫程序设计
数据分析与可视化,如图
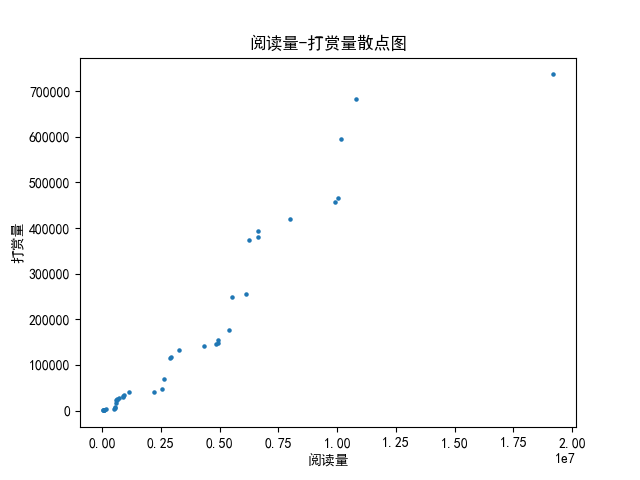
1.散点图
 1       制作散点图,
 2         :return:
 3         """
 4         x_reading, y_reward = self.data_clean()  # 获取清洗后的数据, 下同
 5
 6         axes_3 = plt.axes()
 7         axes_3.scatter(x_reading, y_reward, s=5)
 8         axes_3.set_title("阅读量-打赏量散点图")
 9         axes_3.set_xlabel("阅读量")
10         axes_3.set_ylabel("打赏量")
11         plt.savefig("./scatter_plot.png")
12         plt.show()
2.柱状图
 1 绘制柱状图,分析各类小说类型的阅读量。
 2         :return:
 3         """
 4         axes_1 = plt.axes()
 5         x = []
 6         y = []
 7         for each in self.novel_type_data:
 8             x.append(each)
 9             y.append(self.novel_type_data[each])
10
11         axes_1.bar(x, y, 0.4, color="blue")
12         axes_1.set_xlabel("小说类型")  # 设置横轴标签, 下同
13         axes_1.set_ylabel("阅读量")   # 设置纵轴标签,下同
14         axes_1.set_title("各类小说阅读量柱状图")  # 设置图表标题,下同
15         plt.savefig("./histogram.png")  # 保存图表到本地,下同。
16         plt.show()  # 图表展示,下同。
17
18     def make_pie_chart(self):

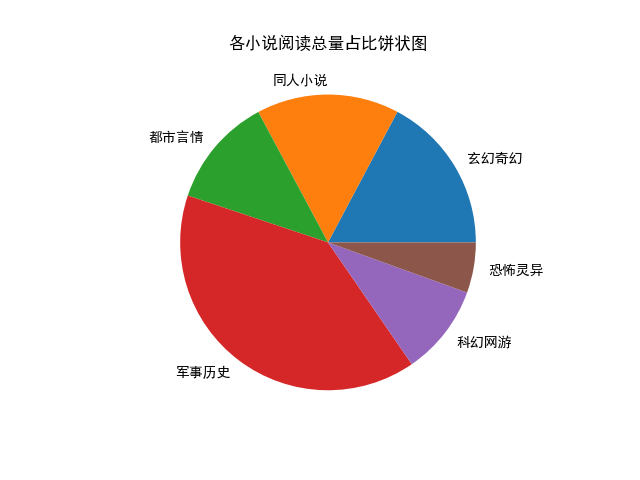
3.饼状图
 1 绘制小说类型饼状图,分析占比。
 2         :return:
 3         """
 4         novel_types = []
 5         novel_reading_data = []
 6         for novel_type in self.novel_type_data:
 7             if self.novel_type_data[novel_type]:
 8                 novel_types.append(novel_type)
 9                 novel_reading_data.append(self.novel_type_data[novel_type])
10
11         axes_2 = plt.axes()
12         axes_2.pie(novel_reading_data, labels=novel_types)
13         axes_2.set_title("各小说阅读总量占比饼状图")
14         plt.savefig("./pie_chart.png")
15         plt.show()
4.回归方程
 1       建立回归函数模型
 2         :return:
 3         """
 4         x_reading, y_reward = self.data_clean()  # 获取数据清洗后的数据
 5         x_reading = np.array(x_reading)
 6
 7         regression = linear_model.LinearRegression()
 8         regression.fit(x_reading.reshape(-1, 1), y_reward)  # 数据拟合
 9         a, b = regression.coef_, regression.intercept_  # 获取斜率、截距
10         print(f"回归方程: y={a[0]}x+b")
11
12         axes_4 = plt.axes()
13         axes_4.scatter(x_reading, y_reward, s=5, color="red")
14         axes_4.plot(x_reading, regression.predict(x_reading.reshape(-1, 1)), color="blue")
15         axes_4.set_title("阅读量-打赏量回归方程魔性图")
16         axes_4.set_xlabel("阅读量")
17         axes_4.set_ylabel("打赏量")
18         plt.savefig("./regression_equation.png")
19         plt.show()

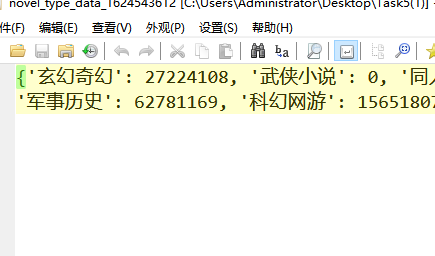
在main函数中分别调用novel_data_spider() make_histogram() make_pie_chart() make_scatter_plot() regression_equation() save_data()函数分别输出如下内容:

总代码
  1 # -*- coding: UTF-8 -*-
  2 # !/usr/bin/env python3
  3 # Author:  ZhangQiancheng
  4
  5 import re
  6 import time
  7 import requests
  8 import numpy as np
  9 from time import sleep
 10 from random import random
 11 import matplotlib.pyplot as plt
 12 from sklearn import linear_model
 13
 14
 15 class Work(object):
 16     def __init__(self):
 17         self.novel_urls = []  # 初始化小说地址列表,
 18
 19         self.novel_type_data = {
 20             "玄幻奇幻": 0,
 21             "武侠小说": 0,
 22             "同人小说": 0,
 23             "都市言情": 0,
 24             "军事历史": 0,
 25             "科幻网游": 0,
 26             "恐怖灵异": 0,
 27             "青春校园": 0
 28         }   # 初始化小说类型数据
 29         self.novel_data = {}  # 初始化小说数据
 30         plt.rcParams['font.sans-serif'] = ['SimHei']  # 设置matplotlib支持中文
 31         self.headers = {"User-Agent": "Mozilla/5.0 (Windows NT 10.0; Win64; x64) AppleWebKit/537.36 (KHTML, like Gecko) Chrome/91.0.4472.114 Safari/537.36"}
 32
 33     def novel_url_spider(self):
 34         """
 35         在总库页面中,获取小说链接地址。
 36         :return:
 37         """
 38         for page in range(1, 51):
 39             index_url = f"https://b.faloo.com/y_0_0_0_0_0_0_{page}.html"
 40             index_res = requests.get(index_url, headers=self.headers)
 41             index_res.encoding = "gb2312"  # 网页内容编码转换, 下同。
 42             novel_urls_temp = re.findall(r"//b.faloo.com/\d+?\.html", index_res.text)
 43             self.novel_urls = list(set([f'https:{i}' for i in novel_urls_temp]))
 44             sleep(random())  # 随机休眠, 反爬并减少对目标网站的访问压力。
 45             break  # 测试使用,减少爬虫运行时间, 下同
 46
 47     def novel_data_spider(self):
 48         """
 49         爬取小说数据,包裹小说类型,小说阅读量,小说打赏量。
 50         :return:
 51         """
 52         self.novel_url_spider()
 53         for novel_url in self.novel_urls:
 54             novel_res = requests.get(novel_url, headers=self.headers)
 55             novel_res.encoding = "gb2312"
 56             try:  # 异常捕捉,防止程序崩溃。
 57                 # 使用枕着表达式提取数据。
 58                 novel_type = re.search('<span class="colorQianHui">小说分类.+?<a href=.+? target="_blank" title=.+?>(.+?)</a>', novel_res.text, flags=re.DOTALL).group(1)
 59                 reading_count = re.search(r'<span class="colorQianHui mgLeft20">总阅读数:<span class="colorHei">(\d+?)</span></span>', novel_res.text).group(1)
 60                 reading_count = int(reading_count)
 61                 reward_count = re.search(r'<span class="colorQianHui mgLeft20">总鲜花数:<span class="colorHei">(\d+?)</span></span>', novel_res.text).group(1)
 62             except (AttributeError, ValueError):
 63                 print("数据抓取错误")
 64                 continue
 65             else:
 66                 # 将数据插入到对应的列表、字典中。
 67                 if novel_type in self.novel_type_data:
 68                     self.novel_type_data[novel_type] += reading_count
 69                 self.novel_data[novel_url] = {"reading_count": reading_count, "reward_count": reward_count}
 70                 print(f'{novel_type}: {reading_count}阅读 - {reward_count}打赏')
 71             sleep(random())
 72
 73         print(self.novel_type_data)
 74
 75     def make_histogram(self):
 76         """
 77         绘制柱状图,分析各类小说类型的阅读量。
 78         :return:
 79         """
 80         axes_1 = plt.axes()
 81         x = []
 82         y = []
 83         for each in self.novel_type_data:
 84             x.append(each)
 85             y.append(self.novel_type_data[each])
 86
 87         axes_1.bar(x, y, 0.4, color="blue")
 88         axes_1.set_xlabel("小说类型")  # 设置横轴标签, 下同
 89         axes_1.set_ylabel("阅读量")   # 设置纵轴标签,下同
 90         axes_1.set_title("各类小说阅读量柱状图")  # 设置图表标题,下同
 91         plt.savefig("./histogram.png")  # 保存图表到本地,下同。
 92         plt.show()  # 图表展示,下同。
 93
 94     def make_pie_chart(self):
 95         """
 96         绘制小说类型饼状图,分析占比。
 97         :return:
 98         """
 99         novel_types = []
100         novel_reading_data = []
101         for novel_type in self.novel_type_data:
102             if self.novel_type_data[novel_type]:
103                 novel_types.append(novel_type)
104                 novel_reading_data.append(self.novel_type_data[novel_type])
105
106         axes_2 = plt.axes()
107         axes_2.pie(novel_reading_data, labels=novel_types)
108         axes_2.set_title("各小说阅读总量占比饼状图")
109         plt.savefig("./pie_chart.png")
110         plt.show()
111
112     def data_clean(self):
113         """
114         为回归方程建模以及绘制散点图做准备。
115         :return:
116         """
117         x_reading = []
118         y_reward = []
119         for novel in self.novel_data:
120             x_reading.append(int(self.novel_data[novel]["reading_count"]))
121             y_reward.append(int(self.novel_data[novel]["reward_count"]))
122
123         x_reading.sort()  # 从大到小排序,下同
124         y_reward.sort()
125         x_reading = x_reading[1:-1]  # 去除最值,下同。
126         y_reward = y_reward[1:-1]
127
128         return x_reading, y_reward
129
130     def make_scatter_plot(self):
131         """
132         制作散点图,
133         :return:
134         """
135         x_reading, y_reward = self.data_clean()  # 获取清洗后的数据, 下同
136
137         axes_3 = plt.axes()
138         axes_3.scatter(x_reading, y_reward, s=5)
139         axes_3.set_title("阅读量-打赏量散点图")
140         axes_3.set_xlabel("阅读量")
141         axes_3.set_ylabel("打赏量")
142         plt.savefig("./scatter_plot.png")
143         plt.show()
144
145     def regression_equation(self):
146         """
147         建立回归函数模型
148         :return:
149         """
150         x_reading, y_reward = self.data_clean()  # 获取数据清洗后的数据
151         x_reading = np.array(x_reading)
152
153         regression = linear_model.LinearRegression()
154         regression.fit(x_reading.reshape(-1, 1), y_reward)  # 数据拟合
155         a, b = regression.coef_, regression.intercept_  # 获取斜率、截距
156         print(f"回归方程: y={a[0]}x+b")
157
158         axes_4 = plt.axes()
159         axes_4.scatter(x_reading, y_reward, s=5, color="red")
160         axes_4.plot(x_reading, regression.predict(x_reading.reshape(-1, 1)), color="blue")
161         axes_4.set_title("阅读量-打赏量回归方程魔性图")
162         axes_4.set_xlabel("阅读量")
163         axes_4.set_ylabel("打赏量")
164         plt.savefig("./regression_equation.png")
165         plt.show()
166
167     def save_data(self):
168         """
169         将爬虫的数据内容保存到文件,
170         :return:
171         """
172         time_ = int(time.time())
173         novel_type_data_name = f"novel_type_data_{time_}"
174         novel_data_name = f"novel_data_{time_}"
175
176         with open(novel_type_data_name, "w", encoding="utf-8") as file:
177             file.write(str(self.novel_type_data))
178
179         with open(novel_data_name, "w", encoding="utf-8") as file2:
180             file2.write(str(self.novel_data))
181
182     def main(self):
183         """
184         统一调用各个函数,
185         :return:
186         """
187         self.novel_data_spider()
188         self.make_histogram()
189         self.make_pie_chart()
190         self.make_scatter_plot()
191         self.regression_equation()
192         self.save_data()
193
194
195 if __name__ == "__main__":
196     work = Work()
197     work.main()

 浙公网安备 33010602011771号