How to install Ta-Lib in Python
Technical indicators are calculated using historical price and volume data to predict the market direction. These indicators are added on charts using which you can set your entry and exit signals.
Won’t it be amazing if you can compute these technical indicators in python in a few lines of code and backtest the performance of it on many financial securities?
What started off as a hobby by Mario Fortier, Ta-Lib python library quickly rose to become one of the most famous libraries for technical analysis of stocks and other financial securities. Ta-lib includes 150+ indicators such as ADX, MACD, RSI and Bollinger Bands and candlestick pattern recognition.
However, it is difficult and sometimes frustrating to install Ta-Lib in your python. But don’t worry, in this article, we will simplify the installation for you so that you can focus on creating and backtesting strategies.
We will cover the following topics in this Ta-Lib installation tutorial.
- Install Ta-Lib on Windows PC
- Install Ta-Lib on MacOS
- Install Ta-Lib on Linux
- Technical Indicators using Python Ta-Lib
Before we begin, why was Python Ta-Lib created in the first place? Let us think about the reason functions were made. It was realised that instead of writing the same code, we could create a function and reduce the code length by a huge margin. It is the same logic we apply to Ta-Lib. Instead of writing a few lines of code to first find the upper and lower bands and then the Bollinger band, we use Ta-Lib and input just one line of code to get the result. That is all! Keeping that in mind, let us begin with the tutorial on Python Ta-Lib.
Install Ta-Lib on Windows PC
Step 0: We suggest the Anaconda installer for installing Python as it is easier to work with when it comes to programming in Python.
Step 1: Once you have installed Anaconda, you will use the Anaconda prompt window to install the relevant files.
Before we download the Python Ta-Lib files, we have to verify the Python version as well as the Windows System architecture (32-bit or 64-bit) on our computer.
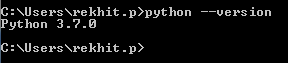
You can find the version installed in your system by simply writing the following code in the Anaconda prompt window: python --version
You will get the output as shown below:
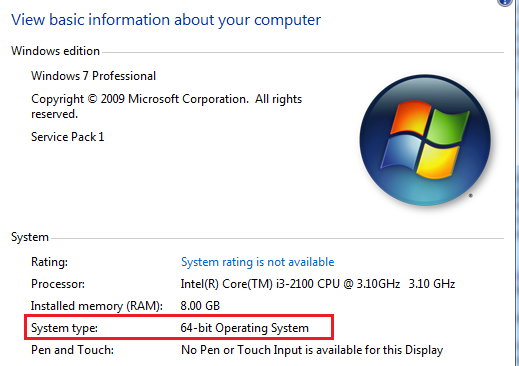
For the windows architecture, you can simply right-click on your "computer" (usually named as "This-PC" or "My Computer") icon and click properties and your system details will be displayed.

Step 2: We cannot directly use the "pip install" command when it comes to installing Ta-Lib. Thus, we will first install the "whl" file which can be found on this link: https://www.lfd.uci.edu/~gohlke/pythonlibs/#ta-lib
The website is a useful resource for a lot of Python extensions, but we are concerned about Ta-Lib installation for now.
You can scroll down to the section where we will find the relevant links, as shown below:

One should note that you should download the file keeping your Python version and Windows architecture (32 bit or 64 bit) in mind. E.g. Since we have the python version 3.7 installed and 64 bit Windows 7 system, we will download the file, “TA_Lib‑0.4.17‑cp37‑cp37m‑win_amd64.whl”.
As you might have guessed “cp37” implies Python version 3.7 and “win_amd64” implies Windows 64 bit operating system.
By default, the "whl" file gets downloaded in the "Downloads" folder. Since we have used Anaconda installer for Python, we will place the file in the same folder location which is shown on the Anaconda prompt.
For eg: C:\Users\rekhit.p

And now comes the easy part.
In the Anaconda prompt, use the pip install command with the file name of the downloaded file.
Since we have downloaded the file, “TA_Lib‑0.4.17‑cp37‑cp37m‑win_amd64.whl”, the command would be, pip install TA_Lib-0.4.17-cp37-cp37m-win_amd64.whl
If there is no error, then it implies that we have successfully installed Ta-Lib. You should get a screen with the following messages.
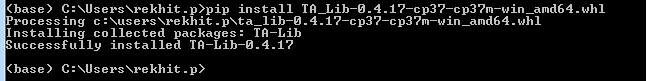
Great! We have just finished installing the Ta-Lib Python library.
But how do we check if it is correctly installed?
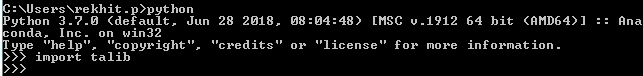
On the Anaconda command prompt, you will first type “python” to interpret the program.
We will then type the following command, “import talib” and then press Enter.
If there are no errors, then it means that the python Ta-Lib library has been successfully installed on your computer.
Alternatively, you can also open Jupyter notebook (or Spyder) and try to run the same code to check if the Python Ta-Lib is installed correctly.

Install Ta-Lib on MacOS
In comparison to the windows installation, Python Ta-Lib installation is relatively straightforward and easy on the MacOS. But before we talk about the installation of Ta-Lib, we have to make sure the python environment is installed as well.
You can install Anaconda from the following link or download Python from the following link. In our opinion, it is generally a good idea to install Anaconda as it helps build an environment for your python code to be executed seamlessly.
Note that during the Anaconda installation, you will be asked to install either Python 2.7 or 3.7. Since the support for Python 2.7 ended on January 1, 2020, it would be advisable to select the 3.7 version. For a seamless installation, choose the graphical installer.

You will then be greeted with the following dialog box.

Select “Continue” tab and choose the appropriate install destination and you will finish installation in a short time.
All right, now we move on to the main event, i.e. Python Ta-lib installation. Ok, there is one small step you need to do before the main install.
Check if you can use the ‘brew’ command. For this tutorial on how to install Ta-Lib, let us assume that the ‘brew’ command throws an error. To rectify this, we install the necessary package by using the following line of code in the MacOS shell:
ruby -e "$(curl -fsSL https://raw.githubusercontent.com/Homebrew/install/master/install)"
If it is successful, you will see the following messages:

Of course, you will get a prompt which asks you to press “Return” to continue the installation or any other key to cancel the installation. If you are curious about the ‘brew’ command, you can always visit the following website to know more.
Great! Now that the brew command is installed, use the following code to install the Ta-Lib operating system dependencies:
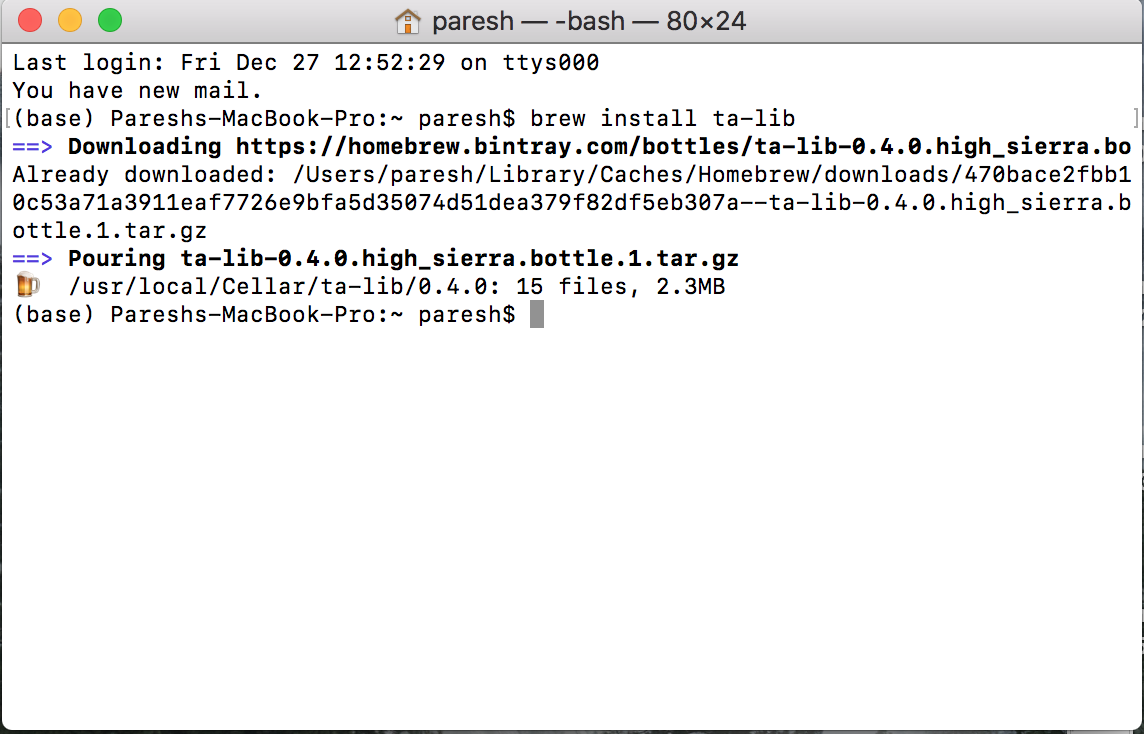
brew install ta-lib
You will see the following screen
Now, we use the familiar command i.e. “pip” to install Ta-Lib on our MacOS. The command is as follows:
pip install ta-lib
You see the following files being installed on your system.

Great! We have been successful in our quest to install Ta-Lib on MacOS.
But how do we check if it is correctly installed on the system? Simple, we use the following commands.
First, we call the python language by simply writing “python” in the terminal. We then use the following command to import the Ta-Lib library.
import talib
If there is no error, then we should be able to see the following screen

Install Ta-Lib on Linux
The Ta-lib installation in Linux can be a bit tricky. The libraries necessary for the Ta-lib installation should be installed first before you install the Python wrapper.
But don’t worry! We have provided comprehensive steps on how to install the Ta-lib library in your Linux system.
Step 0: Install Anaconda in your Linux system. You can follow the documentation or execute the commands as shared below.
The following command installs the Anaconda software and creates an environment named ‘quantra’. You can use this environment for your Quantra related coding projects!
- Install the prerequisites
- Install Anaconda on your system
| sudo apt-get -y install gcc build-essential |
 Install the prerequisites for Anaconda
| wget -O inst_conda.sh "https://repo.anaconda.com/archive/Anaconda3-2020.11-Linux-x86_64.sh" \ | |
| && /bin/bash inst_conda.sh -b \ | |
| && rm inst_conda.sh \ | |
| && ./anaconda3/bin/conda init \ | |
| && source ~/.bashrc \ | |
| && conda create -n quantra python=3.6.8 -y \ | |
| && conda activate quantra |
 Install Anaconda and create a new environment
Step 1: Install the Ta-lib dependencies and Python wrapper by executing the following command.
| wget http://prdownloads.sourceforge.net/ta-lib/ta-lib-0.4.0-src.tar.gz \ | |
| && sudo tar -xzf ta-lib-0.4.0-src.tar.gz \ | |
| && sudo rm ta-lib-0.4.0-src.tar.gz \ | |
| && cd ta-lib/ \ | |
| && sudo ./configure --prefix=/usr \ | |
| && sudo make \ | |
| && sudo make install \ | |
| && cd ~ \ | |
| && sudo rm -rf ta-lib/ \ | |
| && pip install ta-lib |
 Install the Ta-lib dependencies and Python wrapper
This will take a couple of minutes and install all the libraries necessary for using Ta-lib.
 Ta-lib installation complete
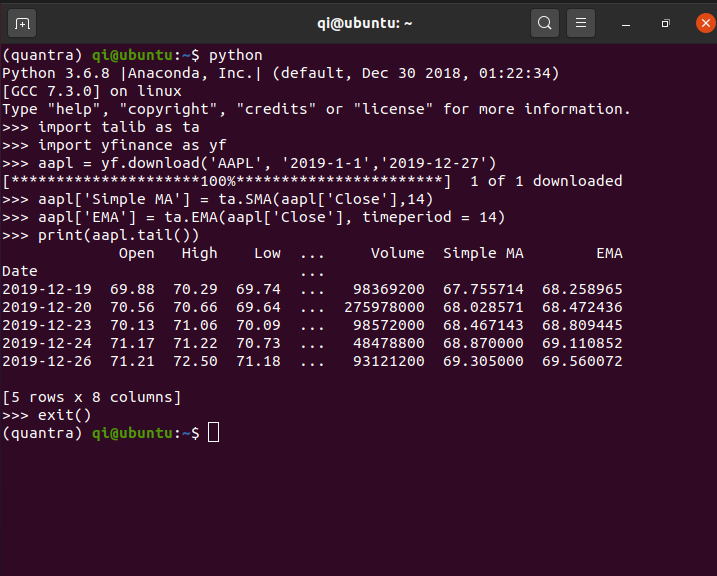
Step 2: Test the Ta-lib installation by executing a sample script. We take some data and try to find the moving average using the Ta-lib libraries.
- Install yfinance library if you do not have it already
- Run Python in the terminal
- Paste the following code lines to check if Ta-lib is working properly or not.
- You should see a Simple MA and EMA column similar to the screenshot below.
| pip install yfinance==0.1.44 |
| python |
 Launch Python
| import talib as ta | |
| import yfinance as yf | |
| aapl = yf.download('AAPL', '2019-1-1','2019-12-27') | |
| aapl['Simple MA'] = ta.SMA(aapl['Close'],14) | |
| aapl['EMA'] = ta.EMA(aapl['Close'], timeperiod = 14) | |
| print(aapl.tail()) |
The Ta-lib library is now installed in the 'quantra' environment! To know how to activate and switch environments, please refer to the Conda resource here.
Awesome! We have now been successful in installing Python Ta-Lib on Windows, MacOS and Linux. But can we really stop here? In the next section, we try a simple code using the Ta-Lib library.
Technical Indicators using Ta-Lib
We will first import the Python Ta-Lib library since we are using it to work out different indicators. Along with that, we use the python matplotlib to draw their graphs for analysis. Since we are going to be working on the stock prices, we will import the data from Yahoo Finance.
Thus, the code will be as follows:
import talib as ta
import matplotlib.pyplot as plt
plt.style.use('bmh')
import yfinance as yf
aapl = yf.download('AAPL', '2019-1-1','2019-12-27')
In the above example, we have imported the stock price data of Apple from 1 January 2019 to 27 December 2019.
Let us start off with something simple. We will find the Simple Moving Average and the Exponential Moving Average of Apple stock data. We will use the following code:
aapl['Simple MA'] = ta.SMA(aapl['Close'],14)
aapl['EMA'] = ta.EMA(aapl['Close'], timeperiod = 14)
# Plot
aapl[['Close','Simple MA','EMA']].plot(figsize=(15,15))
plt.show()
The output is as follows:

That was simple, wasn’t it?
Recall that at the start of this tutorial on Installing Python Ta-Lib, we talked about Bollinger Bands. Well, let’s try that one now.
# Bollinger Bands
aapl['upper_band'], aapl['middle_band'], aapl['lower_band'] = ta.BBANDS(aapl['Close'], timeperiod =20)
# Plot
aapl[['Close','upper_band','middle_band','lower_band']].plot(figsize=(15,15))
plt.show()
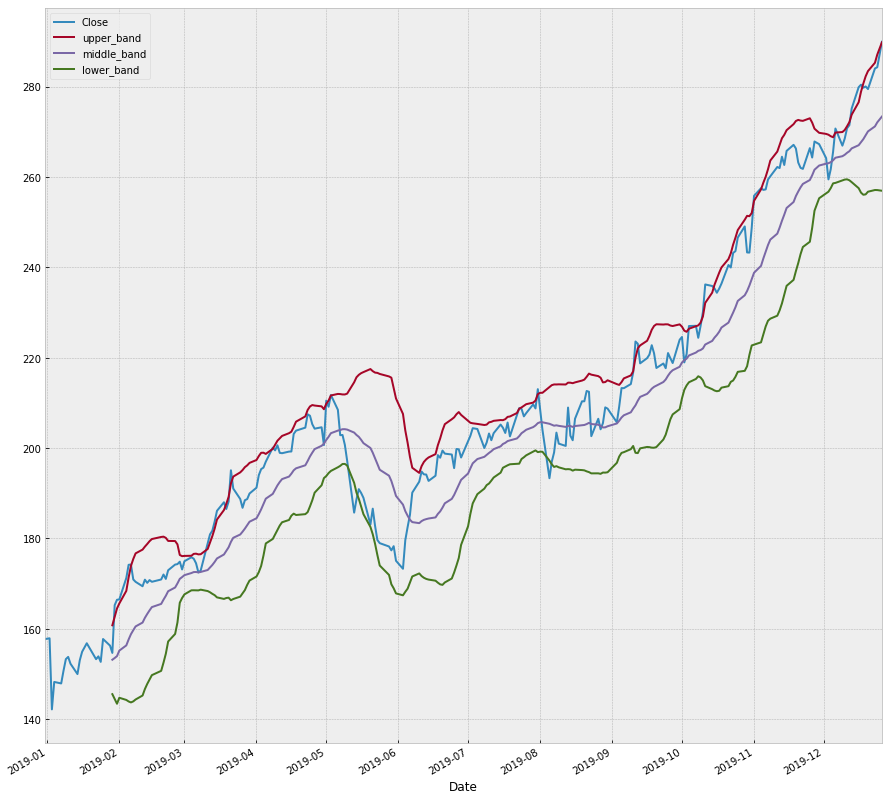
Wasn’t it easy? We are sure you are getting it but let us break down the line and see how Python Ta-Lib worked out the Bollinger Bands.
To create the Bollinger bands, we simply passed the Closing Price ie the “Close” column and defined a time period of 20 for the moving average. This is done using the “ta.BBANDS()” function. As the Bollinger bands consist of three bands, we store the data in the following three columns, “upper_band”, “middle_band” and “lower_band.
aapl['upper_band'], aapl['middle_band'], aapl['lower_band'] = ta.BBANDS(aapl['Close'], timeperiod =20)
Now, can you figure out from the code below, what are the parameters passed?
aapl['RSI'] = ta.RSI(aapl['Close'],14)
aapl['RSI'].plot(figsize=(15,15))
plt.show()

As a bonus, we plotted the Stochastic oscillators as well, the code is given below:
aapl['slowk'], aapl['slowd'] = ta.STOCH(aapl['High'], aapl['Low'], aapl['Close'], fastk_period=14, slowk_period=3, slowk_matype=0, slowd_period=3, slowd_matype=0)
aapl[['slowk','slowd']].plot(figsize=(15,15))
plt.show()

aapl['fastk'], aapl['fastd'] = ta.STOCHF(aapl['High'], aapl['Low'], aapl['Close'], fastk_period=14, fastd_period=3, fastd_matype=0)
aapl[['fastk','fastd']].plot(figsize=(15,15))
plt.show()

Phew! You can go ahead and check out the other indicators on the following website as well.
Conclusion
Thus, we have gone through the Tutorial on how to install Python Ta-Lib on Windows, MacOS as well as Linux. We have also found how to create a few technical indicators using Ta-Lib and plot them.
If you want to learn various aspects of Algorithmic trading and automated trading systems, then check out the Executive Programme in Algorithmic Trading (EPAT®). The course covers training modules like Statistics & Econometrics, Financial Computing & Technology, and Algorithmic & Quantitative Trading. EPAT® equips you with the required skill sets to build a promising career in algorithmic trading. Enroll now!
Disclaimer: All data and information provided in this article are for informational purposes only. QuantInsti® makes no representations as to accuracy, completeness, currentness, suitability, or validity of any information in this article and will not be liable for any errors, omissions, or delays in this information or any losses, injuries, or damages arising from its display or use. All information is provided on an as-is basis.

 浙公网安备 33010602011771号