gdb调试应用笔记
GDB介绍(来自man手册):
The purpose of a debugger such as GDB is to allow you to see what is going
on "inside" another program while it executes -- or what another program
was doing at the moment it crashed.
翻译就是:调试器(如GBD)的目标工作就是让你看看程序执行时在内部是怎么样运行的或者在它挂掉的时候是怎么运行的。
GDB can do four main kinds of things (plus other things in support of
these) to help you catch bugs in the act:
- Start your program, specifying anything that might affect its behavior.
- Make your program stop on specified conditions.
- Examine what has happened, when your program has stopped.
- Change things in your program, so you can experiment with correcting
the effects of one bug and go on to learn about another.
翻译就是:GBD主要可以做四件事帮你去抓BUG.
- 开始你的程序,指定一些可能影响程序运行的事情
- 让你的程序停止在特定的条件下
- 当你的程序停止运行时,检查发生了什么。
- 调整你的程序,这样你就可以尝试修正一个bug的影响并继续学习另一个问题
要使用GDB调试程序,生成程序的时候,需要带上-g选项,如gcc -g test.c ,执行的时候,使用gdb启动,gdb a.out
GDB可以有三种调试方式
- 直接启动调试程序
gdb a.out - 调试挂掉的程序,这里必须加上core文件
dgb q.out core - 调试正在运行的程序,这里必须知道进程号
gdb -p 1234
GDB命令不多,大概也就10来个
- break
- run
- bt
- next
- edit
- list
- step
- help
- quit
其他:
程序挂掉的时候,core文件由于比较大,可能不会默认生成,ulimit -a可以查看当前shell有哪些限制,看看会不会生产core文件
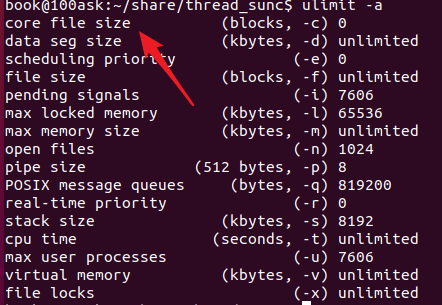
这里发现core文件被限制为0,所以默认不会生成core文件,用命令ulimit -c unlimited来保证能生成core文件
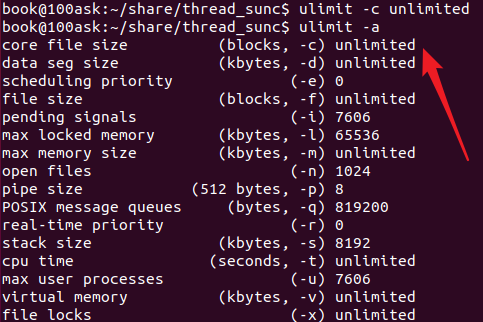
这里可以看到修改变为无限制了,以后有程序挂掉就可以用这个core调试了
如果到这里,执行程序,还是看不到有core文件,那么先用这个命令cat /proc/sys/kernel/core_pattern查看,如果是空或者类似下图这样,那么也没办法生成core文件

使用这个命令即可echo "core.%e.%p" > /proc/sys/kernel/core_pattern
如果执行这个命令提示权限显示,先sudo su,切换到root去执行上条命令,再exit切换回普通用户即可
以上测试环境为Ububtu18.04,参考博客:https://blog.csdn.net/qq_62783912/article/details/130566836

 浙公网安备 33010602011771号