打开文档描点,曲线绘制。
编译工具vs2010,framwork2.0
软件源码和测试文档:百度网盘
目标:把文档数据描点(文档第一行为时间,第二行为数据,依次循环)。
简述:本工具为简单测试,代码粗糙。可以通过打开文档,修改显示数据间隔,显示数据数目,数据最早时间来获取曲线。
通过对picturebox_Paint进行重绘和Graphics进行曲线绘制。
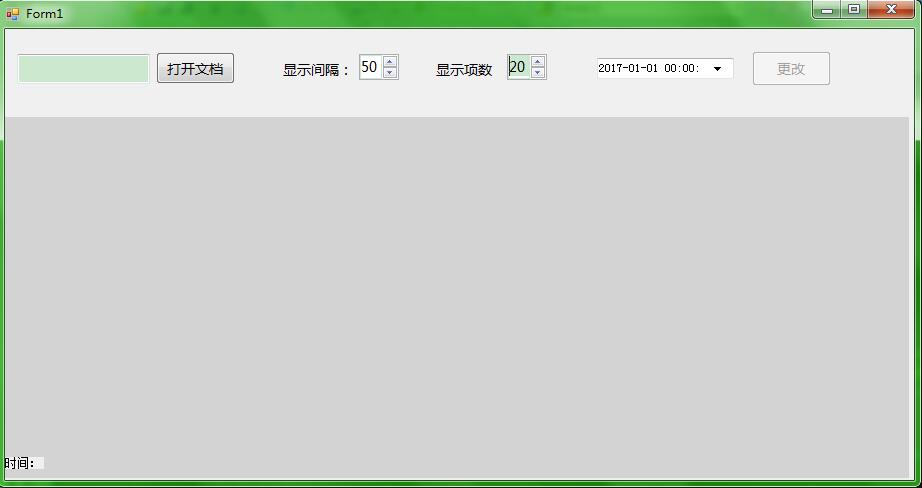
界面:
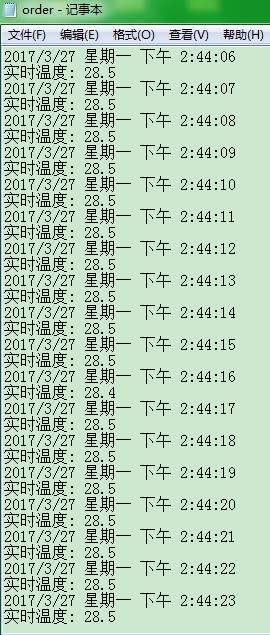
文档内容:
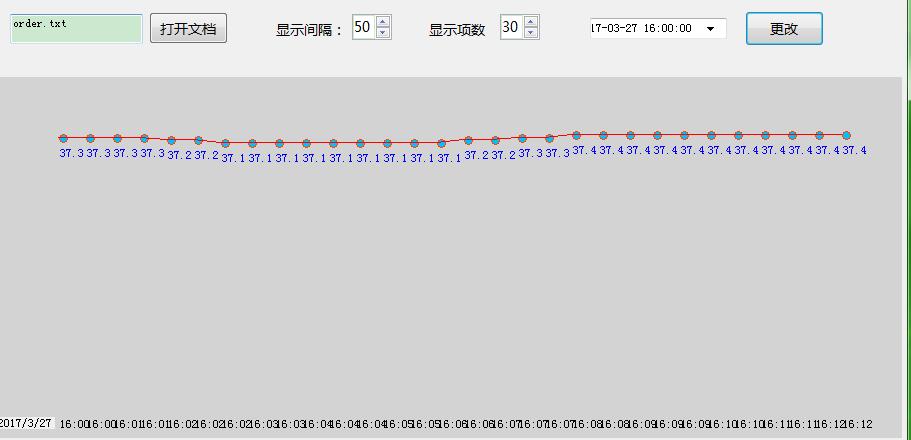
测试时间从16点开始:
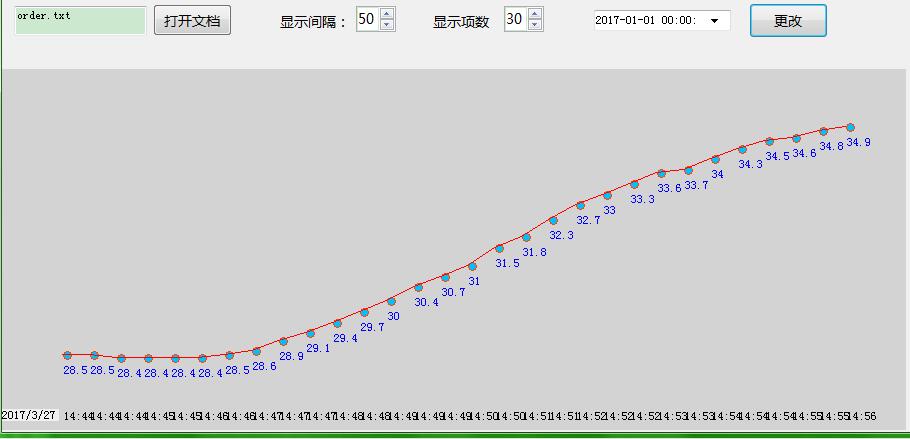
默认时间时2017-01-01:
主要代码:
  private void pictureBox1_Paint(object sender, PaintEventArgs e)
        {
            int width = this.pictureBox1.Width;
            int height = this.pictureBox1.Height;
            if (dValue <=0)//判断数据是否更改,防止重绘错误
            { return; }
            for (int i = 0; i < n; i++)
            {
                DataPoint dataPoint = data[i];
                points[i].X = 60 + (width - 80) / n * i;//让第一个点的起始位置为60
                points[i].Y = (int)((dValue - dataPoint.V + vMin) * 4 * height / (5 * dValue));//通过均值让数据变化量更可视化。
                // points[i].Y = this.Height -(int) dataPoint.V * this.Height / (int)vMax;
                Rectangle rect = new Rectangle(points[i].X+1, points[i].Y-r, r + r, r + r);//r为点的半径。
                e.Graphics.FillEllipse(new SolidBrush(Color.DeepSkyBlue), rect);//点的颜色
                e.Graphics.DrawEllipse(new Pen(Color.OrangeRed, 1), rect);//曲线颜色
                e.Graphics.DrawString(dataPoint.T, this.pictureBox1.Font, new SolidBrush(Color.Black), points[i].X, height - 20);//x轴数据和位置
                e.Graphics.DrawString(dataPoint.V.ToString(), this.pictureBox1.Font, new SolidBrush(Color.Blue), points[i].X, points[i].Y + 10);//给每个点标数据。也可以在y轴标数据,那样不够直观。
            }
            e.Graphics.DrawLines(new Pen(Color.Red, 1), points);
        }
注意事项:
1.时间控件设置:CusromFormat:yyyy-MM-dd HH:mm:ss
Format: Custom
2.因为控件上到下位置大小是递增的,所以第一个点的y轴是最大值。
3.如果重绘失败就会出现×。那就over了,需要打开重新测试。
4.新手代码,仅作参考。

 浙公网安备 33010602011771号