02-26 决策树(鸢尾花分类)
人工智能从入门到放弃完整教程目录:https://www.cnblogs.com/nickchen121/p/11686958.html
决策树(鸢尾花分类)
一、导入模块
import numpy as np
import matplotlib.pyplot as plt
from matplotlib.colors import ListedColormap
from matplotlib.font_manager import FontProperties
from sklearn import datasets
from sklearn.tree import DecisionTreeClassifier
%matplotlib inline
font = FontProperties(fname='/Library/Fonts/Heiti.ttc')
二、获取数据
iris_data = datasets.load_iris()
X = iris_data.data[:, [2, 3]]
y = iris_data.target
label_list = ['山鸢尾', '杂色鸢尾', '维吉尼亚鸢尾']
三、构建决策边界
def plot_decision_regions(X, y, classifier=None):
    marker_list = ['o', 'x', 's']
    color_list = ['r', 'b', 'g']
    cmap = ListedColormap(color_list[:len(np.unique(y))])

    x1_min, x1_max = X[:, 0].min()-1, X[:, 0].max()+1
    x2_min, x2_max = X[:, 1].min()-1, X[:, 1].max()+1
    t1 = np.linspace(x1_min, x1_max, 666)
    t2 = np.linspace(x2_min, x2_max, 666)

    x1, x2 = np.meshgrid(t1, t2)
    y_hat = classifier.predict(np.array([x1.ravel(), x2.ravel()]).T)
    y_hat = y_hat.reshape(x1.shape)
    plt.contourf(x1, x2, y_hat, alpha=0.2, cmap=cmap)
    plt.xlim(x1_min, x1_max)
    plt.ylim(x2_min, x2_max)

    for ind, clas in enumerate(np.unique(y)):
        plt.scatter(X[y == clas, 0], X[y == clas, 1], alpha=0.8, s=50,
                    c=color_list[ind], marker=marker_list[ind], label=label_list[clas])
四、训练模型
tree = DecisionTreeClassifier(criterion='gini', max_depth=5, random_state=1)
tree.fit(X, y)
DecisionTreeClassifier(class_weight=None, criterion='gini', max_depth=5,
            max_features=None, max_leaf_nodes=None,
            min_impurity_decrease=0.0, min_impurity_split=None,
            min_samples_leaf=1, min_samples_split=2,
            min_weight_fraction_leaf=0.0, presort=False, random_state=1,
            splitter='best')
五、可视化
plot_decision_regions(X, y, classifier=tree)
plt.xlabel('花瓣长度(cm)', fontproperties=font)
plt.ylabel('花瓣宽度(cm)', fontproperties=font)
plt.legend(prop=font)
plt.show()

六、可视化决策树
import os
import imageio
import matplotlib.pyplot as plt
from PIL import Image
from pydotplus import graph_from_dot_data
from sklearn.tree import export_graphviz
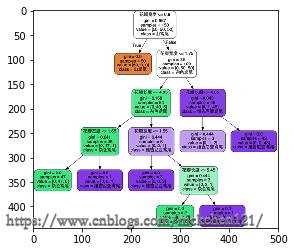
# 可视化整颗决策树
# filled=Ture添加颜色,rounded增加边框圆角
# out_file=None直接把数据赋给dot_data,不产生中间文件.dot
dot_data = export_graphviz(tree, filled=True, rounded=True,
class_names=['山鸢尾', '杂色鸢尾', '维吉尼亚鸢尾'],
feature_names=['花瓣长度', '花瓣宽度'], out_file=None)
graph = graph_from_dot_data(dot_data)
if not os.path.exists('代码-决策树.png'):
graph.write_png('代码-决策树.png')
def cut_img(img_path, new_width, new_height=None):
'''只是为了等比例改变图片大小,没有其他作用'''
img = Image.open(img_path)
width, height = img.size
if new_height is None:
new_height = int(height * (new_width / width))
new_img = img.resize((new_width, new_height), Image.ANTIALIAS)
os.remove(img_path)
new_img.save(img_path)
new_img.close()
cut_img('代码-决策树.png', 500)
# 只是为了展示图片,没有其他作用
img = imageio.imread('代码-决策树.png')
plt.imshow(img)
plt.show()

 浙公网安备 33010602011771号