
3. MySQL DBA运维监控技术指南
高级DBA运维监控技术指南
1. 引言
在现代数据库运维环境中,有效的监控系统是保障数据库高可用性、性能优化和故障快速响应的关键。本指南整合了当前主流的数据库监控解决方案,包括Prometheus+Grafana、PMM (Percona Monitoring and Management)和Zabbix,为高级DBA提供全面的监控方案实施指南。
2. Prometheus + Grafana 监控方案
2.1 Prometheus概述
Prometheus是一个开源的系统监控和警报工具包,最初在SoundCloud构建。自2012年成立以来,已获得广泛采用,拥有活跃的开发者和用户社区。2016年,Prometheus加入云原生计算基金会(CNCF),成为继Kubernetes之后的第二个托管项目。
核心特点:
- 多维数据模型:由度量名称和键/值对标识的时间序列数据
- PromQL:灵活的查询语言,利用维度特性
- 无分布式存储依赖:单个服务器节点是自治的
- 时间序列收集通过HTTP拉模型进行
- 通过gateway支持推送时间序列
- 通过服务发现或静态配置发现目标
- 多种图形模式和仪表板支持
2.2 系统架构
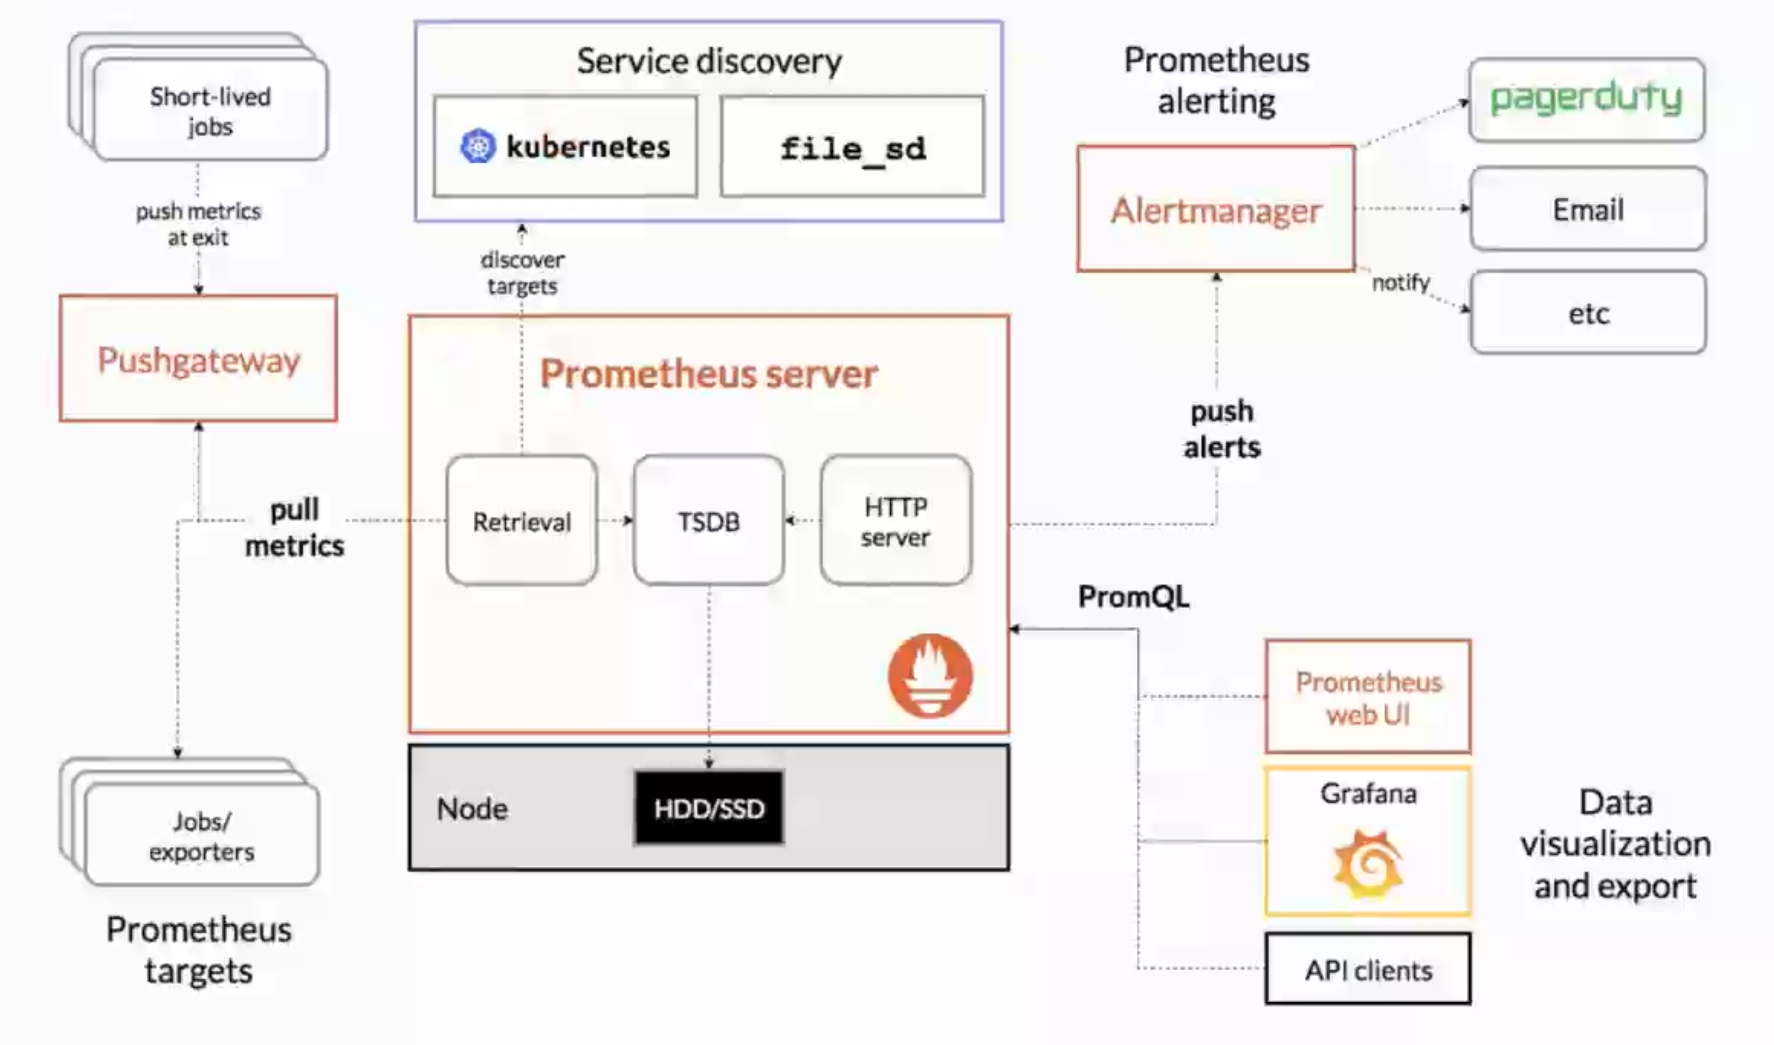
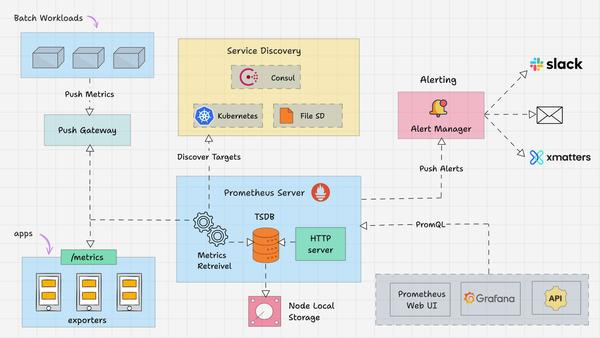
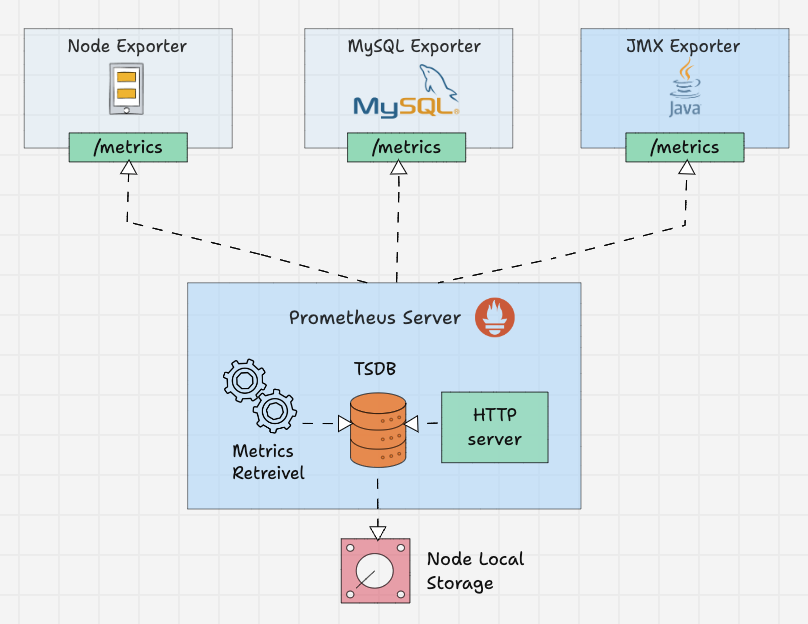
[被监控主机] --> (node_exporter) --> [Prometheus Server] --> (Grafana)
[MySQL数据库] --> (mysqld_exporter) --> [Prometheus Server] --> (Grafana)
2.3 安装与配置
2.3.1 安装Prometheus
- 下载Prometheus:
wget https://github.com/prometheus/prometheus/releases/download/v2.49.0/prometheus-2.49.0.linux-amd64.tar.gz
tar xvf prometheus-2.49.0.linux-amd64.tar.gz
ln -s prometheus-2.49.0.linux-amd64 prometheus
- 启动Prometheus:
cd /usr/local/prometheus
./prometheus --config.file=/usr/local/prometheus/prometheus.yml &
- 验证服务:
netstat -ntlup | grep 9090
# 输出示例:tcp6 0 0 :::9090 :::* LISTEN 7673/prometheus
2.3.2 安装node_exporter
- 下载node_exporter:
wget https://github.com/prometheus/node_exporter/releases/download/v1.7.0/node_exporter-1.7.0.linux-amd64.tar.gz
tar xvf node_exporter-1.7.0.linux-amd64.tar.gz
ln -s node_exporter-1.7.0.linux-amd64 node_exporter
- 启动node_exporter:
nohup /usr/local/node_exporter/node_exporter &
- 验证服务:
netstat -ntlup | grep 9100
# 输出示例:tcp6 0 0 :::9100 :::* LISTEN 7900/node_exporter
2.3.3 安装mysqld_exporter
- 下载mysqld_exporter:
wget https://github.com/prometheus/mysqld_exporter/releases/download/v0.15.1/mysqld_exporter-0.15.1.linux-amd64.tar.gz
tar xvf mysqld_exporter-0.15.1.linux-amd64.tar.gz
ln -s mysqld_exporter-0.15.1.linux-amd64 mysqld_exporter
- 创建监控用户:
CREATE USER 'monitor'@'127.0.0.1' IDENTIFIED WITH mysql_native_password BY '123456';
GRANT SELECT, REPLICATION CLIENT, PROCESS ON *.* TO 'monitor'@'127.0.0.1';
- 配置MySQL客户端:
vim /usr/local/mysqld_exporter/.my.cnf
[client]
host=127.0.0.1
port=3306
user=monitor
password=123456
- 启动mysqld_exporter:
nohup /usr/local/mysqld_exporter/mysqld_exporter --config.my-cnf=/usr/local/mysqld_exporter/.my.cnf &
- 验证服务:
netstat -ntlup | grep 9104
# 输出示例:tcp6 0 0 :::9104 :::* LISTEN 8056/mysqld_exporter
2.3.4 修改Prometheus配置文件
- 编辑prometheus.yml:
vim /usr/local/prometheus/prometheus.yml
添加以下配置:
scrape_configs:
  - job_name: "prometheus"
    static_configs:
      - targets: ["localhost:9090"]
  - job_name: 'node1'
    static_configs:
      - targets: [ '10.0.0.10:9100' ]  # 被监控主机的IP和端口
  - job_name: 'node1-3306'
    static_configs:
      - targets: [ '10.0.0.10:9104' ]
- 重启Prometheus:
pkill prometheus
/usr/local/prometheus/prometheus --config.file=/usr/local/prometheus/prometheus.yml &
- 验证Targets状态: 访问
http://<prometheus-ip>:9090/targets,检查Targets状态
2.3.5 安装Grafana
- 下载Grafana:
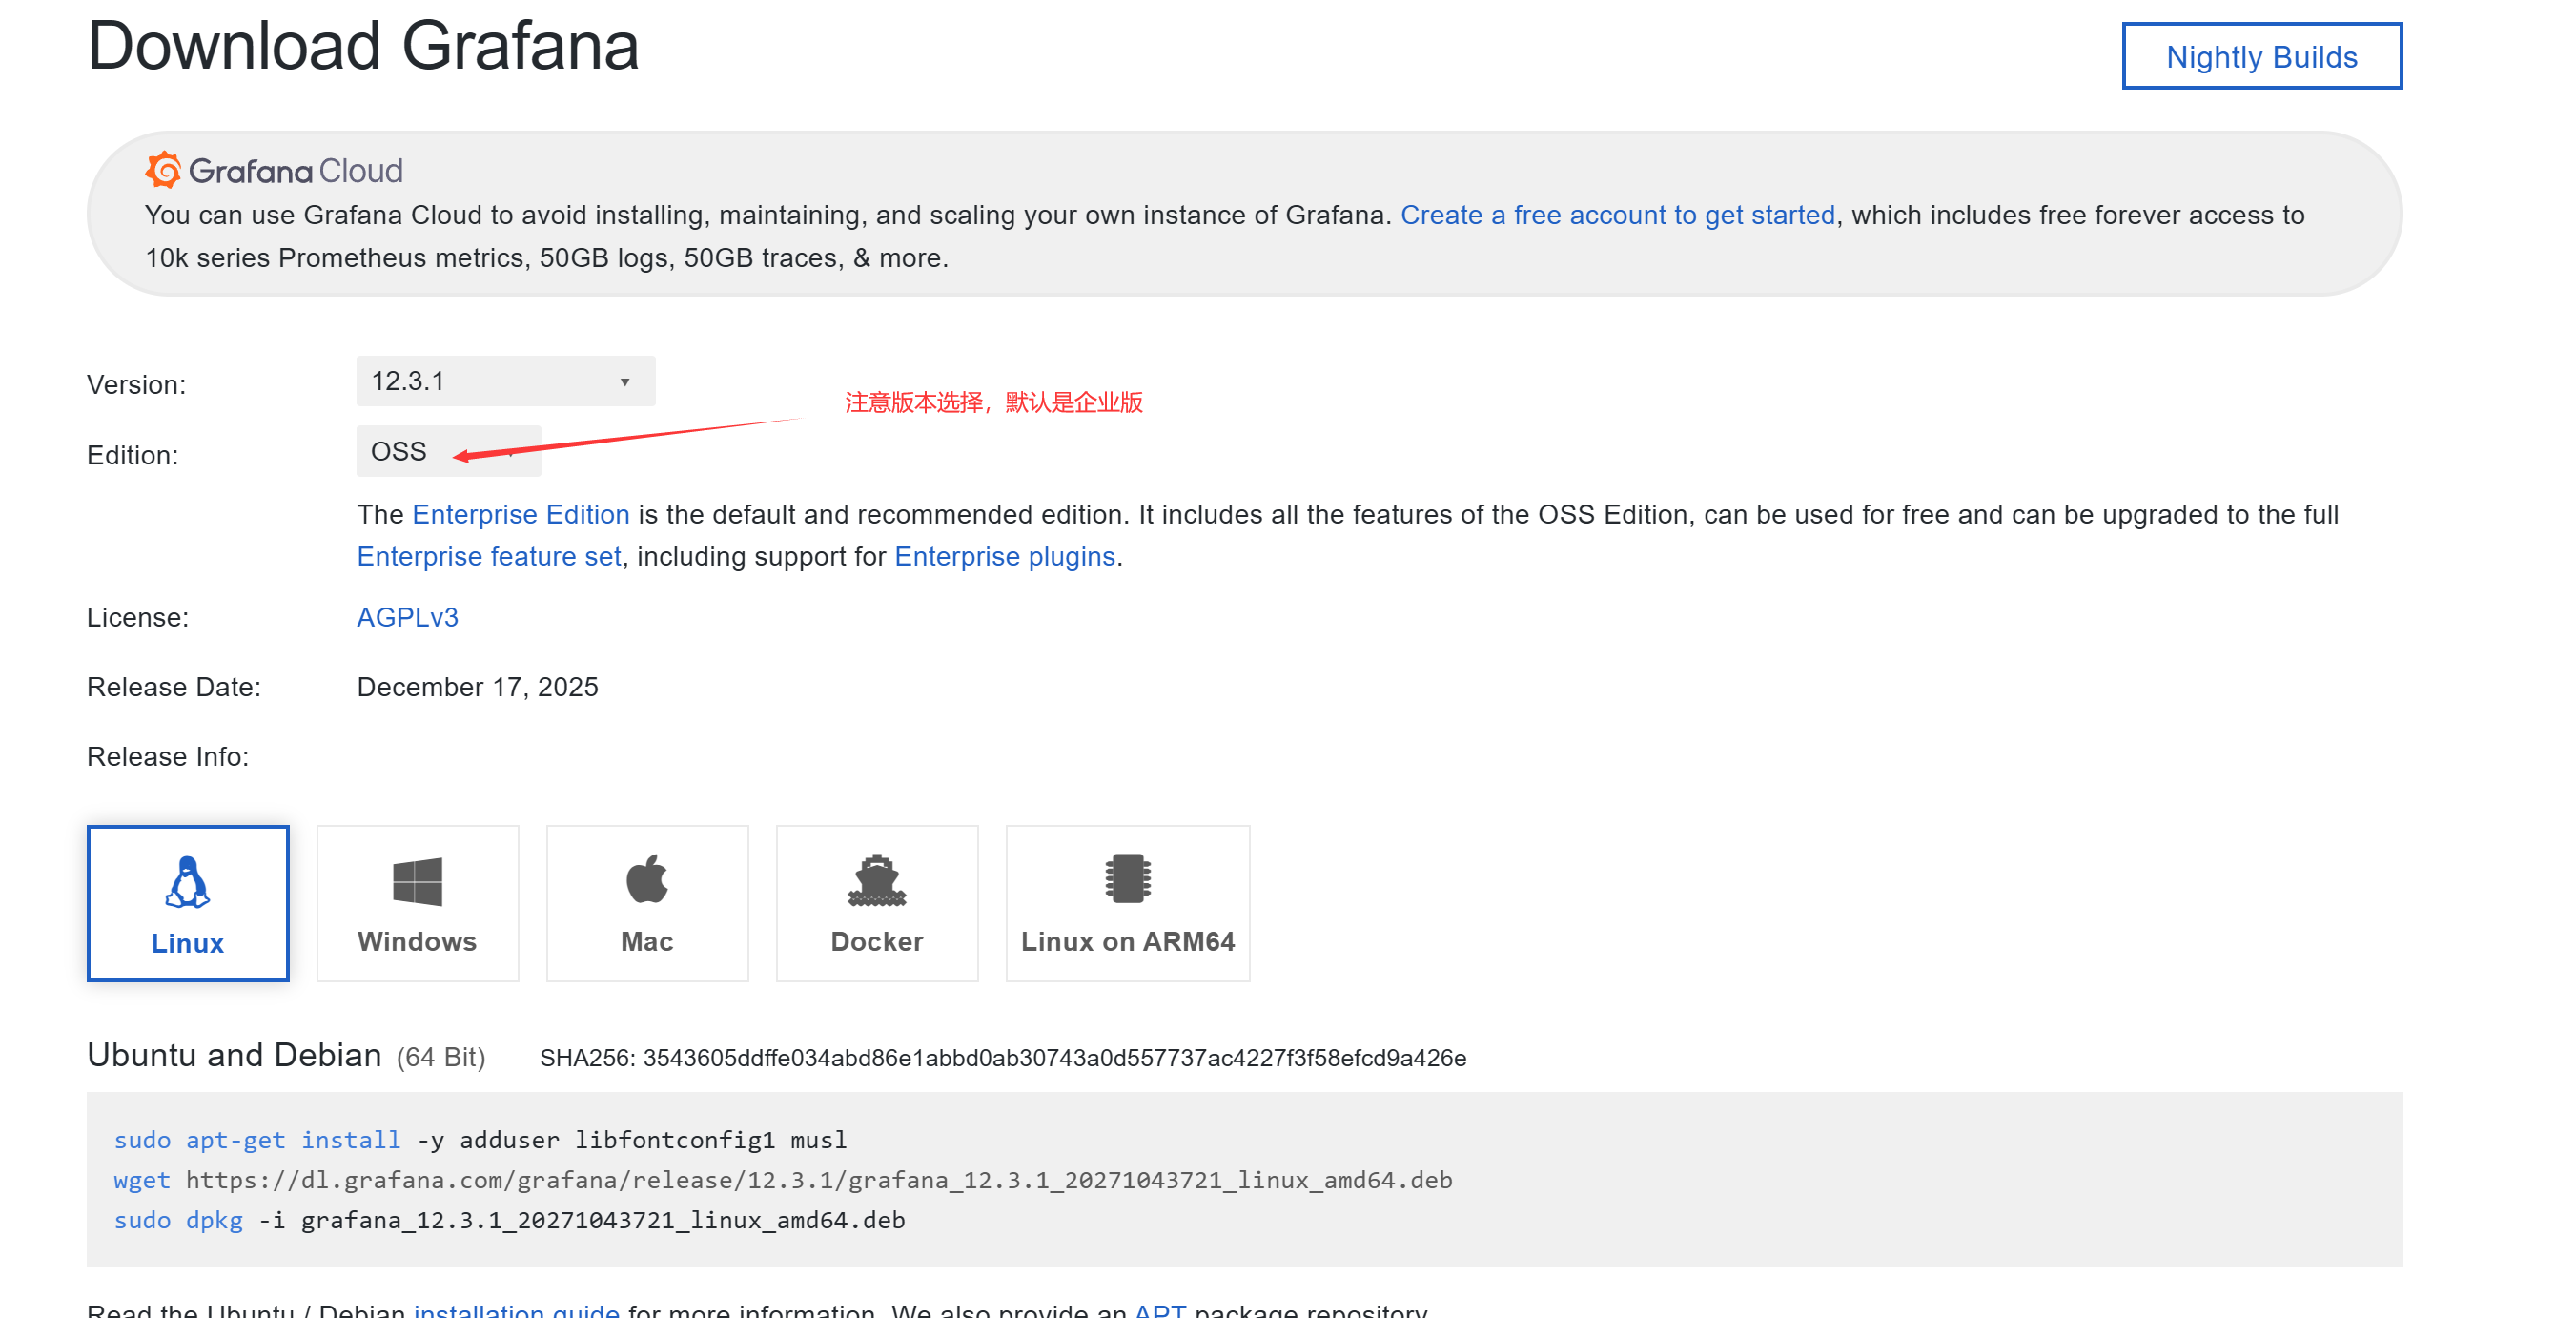
wget https://dl.grafana.com/grafana/release/12.3.1/grafana_12.3.1_20271043721_linux_amd64.tar.gz
tar -zxvf grafana_12.3.1_20271043721_linux_amd64.tar.gz
ln -s grafana-v10.2.3 grafana
- 启动Grafana:
cd grafana
./bin/grafana-server &
- 登录Grafana: 访问
http://<grafana-ip>:3000,默认账号密码:admin/admin
2.3.6 导入Dashboard
- 添加数据源:
- Administration → Data sources
- 选择"Prometheus"
- URL:
http://127.0.0.1:9090 - 点击"Save & Test"验证
- 导入Node Exporter Dashboard:
- 访问 https://grafana.com/grafana/dashboards/1860
- 点击"Import",选择数据源
- 保存并查看效果
- 导入MySQL Dashboard:
- 访问 https://grafana.com/grafana/dashboards/7362
- 点击"Import",选择数据源
- 保存并查看效果
3. PMM (Percona Monitoring and Management) 监控方案
3.1 PMM概述
PMM是Percona提供的开源监控解决方案,专注于MySQL数据库的性能监控和管理。它提供全面的监控指标、性能分析和可视化仪表板。
3.2 安装PMM Server
3.2.1 安装Docker环境
yum install -y yum-utils
yum-config-manager --add-repo https://download.docker.com/linux/centos/docker-ce.repo
yum install docker-ce -y
systemctl start docker
systemctl enable docker
docker run hello-world
3.2.2 创建PMM Server容器
- 拉取PMM Server镜像:
docker pull percona/pmm-server:2
- 创建数据卷容器:
docker create --volume /srv --name pmm-data percona/pmm-server:2 /bin/true
- 启动PMM Server容器:
docker run --detach --restart always \
  --publish 443:443 \
  --volumes-from pmm-data \
  --name pmm-server \
  percona/pmm-server:2
- 验证容器状态:
docker ps -a
CONTAINER ID   IMAGE                                      COMMAND                  CREATED          STATUS                            PORTS                                             NAMES
7d971299c99e   percona/pmm-server:2                       "/opt/entrypoint.sh"     4 seconds ago    Up 3 seconds (health: starting)   80/tcp, 0.0.0.0:443->443/tcp, [::]:443->443/tcp   pmm-server
320fc33ba3bb   percona/pmm-server:2                       "/bin/true"              26 seconds ago   Created                                                                             pmm-data
- 登录PMM Server:
- 地址:
https://<pmm-server-ip>:443 - 默认用户名/密码:admin/admin
- 地址:
3.3 安装PMM Client
3.3.1 下载PMM Client
cd /usr/local/
wget https://downloads.percona.com/downloads/pmm2/2.41.0/binary/tarball/pmm2-client-2.41.0.tar.gz
tar xvf pmm2-client-2.41.0.tar.gz
cd pmm2-client-2.41.0/
./install_tarball
export PATH=$PATH:/usr/local/percona/pmm2/bin
3.3.2 注册pmm-agent
pmm-agent setup --config-file=/usr/local/percona/pmm2/config/pmm-agent.yaml \
  --server-address=<pmm-server-ip> \
  --server-insecure-tls \
  --server-username=admin \
  --server-password=admin \
  当前节点ip地址 \
  generic \  #还有一个参数 container
  node1  # 可以不指定,默认主机名

  ....
Checking local pmm-agent status...
pmm-agent is not running.
Registering pmm-agent on PMM Server...
Registered.
Configuration file /usr/local/percona/pmm2/config/pmm-agent.yaml updated.
Please start pmm-agent: `pmm-agent --config-file=/usr/local/percona/pmm2/config/pmm-agent.yaml`.
3.3.3 配置pmm-agent服务
- 创建systemd服务文件:
vim /lib/systemd/system/pmm-agent.service
内容:
[Unit]
Description=pmm-agent
After=time-sync.target network.target

[Service]
Type=simple
ExecStart=/usr/local/percona/pmm2/bin/pmm-agent --config-file=/usr/local/percona/pmm2/config/pmm-agent.yaml
Restart=always
RestartSec=2s

[Install]
WantedBy=multi-user.target
- 启动并启用服务:
systemctl daemon-reload
systemctl start pmm-agent
systemctl status pmm-agent
systemctl enable pmm-agent
- 验证agent状态:
# pmm-admin status
Agent ID : /agent_id/774412ac-4712-4e99-a079-49c12e994b56
Node ID  : /node_id/479f850c-0a00-4437-a835-837c67c5c6f0
Node name: localhost

PMM Server:
	URL    : https://172.234.80.71:443/
	Version: 2.44.1

PMM Client:
	Connected        : true
	Time drift       : 52.402µs
	Latency          : 296.006µs
	Connection uptime: 100
	pmm-admin version: 2.44.1
	pmm-agent version: 2.44.1
Agents:
	/agent_id/30016c88-8745-488a-a04a-e24e9f791492 vmagent Running 42000
	/agent_id/fd70b069-cfaf-422f-be01-b2f4c7fd09e1 node_exporter Running 42001
3.4 添加MySQL服务
3.4.1 创建MySQL监控用户
CREATE USER 'pmm_monitor'@'127.0.0.1' IDENTIFIED BY 'monitor_pass' WITH MAX_USER_CONNECTIONS 10;
GRANT SELECT, PROCESS, REPLICATION CLIENT, RELOAD, BACKUP_ADMIN ON *.* TO 'pmm_monitor'@'127.0.0.1';
backup_admin 权限是在 MySQL 8.0 中引⼊的,所以对于 MySQL 8.0 之前的版本,不要授予该权限。
3.4.2 配置MySQL慢查询日志
Query Analytics 的来源有两种:慢⽇志和 performance_schema。
SET GLOBAL slow_query_log = ON;
SET GLOBAL log_output = 'FILE';
SET GLOBAL long_query_time = 1;
SET GLOBAL log_slow_admin_statements = ON;
SET GLOBAL log_slow_slave_statements = ON;
这⾥将慢⽇志的阈值定义为 1s,也可基于实际需要调整为其它值。
3.4.3 启用performance_schema
必须开启 performance_schema 相关的 instrument
UPDATE performance_schema.setup_instruments SET ENABLED='YES', TIMED='YES' WHERE NAME LIKE 'statement/%';
UPDATE performance_schema.setup_consumers SET ENABLED='YES' WHERE NAME LIKE '%statements%';
SET GLOBAL innodb_monitor_enable = all;
3.4.4 添加MySQL服务
pmm-admin add mysql \
  --query-source=slowlog \
  --username=pmm_monitor \
  --password=monitor_pass \
  node1-mysql 127.0.0.1:3306
3.4.5 验证监控数据
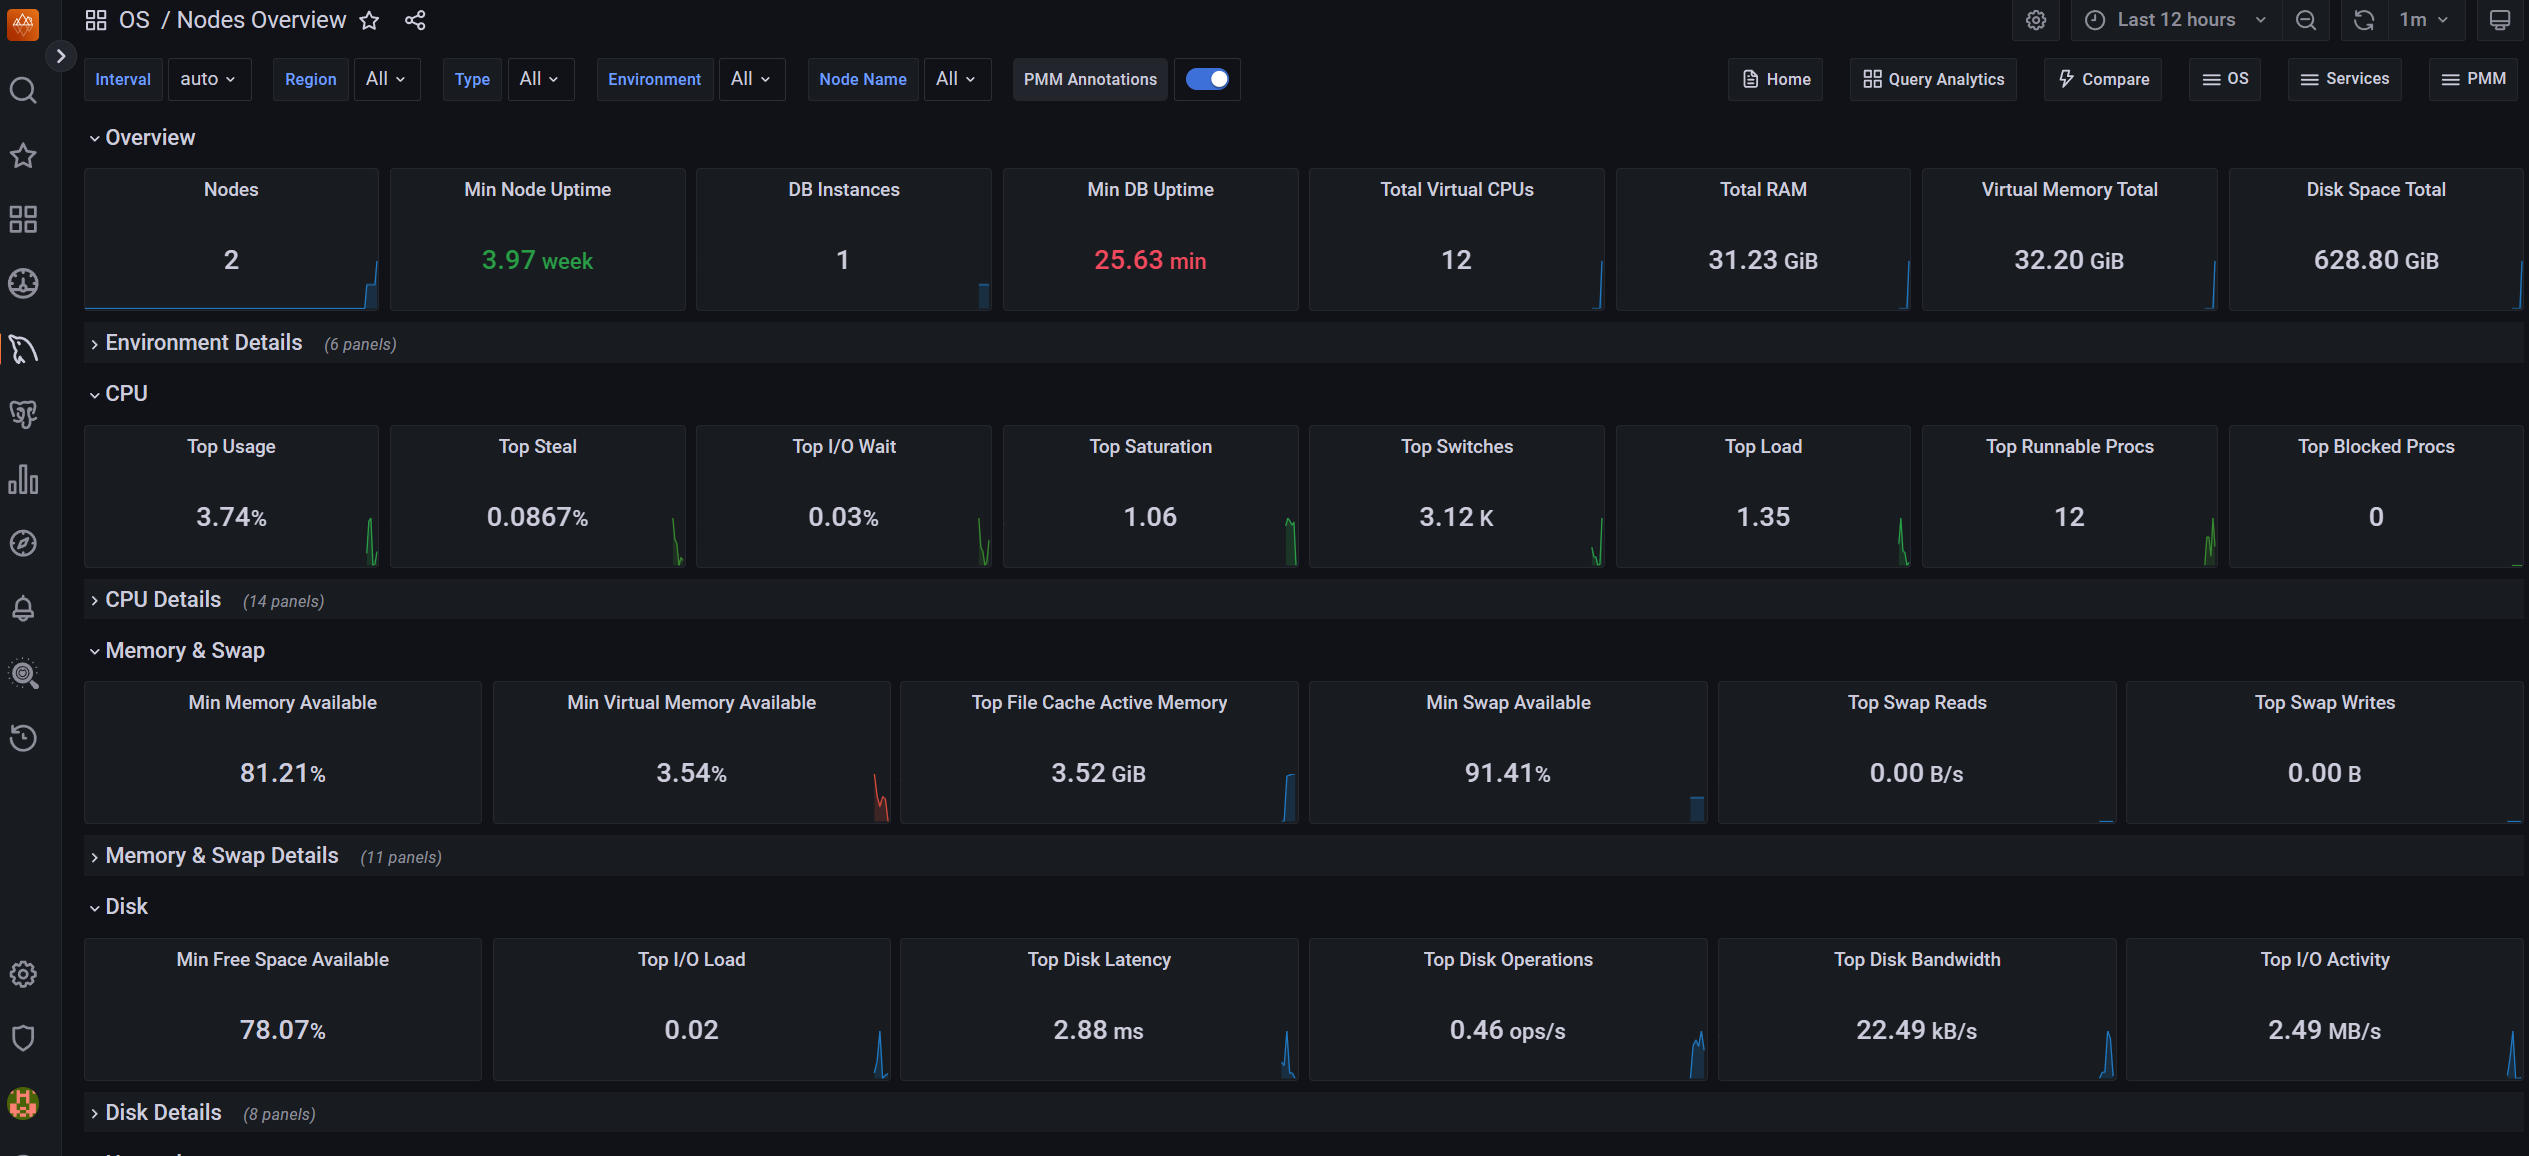
登录PMM Web界面,查看MySQL监控数据是否正常采集。
4. Zabbix 监控方案
4.1 Zabbix概述
Zabbix是一个企业级开源监控解决方案,提供网络监控、服务器监控、应用监控等功能。其主要组件包括:
- Zabbix Server:核心组件,负责接收监控数据、触发告警、持久化数据
- Zabbix Agent:部署在被监控设备上,采集监控数据
- Zabbix Proxy:替代Server接收数据,减轻Server压力
- Web界面:用于管理和维护监控配置
- 数据库:存储配置信息和监控数据(支持MySQL、PostgreSQL等)
4.2 Zabbix Server安装
4.2.1 准备工作
systemctl stop firewalld.service
systemctl disable firewalld.service
setenforce 0
sed -i "s/SELINUX=enforcing/SELINUX=disabled/g" /etc/selinux/config
4.2.2 下载并解压Zabbix
cd /usr/src/
wget https://cdn.zabbix.com/zabbix/sources/stable/6.0/zabbix-6.0.2.tar.gz
tar xvf zabbix-6.0.2.tar.gz
ln -s zabbix-6.0.2 zabbix
4.2.3 创建Zabbix用户
groupadd --system zabbix
useradd --system -g zabbix -d /usr/lib/zabbix -s /sbin/nologin -c "Zabbix Monitoring System" zabbix
4.2.4 创建Zabbix数据库
cd /usr/local/
wget https://downloads.mysql.com/archives/get/p/23/file/mysql-8.0.35-linux-glibc2.17-x86_64.tar.xz
tar xvf mysql-8.0.35-linux-glibc2.17-x86_64.tar.xz
ln -s mysql-8.0.35-linux-glibc2.17-x86_64 mysql

# 创建数据目录并初始化
mkdir -p /data/mysql/3306/data/
/usr/local/mysql/bin/mysqld --defaults-file=/etc/my.cnf --initialize-insecure
/usr/local/mysql/bin/mysqld_safe --defaults-file=/etc/my.cnf &

# 创建Zabbix数据库和用户
create database zabbix character set utf8 collate utf8_bin;
create user 'zabbix_admin'@'%' identified with mysql_native_password by 'zabbix_pass';
grant all privileges on zabbix.* to 'zabbix_admin'@'%';
4.2.5 编译安装Zabbix Server
yum install gcc mysql-devel libevent-devel libcurl-devel libxml2-devel net-snmp-devel -y

cd /usr/src/zabbix
./configure \
  --prefix=/usr/local/zabbix \
  --enable-server \
  --enable-agent \
  --with-mysql=/usr/local/mysql/bin/mysql_config \
  --enable-ipv6 \
  --with-net-snmp \
  --with-libcurl \
  --with-libxml2

make install
常见错误处理:
# 如果出现libcrypto.so.3和libssl.so.3错误
find / -name libssl.so.3
ln -s /usr/local/mysql-8.0.35-linux-glibc2.17-x86_64/lib/private/libssl.so.3 /usr/lib64
ln -s /usr/local/mysql-8.0.35-linux-glibc2.17-x86_64/lib/private/libcrypto.so.3 /usr/lib64
4.2.6 配置Zabbix Server
- 修改配置文件:
vim /usr/local/zabbix/etc/zabbix_server.conf
内容:
LogFile=/tmp/zabbix_server.log
DBHost=127.0.0.1
DBName=zabbix
DBUser=zabbix_admin
DBPassword=zabbix_pass
DBPort=3306
Timeout=4
LogSlowQueries=3000
StatsAllowedIP=127.0.0.1
- 初始化数据库:
cd /usr/src/zabbix/database/mysql/
mysql -h127.0.0.1 -uzabbix_admin -pzabbix_pass zabbix < schema.sql
mysql -h127.0.0.1 -uzabbix_admin -pzabbix_pass zabbix < images.sql
mysql -h127.0.0.1 -uzabbix_admin -pzabbix_pass zabbix < data.sql
4.2.7 配置服务管理脚本
- Zabbix Server服务脚本:
vim /usr/src/zabbix/misc/init.d/fedora/core5/zabbix_server
修改:
ZABBIX_BIN="/usr/local/zabbix/sbin/zabbix_server"
CONFIG_FILE="/usr/local/zabbix/etc/zabbix_server.conf"
- Zabbix Agent服务脚本:
vim /usr/src/zabbix/misc/init.d/fedora/core5/zabbix_agentd
修改:
ZABBIX_BIN="/usr/local/zabbix/sbin/zabbix_agentd"
CONGIG_FILE="/usr/local/zabbix/etc/zabbix_agentd.conf"
- 复制服务脚本:
cp /usr/src/zabbix/misc/init.d/fedora/core5/zabbix_server /etc/init.d/
cp /usr/src/zabbix/misc/init.d/fedora/core5/zabbix_agentd /etc/init.d/
4.2.8 启动Zabbix服务
service zabbix_server start
service zabbix_agentd start
chkconfig zabbix_server on
chkconfig zabbix_agentd on
4.2.9 安装Web组件
- 安装依赖:
rpm -Uvh https://dl.fedoraproject.org/pub/epel/epel-release-latest-7.noarch.rpm
rpm -Uvh https://mirror.webtatic.com/yum/el7/webtatic-release.rpm
yum install httpd php72w-cli php72w-common php72w-gd php72w-ldap php72w-mbstring php72w-mysqlnd php72w-xml php72w-bcmath mod_php72w-y
- 复制Web文件:
mkdir -p /var/www/html/zabbix
cp -r /usr/src/zabbix/ui/* /var/www/html/zabbix/
chown -R apache.apache /var/www/html/
- 修改PHP配置:
vim /etc/php.ini
修改:
max_execution_time = 300
max_input_time = 300
memory_limit = 128M
post_max_size = 16M
upload_max_filesize = 2M
date.timezone = Asia/Shanghai
- 启动httpd:
service httpd start
chkconfig httpd on
- 访问Web界面:
- 浏览器访问
http://<zabbix-server-ip>/zabbix - 默认用户名:Admin,密码:zabbix
- 浏览器访问
4.3 Zabbix自带MySQL监控模板
4.3.1 创建监控用户
CREATE USER 'zbx_monitor'@'%' IDENTIFIED WITH mysql_native_password BY 'zabbix_password';
GRANT REPLICATION CLIENT, PROCESS, SHOW DATABASES, SHOW VIEW ON *.* TO 'zbx_monitor'@'%';
4.3.2 创建配置文件
cd /usr/local/zabbix
vim .my.cnf
内容:
[client]
user='zbx_monitor'
password='zabbix_password'
4.3.3 配置Zabbix Agent
- 创建监控参数配置文件:
cd /usr/local/zabbix/etc/zabbix_agentd.conf.d/
vim template_db_mysql.conf
内容:
UserParameter=mysql.ping[*], HOME=/usr/local/zabbix /usr/local/mysql/bin/mysqladmin -h"$1" -P"$2" ping
UserParameter=mysql.get_status_variables[*], HOME=/usr/local/zabbix /usr/local/mysql/bin/mysql -h"$1" -P"$2" -sNX -e "show global status"
UserParameter=mysql.version[*], HOME=/usr/local/zabbix /usr/local/mysql/bin/mysqladmin -s -h"$1" -P"$2" version
UserParameter=mysql.db.discovery[*], HOME=/usr/local/zabbix /usr/local/mysql/bin/mysql -h"$1" -P"$2" -sN -e "show databases"
UserParameter=mysql.dbsize[*], HOME=/usr/local/zabbix /usr/local/mysql/bin/mysql -h"$1" -P"$2" -sN -e "SELECT COALESCE(SUM(DATA_LENGTH+ INDEX_LENGTH),0) FROM INFORMATION_SCHEMA.TABLES WHERE TABLE_SCHEMA='$3'"
UserParameter=mysql.replication.discovery[*], HOME=/usr/local/zabbix /usr/local/mysql/bin/mysql -h"$1" -P"$2" -sNX -e "show slave status"
UserParameter=mysql.slave_status[*], HOME=/usr/local/zabbix /usr/local/mysql/bin/mysql -h"$1" -P"$2" -sNX -e "show slave status"
- 修改Zabbix Agent配置:
vim /usr/local/zabbix/etc/zabbix_agentd.conf
添加:
Include=/usr/local/zabbix/etc/zabbix_agentd.conf.d/
- 重启Zabbix Agent:
service zabbix_agentd restart
4.3.4 验证监控数据
zabbix_get -s 10.0.0.20 -p 10050 -k mysql.ping[127.0.0.1,3306]
# 应返回:mysqld is alive
4.3.5 添加MySQL监控模板
- 在Zabbix Web界面:
- Configuration → Templates
- 选择"MySQL by Zabbix agent"
- 保存
- 关联模板到主机:
- Configuration → Hosts → 选择目标主机
- 在Templates选项卡中,添加"MySQL by Zabbix agent"
- 保存
- 验证数据采集:
- Monitoring → Latest data
- 查看MySQL监控数据是否正常采集
4.4 Zabbix + PMP监控MySQL
4.4.1 下载PMP监控脚本
cd /
wget https://github.com/slowtech/mysql/raw/master/第六章:监控/percona-zabbix-templates-1.1.8-1.tar.gz
tar xvf percona-zabbix-templates-1.1.8-1.tar.gz
4.4.2 创建MySQL监控用户
CREATE USER 'pmp_monitor_user'@'localhost' IDENTIFIED WITH mysql_native_password BY 'pmp_monitor_pass';
GRANT PROCESS, REPLICATION CLIENT ON *.* TO 'pmp_monitor_user'@'localhost';
4.4.3 配置监控脚本
cd /var/lib/zabbix/percona/scripts/
vim ss_get_mysql_stats.php
修改内容:
$mysql_user = 'pmp_monitor_user';
$mysql_pass = 'pmp_monitor_pass';
$mysql_port = 3306;
$mysql_socket = '/data/mysql/3306/data/mysql.sock';
4.4.4 测试监控脚本
yum install php-cli php-mysql -y
php /var/lib/zabbix/percona/scripts/ss_get_mysql_stats.php --host localhost --items iu
# 应返回:iu:1
rm -rf /tmp/localhost-mysql_cacti_stats.txt
4.4.5 拷贝监控项文件
cp /var/lib/zabbix/percona/templates/userparameter_percona_mysql.conf /usr/local/zabbix/etc/zabbix_agentd.conf.d/
4.4.6 调整脚本
vim /var/lib/zabbix/percona/scripts/get_mysql_stats_wrapper.sh
修改为:
#!/bin/bash
# This script is used to get MySQL stats for Zabbix
# The script is based on Percona's templates

# MySQL connection parameters
MYSQL_USER="pmp_monitor_user"
MYSQL_PASS="pmp_monitor_pass"
MYSQL_HOST="localhost"
MYSQL_PORT="3306"
MYSQL_SOCKET="/data/mysql/3306/data/mysql.sock"

# Path to MySQL client
MYSQL="/usr/local/mysql/bin/mysql"

# Check if we have a socket file
if [ -S "$MYSQL_SOCKET" ]; then
    MYSQL_CMD="$MYSQL -u $MYSQL_USER -p$MYSQL_PASS -h $MYSQL_HOST -P $MYSQL_PORT -S $MYSQL_SOCKET"
else
    MYSQL_CMD="$MYSQL -u $MYSQL_USER -p$MYSQL_PASS -h $MYSQL_HOST -P $MYSQL_PORT"
fi

# Execute the query
$MYSQL_CMD -e "$1" 2>/dev/null
4.4.7 配置Zabbix Agent
vim /usr/local/zabbix/etc/zabbix_agentd.conf
添加:
Include=/usr/local/zabbix/etc/zabbix_agentd.conf.d/
4.4.8 重启Zabbix Agent
service zabbix_agentd restart
4.4.9 导入PMP模板
- 下载模板:
wget https://github.com/slowtech/mysql/blob/master/第六章:监控/zbx_export_templates.xml
- 导入模板:
- Zabbix Web界面 → Configuration → Templates
- 点击"Import"按钮
- 选择下载的zbx_export_templates.xml文件
- 点击"Import"
4.4.10 关联模板
- 选择主机:
- Configuration → Hosts
- 选择目标主机
- 添加模板:
- 在Templates选项卡中,添加"Percona MySQL Server Template"
- 保存
- 验证数据采集:
- Monitoring → Latest data
- 查看MySQL监控数据是否正常采集
5. 监控方案对比与选择建议
| 监控方案 | 优点 | 缺点 | 适用场景 |
|---|---|---|---|
| Prometheus + Grafana | 实时性强,查询语言灵活,社区活跃,适合云原生环境 | 需要自行配置和维护,对MySQL监控需要额外组件 | 云原生环境,Kubernetes集群,需要高度定制化监控 |
| PMM | 专为MySQL设计,提供全面的性能分析,界面友好,包含Query Analytics | 需要额外部署PMM Server,资源占用较高 | 专注于MySQL监控,需要深度性能分析 |
| Zabbix | 功能全面,支持多种监控类型,社区支持广泛,成熟稳定 | 配置相对复杂,MySQL监控需要额外配置 | 企业级监控,需要综合监控多种服务 |
5.1 选择建议
- 小型MySQL环境:推荐使用Zabbix自带的MySQL监控模板,配置简单,维护成本低
- 中型MySQL环境:推荐使用PMM,提供更全面的MySQL监控和分析功能
- 大型云原生环境:推荐使用Prometheus + Grafana,与Kubernetes生态无缝集成,可扩展性强
5.2 高级监控策略
- 多级监控:结合使用Zabbix和Prometheus,Zabbix负责基础设施监控,Prometheus负责应用层监控
- 告警分级:设置不同级别的告警(如信息、警告、严重),避免告警疲劳
- 自动修复:结合自动化脚本,对常见问题(如主从延迟超过阈值)进行自动修复
- 性能基线:建立数据库性能基线,用于异常检测和性能优化
- 日志分析:结合日志监控,分析慢查询日志和错误日志,进行深度优化

 浙公网安备 33010602011771号