
LiveCharts文档-3开始-8自定义工具提示
LiveCharts文档-3开始-8自定义工具提示
默认每个需要tooltip或者legend的chart都会初始化一个DefaultLengend和DefaultTooltip对象。
自定义默认
你可以用下面的类来自定义一小部分,比如背景颜色,指示块尺寸方向。
cartesianChart1.Datatooltip.Bulletize = 20;
cartesianChart1.DataTooltip.Background = Brushes.Red;
你也可以设置你的tooltip的选择模式,比如,用下面的代码我们可以强制让tooltip只在鼠标悬停的时候显示。
cartesianChart1.DataTooltip.SelectionMode = LiveCharts.TooltipSelectionMode.OnlySender;
从头开始
当你需要自定义图表控件外观的时候,直接使用前面的代码就可以了,但是怎么来修改提示中的数据显示方式呢,或者在工具提示中显示额外的属性呢?
很可惜,在WinForms中没有原生的方式来显示,但鉴于LiveCharts.Winforms其实是LiveCharts.Wpf的包装器,你必须自定义一个Wpf控件来使它起作用,很简单,你不需要知道太多wpf的东西就可以让它工作。
DefaultTooltip和DefaultLengen类对所有例子都适用,如果你需要一个特定的控件,你可以很容易的自定义一个,当你创建一个自定义用户控件的时候,LiveCharts能够将用户需要的数据显示在tooltip当中,你需要根据你的需要来处理数据如何显示,如果你懂wpf,那么你可以做任何设定。
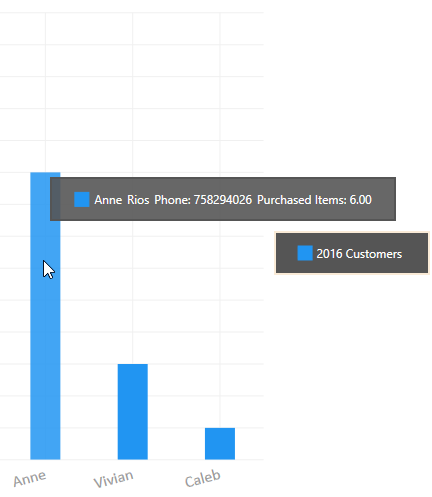
下一个例子,我们将配置图表来绘制CustomeVm类,我们将创建一个自定义的tooltip来显示更多的客户属性。
右击解决方案管理器,添加一个类,如下:
namespace Wpf.CartesianChart.CustomTooltipAndLegend
{
    public class CustomerVm
    {
        public string Name { get; set; }
        public string LastName { get; set; }
        public int Phone { get; set; }
        public int PurchasedItems { get; set; }
    }
}
现在我们就要构造自己的数据工具提示,工具提示会显示所有CustomVm属性,右键添加新的WPF用户控件,命名它为CustomerTooltip,内容如下:
<UserControl x:Class="Wpf.CartesianChart.CustomTooltipAndLegend.CustomersTooltip"
             xmlns="http://schemas.microsoft.com/winfx/2006/xaml/presentation"
             xmlns:x="http://schemas.microsoft.com/winfx/2006/xaml"
             xmlns:mc="http://schemas.openxmlformats.org/markup-compatibility/2006"
             xmlns:d="http://schemas.microsoft.com/expression/blend/2008"
             xmlns:wpf="clr-namespace:LiveCharts.Wpf;assembly=LiveCharts.Wpf"
             xmlns:local="clr-namespace:Wpf.CartesianChart.CustomTooltipAndLegend"
             mc:Ignorable="d"
             d:DesignHeight="300" d:DesignWidth="300"
             d:DataContext="{d:DesignInstance local:CustomersTooltip}"
             Background="#E4555555" Padding="20 10" BorderThickness="2" BorderBrush="#555555">
    <ItemsControl ItemsSource="{Binding Data.Points}" Grid.IsSharedSizeScope="True">
        <ItemsControl.ItemTemplate>
            <DataTemplate DataType="{x:Type wpf:DataPointViewModel}">
                <Grid Margin="2">
                    <Grid.ColumnDefinitions>
                        <ColumnDefinition Width="Auto"/>
                        <ColumnDefinition Width="Auto" SharedSizeGroup="Title"/>
                        <ColumnDefinition Width="Auto" SharedSizeGroup="LastName"/>
                        <ColumnDefinition Width="Auto" SharedSizeGroup="Phone"/>
                        <ColumnDefinition Width="Auto" SharedSizeGroup="PurchasedItems"/>
                    </Grid.ColumnDefinitions>
                    <Rectangle Grid.Column="0" Stroke="{Binding Series.Stroke}" Fill="{Binding Series.Fill}"
                               Height="15" Width="15"></Rectangle>
                    <TextBlock Grid.Column="1" Text="{Binding ChartPoint.Instance.(local:CustomerVm.Name)}"
                               Margin="5 0 0 0" VerticalAlignment="Center" Foreground="White"/>
                    <TextBlock Grid.Column="2" Text="{Binding ChartPoint.Instance.(local:CustomerVm.LastName)}"
                               Margin="5 0 0 0" VerticalAlignment="Center" Foreground="White"/>
                    <TextBlock Grid.Column="3" Text="{Binding ChartPoint.Instance.(local:CustomerVm.Phone),
                                                        StringFormat=Phone: {0}}"
                               Margin="5 0 0 0" VerticalAlignment="Center" Foreground="White"/>
                    <TextBlock Grid.Column="4" Text="{Binding ChartPoint.Instance.(local:CustomerVm.PurchasedItems),
                                                                StringFormat=Purchased Items: {0:N}}"
                               Margin="5 0 0 0" VerticalAlignment="Center" Foreground="White"/>
                </Grid>
            </DataTemplate>
        </ItemsControl.ItemTemplate>
    </ItemsControl>
</UserControl>
后台代码如下:
using System.ComponentModel;
using LiveCharts;
using LiveCharts.Wpf;
namespace Wpf.CartesianChart.CustomTooltipAndLegend
{
    public partial class CustomersTooltip : IChartTooltip
    {
        private TooltipData _data;
        public CustomersTooltip()
        {
            InitializeComponent();
            //LiveCharts will inject the tooltip data in the Data property
            //your job is only to display this data as required
            DataContext = this;
        }
        public event PropertyChangedEventHandler PropertyChanged;
        public TooltipData Data
        {
            get { return _data; }
            set
            {
                _data = value;
                OnPropertyChanged("Data");
            }
        }
        public TooltipSelectionMode? SelectionMode { get; set; }
        protected virtual void OnPropertyChanged(string propertyName = null)
        {
            if (PropertyChanged != null)
                PropertyChanged.Invoke(this, new PropertyChangedEventArgs(propertyName));
        }
    }
}
最重要的是,自定义的CustomersTooltip实现了IChartTooltip接口,这个接口需要我们的用户控件实现INotifyPropertyChanged以及一个新的属性数据类型TooltipData,
LiveCharts将会注入所有它知道的当前点并显示在tooltip中,你的任务就是显示你需要的数据。
注意到我们在用户控件中使用了一个DataContext属性,并绑定Data.Points属性到我们的项目控件中来显示当前我们需要的点。添加一个自定义用户控件,命名为CustomersLegend,道理是一样的,你需要实现IChartLegend接口来处理被Livecharts注入的数据。
我们再来创建一个自定义的Legend,用自定义样式,
<UserControl x:Class="Wpf.CartesianChart.CustomTooltipAndLegend.CustomersLegend"
             xmlns="http://schemas.microsoft.com/winfx/2006/xaml/presentation"
             xmlns:x="http://schemas.microsoft.com/winfx/2006/xaml"
             xmlns:mc="http://schemas.openxmlformats.org/markup-compatibility/2006"
             xmlns:d="http://schemas.microsoft.com/expression/blend/2008"
             xmlns:local="clr-namespace:Wpf.CartesianChart.CustomTooltipAndLegend"
             xmlns:lvc="clr-namespace:LiveCharts.Wpf;assembly=LiveCharts.Wpf"
             mc:Ignorable="d"
             Background="#555555" BorderThickness="2" Padding="20 10" BorderBrush="AntiqueWhite"
             d:DataContext="{d:DesignInstance local:CustomersLegend}">
    <ItemsControl ItemsSource="{Binding Series}" Grid.IsSharedSizeScope="True">
        <ItemsControl.ItemTemplate>
            <DataTemplate DataType="{x:Type lvc:SeriesViewModel}">
                <Grid Margin="2">
                    <Grid.ColumnDefinitions>
                        <ColumnDefinition Width="Auto"/>
                        <ColumnDefinition Width="Auto" SharedSizeGroup="Title"/>
                    </Grid.ColumnDefinitions>
                    <Rectangle Grid.Column="0" Stroke="{Binding Stroke}" Fill="{Binding Fill}"
                               Width="15" Height="15"/>
                    <TextBlock Grid.Column="1" Margin="4 0" Text="{Binding Title}" Foreground="White" VerticalAlignment="Center" />
                </Grid>
            </DataTemplate>
        </ItemsControl.ItemTemplate>
    </ItemsControl>
</UserControl>
using System.Collections.Generic;
using System.ComponentModel;
using System.Windows.Controls;
using LiveCharts.Wpf;

namespace Wpf.CartesianChart.CustomTooltipAndLegend
{
    public partial class CustomersLegend : UserControl, IChartLegend
    {
        private List<SeriesViewModel> _series;

        public CustomersLegend()
        {
            InitializeComponent();

            DataContext = this;
        }

        public List<SeriesViewModel> Series
        {
            get { return _series; }
            set
            {
                _series = value;
                OnPropertyChanged("Series");
            }
        }

        public event PropertyChangedEventHandler PropertyChanged;

        protected virtual void OnPropertyChanged(string propertyName = null)
        {
            if (PropertyChanged != null)
                PropertyChanged.Invoke(this, new PropertyChangedEventArgs(propertyName));
        }
    }
}
最后把自定的控件设定到我们的图表上就可以了。
cartesianChart1.ChartLegend = new CustomersLegend();
cartesianChart1.DataTooltip = new CustomersTooltip();

 浙公网安备 33010602011771号