<script src="https://gallerybox.echartsjs.com/dep/echarts/latest/echarts.min.js"></script>
<div id="main" ref="main" style="height:600px;"></div>
var myChart = echarts.init(document.getElementById("main"));
var option = {
color: ['#007AFF', '#5756D6'],
grid: {
x: '0',
y: '0',
width: '100%',
height: '100%'
},
xAxis: [{
type: 'category',
show: false,
splitLine: {
show: false
},
boundaryGap: false,
axisLine: {
show: true,
lineStyle: {
color: '#DCDCDC'
}
},
axisTick: {
show: false
},
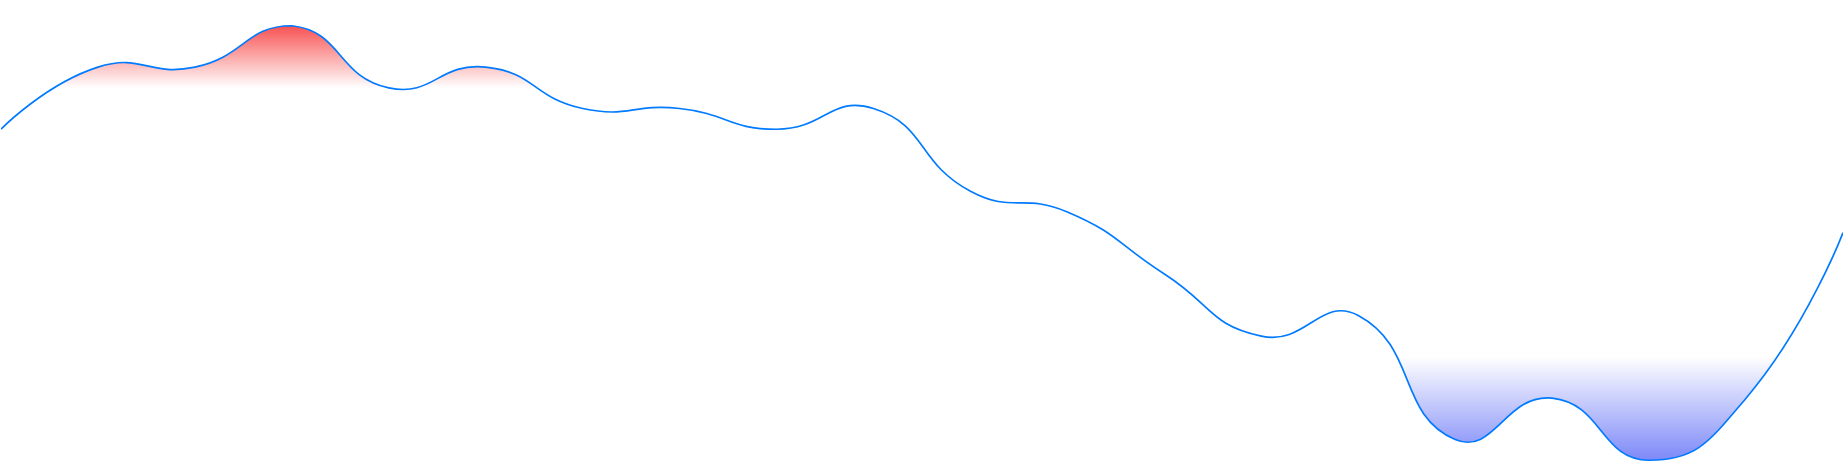
data: [
'20190723',
'20190724',
'20190725',
'20190726',
'20190729',
'20190730',
'20190731',
'20190801',
'20190802',
'20190805',
'20190806',
'20190807',
'20190808',
'20190809',
'20190812',
'20190813',
'20190814',
'20190815',
'20190816',
'20190819'
],
axisLabel: {
color: '#B3B3B3',
fontSize: 33.12
}
}],
yAxis: [{
type: 'value',
z: 3,
max: 3.69,
min: 3.4,
scale: true,
show: false
}],
series: [{
type: 'line',
lineStyle: {
width: 1.6560000000000001
},
showSymbol: false,
animation: false,
smooth: true,
data: [
'3.6000',
'3.6300',
'3.6300',
'3.6500',
'3.6200',
'3.6300',
'3.6100',
'3.6100',
'3.6000',
'3.6100',
'3.5700',
'3.5600',
'3.5300',
'3.5000',
'3.5100',
'3.4500',
'3.4700',
'3.4400',
'3.4700',
'3.5500'
],
areaStyle: {
origin: 'start',
color: {
type: 'linear',
x: 0,
y: 0,
x2: 0,
y2: 1,
colorStops: [{
offset: 0,
color: '#f50909'
},
{
offset: 0.11999999999999922,
color: '#fff'
},
{
offset: 0.11999999999999922,
color: 'transparent'
}
]
}
}
},
{
type: 'line',
lineStyle: {
width: 0
},
showSymbol: false,
animation: false,
smooth: true,
data: [
'3.6000',
'3.6300',
'3.6300',
'3.6500',
'3.6200',
'3.6300',
'3.6100',
'3.6100',
'3.6000',
'3.6100',
'3.5700',
'3.5600',
'3.5300',
'3.5000',
'3.5100',
'3.4500',
'3.4700',
'3.4400',
'3.4700',
'3.5500'
],
areaStyle: {
origin: 'end',
color: {
type: 'linear',
x: 0,
y: 0,
x2: 0,
y2: 1,
colorStops: [{
offset: 0.8,
color: 'transparent'
},
{
offset: 0.8,
color: '#fff'
},
{
offset: 1,
color: '#4657f5'
}
]
}
}
}
]
};
myChart.setOption(option);

 浙公网安备 33010602011771号