

ELK分布式日志系统的搭建
前言
ELK即分别为ElasticSearch、Logstash(收集、分析、过滤日志的工具)、Kibana(es的可视化工具),其主要工作原理就是由不同机器上的logstash收集日志后发送给es,然后由kibana展示
ElasticSeach
详情可参考ElasticSearch、ElasticSearch-head的安装和问题解决 一文
Logstash
安装
官网下载:https://www.elastic.co/cn/downloads/logstash
百度云下载:
链接:https://pan.baidu.com/s/1Ev1WZokXKFbmVLPTWD98kw
提取码:vxt9
linux:
wget https://artifacts.elastic.co/downloads/logstash/logstash-6.2.3.tar.gz
tar -zxvf logstash-6.2.3.tar.gz
cd logstash-6.2.3
简易使用
./bin/logstash -e 'input{stdin{}}output{stdout{codec=>rubydebug}}' 其中 stdin{} 表示从标准输入输入信息; -e 表示从命令行指定配置;然后 codec=>rubydebug 表示把结果输出到控制台。
./bin/logstash -e 'input { stdin{} } output { stdout{} }' 标准的输入输出,logstash最基本的工作模式,你输入什么,logstash就输出什么
另外,由于Logstash占用内存较大,默认堆内存为1G,因此内存不足的情况下会很卡
Filebeat
轻量级的日志传输工具,适用于没有java环境的服务器上,收集日志后发送给logstash、elasticsearch,缓冲redis、kafka
安装
官网下载:https://www.elastic.co/cn/downloads/beats/filebeat
linux下载:
wget https://artifacts.elastic.co/downloads/beats/filebeat/filebeat-7.6.1-linux-x86_64.tar.gz
tar -zxvf filebeat-7.6.1-linux-x86_64
mv filebeat-7.6.1-linux-x86_64  filebeat-7.6.1
cd filebeat-7.6.1
修改filebeat.yml文件
filebeat.inputs:

# Each - is an input. Most options can be set at the input level, so
# you can use different inputs for various configurations.
# Below are the input specific configurations.

- type: log

  # Change to true to enable this input configuration.
  enabled: true

  # Paths that should be crawled and fetched. Glob based paths.
  paths:
    - /var/log/*.log
    #- c:\programdata\elasticsearch\logs\*
------------------------------------------------------------
#output.elasticsearch:
# Array of hosts to connect to.
#hosts: ["localhost:9200"]
# Protocol - either `http` (default) or `https`.
#protocol: "https"
# Authentication credentials - either API key or username/password.
#api_key: "id:api_key"
#username: "elastic"
#password: "changeme"
#----------------------------- Logstash output --------------------------------
output.logstash:
# The Logstash hosts
hosts: ["192.168.184.131:5044"]
注意:logstash和elasticsearch只能设置一个,否则会报输出不唯一的错误,要先启动logstash再启动filebeat
logstash输出日志到es配置
新建文件vim logfile.conf
input {
file {
path => "/var/log/*.log" //表示扫描目录下的所有以.log结尾的文件并将扫描结果发送给es
type => "ws-log"
start_position => "beginning"
}
}
output {
elasticsearch {
hosts => ["192.168.184.131:9200"]
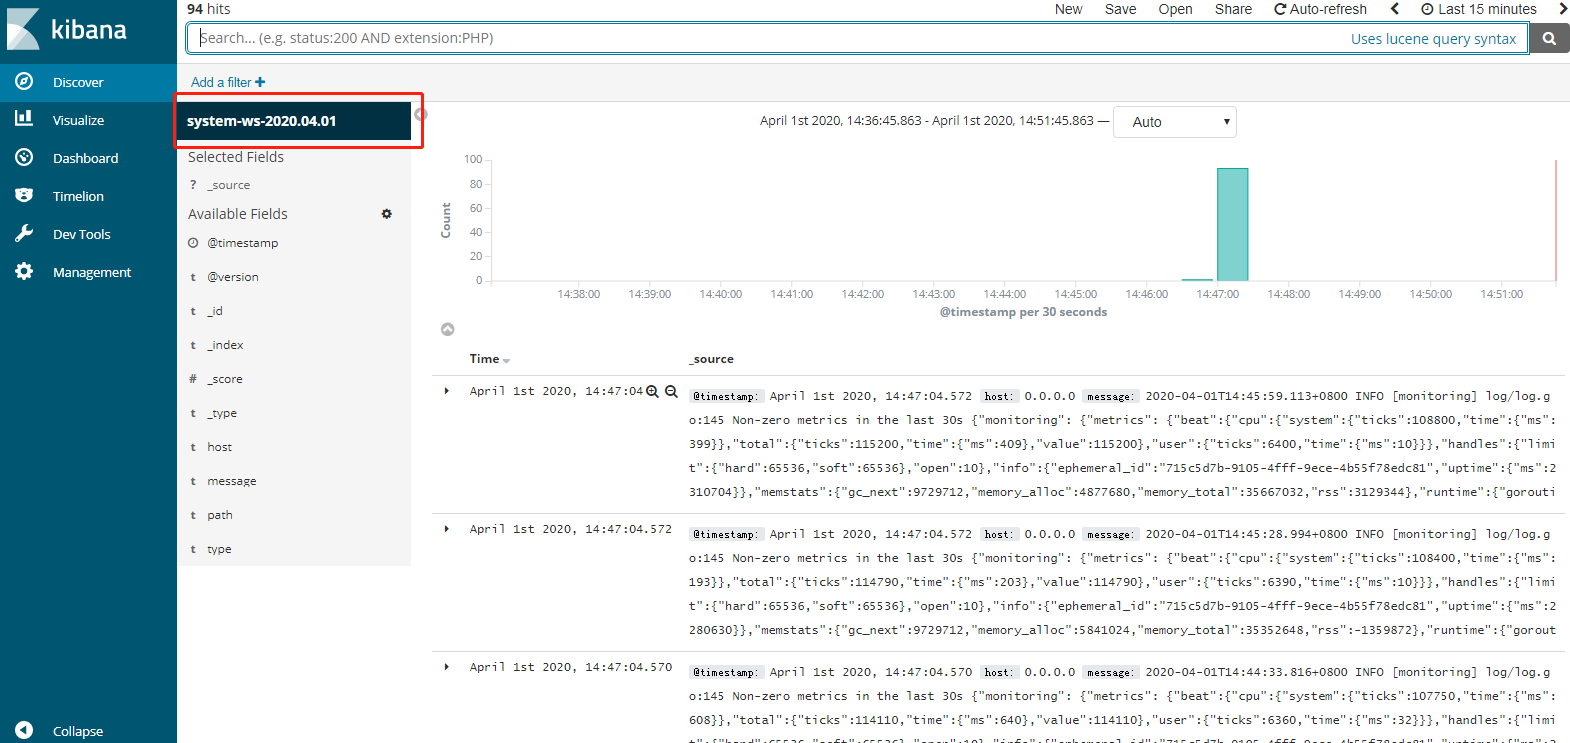
index => "system-ws-%{+YYYY.MM.dd}" //索引名为system-ws-%{+YYYY.MM.dd}
}
}
此时可以通过以下命令检测配置文件是否有误
../bin/logstash -f logfile.conf --config.test_and_exit(当前目录为logstash-6.2.3/config)
将logstash和filebeat都启动
../bin/logstash -f logfile.conf(当前目录为logstash-6.2.3/config)
./filebeat -e -c filebeat.yml -d "public" (当前目录为filebeat-7.6.1)
如果想要后台启动则可以使用
nohup ../bin/logstash -f logfile.conf &  启动日志存储在当前目录的nohup.log文件中
或
nohup ../bin/logstash -f logfile.conf >logstash.log &  指定日志存储文件和位置
或
使用脚本文件启动
vim startup.sh
#!/bin/bash
nohup ../bin/logstash -f logfile.conf &
编写完成以后修改文件的执行权限 chmod -R 775 startup.sh
使用./startup.sh执行脚本(在startup.sh文件的目录下)
filebeat同理
Kibana
安装
wget https://artifacts.elastic.co/downloads/kibana/kibana-6.2.4-linux-x86_64.tar.gz (最好与elasticsearch的版本保持一致)
tar -zxvf kibana-6.2.4-linux-x86_64.tar.gz
mv kibana-6.2.4-linux-x86_64 kibana-6.2.4
cd kibana-6.2.4
修改kibana.yml
server.port: 5601

server.host: "192.168.184.131"

elasticsearch.url: "http://192.168.184.131:9200"

kibana.index: ".kibana"
启动kibana ./kibana(在kibana的bin目录下)
后台启动可参考Logstash启动方式
最后当配置无误,启动成功后,会有这样的效果
参考文章:

 浙公网安备 33010602011771号