
python 使用 xlwt..xlsxwriter
 1 import xlrd, xlwt
 2
 3 #读取excel文件
 4 def read_excel(url):#传入源文件读取路径
 5     # 获取数据
 6     data = xlrd.open_workbook(url)
 7     # 获取sheet
 8     # table = data.sheet_by_name(sheet_name) #通过sheet名称获取sheet数据
 9     table = data.sheet_by_index(0) #通过sheet索引获取sheet数据
10     # 获取总行数
11     nrows = table.nrows
12     # 获取总列数
13     ncols = table.ncols
14     # 获取一个单元格的数值
15     cell_value = table.cell(0, 1).value #获取第0行第1列的值,即 B1 的值
16     print(cell_value)
17
18 #写入excel文件
19 def write_excel(url, sheet_name, data): #传入文件存储路径、excel的sheet名称、以及要插入的数据
20     #data = (('biqi', 963, 177), ('editor_Intern1', 912, 154), ('editor_Intern10', 840, 163), ('editor_Intern11', 644, 173)) #模板数据
21     myWorkbook = xlwt.Workbook() #创建excel
22     mySheet = myWorkbook.add_sheet(sheet_name) #创建excel中的sheet
23     for i, val in enumerate(data):
24         for j, value in enumerate(val):
25             mySheet.write(i, j, value) #遍历数据插入sheet中
26     myWorkbook.save(url) #将创建的excel保存在该路径下

  1 import xlsxwriter
  2
  3 #写入excel文件
  4 def write_excel(url): #传入excel存储路径
  5     #将要插入excel并用作绘图的数据
  6     data_all = {'错误汇总': {
  7         'error_summary_header': ['账号', '姓名', '投资评级错误', '评级变化错误', '股票代码错误', '股票名称错误', '目标价错误', '目标价高错误', '净利润错误',
  8                                  '归母净利润错误', '年份错误', '分析师名字错误', '邮箱错误', '证券职业编码错误', '电话错误', '记录错误数', '错误数(人工)',
  9                                  '错误数(研报本身)', '错误数(抽查)', '总记录数', '错误率', '研报总数'],
 10         'editor_Intern1': ['editor_Intern1', 'editor_Intern1', 0, 0, 0, 0, 0, 0, 0, 2, 0, 0, 0, 0, 0, 2, 0, 0, 0, 912, '0.22%',
 11                            223],
 12         'editor_Intern10': ['editor_Intern10', 'editor_Intern10', 0, 0, 0, 0, 0, 0, 0, 0, 0, 0, 1, 0, 0, 1, 0, 0, 0, 837, '0.12%',
 13                             232],
 14         'editor_Intern11': ['editor_Intern11', 'editor_Intern11', 0, 0, 0, 0, 0, 0, 0, 0, 0, 0, 1, 0, 0, 1, 0, 0, 0, 644, '0.16%',
 15                             173],
 16         'editor_Intern12': ['editor_Intern12', 'editor_Intern12', 0, 0, 0, 0, 0, 0, 0, 1, 0, 0, 0, 0, 0, 1, 0, 0, 0, 439, '0.23%',
 17                             99],
 18         'editor_Intern2': ['editor_Intern2', 'editor_Intern2', 0, 0, 0, 0, 0, 0, 0, 0, 0, 0, 0, 0, 0, 0, 0, 0, 0, 1132, '0.0%',
 19                            265],
 20         'editor_Intern3': ['editor_Intern3', 'editor_Intern3', 0, 0, 0, 0, 0, 0, 0, 0, 0, 0, 0, 0, 0, 0, 0, 0, 0, 852, '0.0%', 280],
 21         'editor_Intern4': ['editor_Intern4', 'editor_Intern4', 0, 0, 0, 0, 0, 0, 7, 0, 0, 0, 0, 0, 0, 7, 0, 0, 0, 1002, '0.7%',
 22                            297],
 23         'editor_Intern5': ['editor_Intern5', 'editor_Intern5', 0, 0, 0, 0, 0, 0, 0, 0, 0, 0, 0, 0, 0, 0, 0, 0, 0, 571, '0.0%',
 24                            213],
 25         'editor_Intern6': ['editor_Intern6', 'editor_Intern6', 0, 0, 0, 0, 0, 0, 0, 0, 0, 0, 0, 0, 0, 0, 0, 0, 0, 778, '0.0%',
 26                            200],
 27         'editor_Intern8': ['editor_Intern8', 'editor_Intern8', 0, 0, 0, 0, 0, 0, 0, 0, 0, 0, 0, 0, 0, 0, 0, 0, 0, 0, 0, 0],
 28         'editor_Intern9': ['editor_Intern9', 'editor_Intern9', 0, 0, 0, 0, 0, 0, 5, 0, 0, 0, 0, 0, 0, 5, 0, 0, 0, 762, '0.66%', -3],
 29         'editor_Intern13': ['editor_Intern13', 'editor_Intern13', 0, 0, 0, 0, 0, 0, 0, 0, 0, 0, 0, 0, 0, 0, 0, 0, 0, 729, '0.0%',
 30                             180],
 31         'editor_Intern14': ['editor_Intern14', 'editor_Intern14', 0, 0, 0, 0, 0, 0, 0, 0, 8, 0, 2, 0, 0, 10, 0, 0, 0, 467, '2.14%',
 32                             102],
 33         'Total': ['Total', '合计', 0, 0, 0, 0, 0, 0, 12, 3, 9, 0, 4, 0, 0, 28, 0, 0, 0, 10102, '0.28%', 2595]}}
 34     # 数据表头
 35     error_detail_header = ['研报_id', '账号', '投资评级错误', '评级变化错误', '股票代码错误', '股票名称错误', '目标价错误', '目标价高错误', '净利润错误', '归母净利润错误',
 36                            '年份错误', '分析师名字错误', '邮箱错误', '证券职业编码错误', '电话错误']
 37     #创建excel
 38     myWorkbook = xlsxwriter.Workbook(url)
 39     # 自定义样式
 40     bold = myWorkbook.add_format({
 41         'font_size': 10,  # 字体大小
 42         'bold': True,  # 是否粗体
 43         'bg_color': '#101010',  # 表格背景颜色
 44         'font_color': '#FEFEFE',  # 字体颜色
 45         'align': 'center',  # 居中对齐
 46         'top': 2,  # 上边框
 47         'left': 2,  # 左边框
 48         'right': 2,  # 右边框
 49         'bottom': 2  # 底边框
 50     })
 51     for k, v in data_all.items():
 52         if k == '错误明细':
 53             mySheet1 = myWorkbook.add_worksheet(k) #创建“错误明细”sheet
 54             for index, header in enumerate(error_detail_header):
 55                 mySheet1.write(0, index, header, bold)
 56             for i, val in enumerate(v):
 57                 i += 1
 58                 for j, value in enumerate(val):
 59                     mySheet1.write(i, j, value, bold) #向第i行第j列插入数据,并使用bold定义的样式
 60         if k == '错误汇总':
 61             mySheet2 = myWorkbook.add_worksheet(k)
 62             i = 0
 63             for summary_value in v.values():
 64                 for sum_index, sum_value in enumerate(summary_value):
 65                     mySheet2.write(i, sum_index, sum_value, bold)
 66                 i += 1
 67
 68     '''绘制错误数柱状图'''
 69     # 创建一个柱状图(column chart)
 70     chart_col = myWorkbook.add_chart({'type': 'column'})
 71
 72     # 图表下方显示数据表格
 73     chart_col.set_table({
 74         'show_keys': True
 75     })
 76
 77     # 配置数据(用了另一种语法)
 78     chart_col.add_series({
 79         'name': '=错误汇总!$P$1',
 80         'categories': '=错误汇总!$B$2:$B$14',
 81         'values': '=错误汇总!$P$2:$P$14',
 82         'line': {'color': '#C0504D'},
 83         'fill': {'color': '#C0504D'},
 84         'data_labels': {'value': True}, #在图表上显示对应的数据
 85     })
 86
 87     # # 配置数据
 88     # chart_col.add_series({
 89     #     'name': ['错误汇总', 0, 2],
 90     #     'categories': ['错误汇总', 1, 0, 6, 0],
 91     #     'values': ['错误汇总', 1, 2, 6, 2],
 92     #     'line': {'color': 'red'},
 93     # })
 94
 95     # 设置图表的title 和 x,y轴信息
 96     chart_col.set_title({'name': '记录错误数'})
 97     chart_col.set_x_axis({'name': '员工'})
 98     chart_col.set_y_axis({'name': '错误数'})
 99
100     # 设置图表的风格
101     chart_col.set_style(10)
102
103     # 把图表插入到worksheet以及偏移
104     mySheet2.insert_chart('A21', chart_col, {
105         'x_offset': 0,
106         'y_offset': 0,
107         'x_scale':  1.5,
108         'y_scale':  1.5,
109     }) #第一个参数为图表插入的起始位置, x_offset、y_offset为偏移量, x_scale、y_scale为缩放比率
110
111     '''绘制错误率折线图'''
112     chart_col1 = myWorkbook.add_chart({'type': 'line'})
113     # 配置数据(用了另一种语法)
114     chart_col1.add_series({
115         'name': '=错误汇总!$U$1',
116         'categories': '=错误汇总!$B$2:$B$14',
117         'values': '=错误汇总!$U$2:$U$14',
118         'line': {'color': '#C0504D'},
119         'data_labels': {'value': True},
120     })
121
122     # # 配置数据
123     # chart_col1.add_series({
124     #     'name': ['错误汇总', 0, 2],
125     #     'categories': ['错误汇总', 1, 0, 6, 0],
126     #     'values': ['错误汇总', 1, 2, 6, 2],
127     #     'line': {'color': 'red'},
128     # })
129
130     # 设置图表的title 和 x,y轴信息
131     chart_col1.set_title({'name': '错误率'})
132     chart_col1.set_x_axis({'name': '员工'})
133     chart_col1.set_y_axis({'name': '错误数'})
134
135     # 设置图表的风格
136     chart_col1.set_style(1)
137
138     # 将柱状图合并入折线图中
139     # chart_col1.combine(chart_col)
140
141     mySheet2.insert_chart('N21', chart_col1, {
142         'x_offset': 0,
143         'y_offset': 0,
144         'x_scale': 1.5,
145         'y_scale': 1.5,
146     }) #第一个参数为图表插入的起始位置, x_offset、y_offset为偏移量, x_scale、y_scale为缩放比率
147
148     '''绘制错误种类饼图'''
149     # 创建一个柱状图(column chart)
150     chart_col2 = myWorkbook.add_chart({'type': 'pie'})
151     # 配置数据(用了另一种语法)
152     chart_col2.add_series({
153         'categories': '=错误汇总!$C$1:$O$1',
154         'values': '=错误汇总!$C$15:$O$15',
155         'data_labels': {'value': True},
156         'points': [
157             {'fill': {'color': '#4590A7'}},
158             {'fill': {'color': '#AA4643'}},
159             {'fill': {'color': '#89A54E'}},
160             {'fill': {'color': '#71588F'}},
161             {'fill': {'color': '#4198AF'}},
162             {'fill': {'color': '#DB843D'}},
163             {'fill': {'color': '#93A9CF'}},
164             {'fill': {'color': '#D19392'}},
165             {'fill': {'color': '#B9CD96'}},
166             {'fill': {'color': '#4590A7'}},
167             {'fill': {'color': '#AA4643'}},
168             {'fill': {'color': '#89A54E'}},
169             {'fill': {'color': '#71588F'}},
170             {'fill': {'color': '#4198AF'}},
171             {'fill': {'color': '#DB843D'}},
172             {'fill': {'color': '#93A9CF'}},
173             {'fill': {'color': '#D19392'}},
174             {'fill': {'color': '#B9CD96'}},
175         ] #饼状图会使用到的色号
176     })
177
178     # # 配置数据
179     # chart_col.add_series({
180     #     'name': ['错误汇总', 0, 2],
181     #     'categories': ['错误汇总', 1, 0, 6, 0],
182     #     'values': ['错误汇总', 1, 2, 6, 2],
183     #     'line': {'color': 'red'},
184     # })
185
186     # 设置图表的title
187     chart_col2.set_title({'name': '错误种类占比'})
188
189     # 设置图表的风格
190     chart_col2.set_style(1)
191
192     # 把图表插入到worksheet以及偏移
193     mySheet2.insert_chart('H45', chart_col2, {
194         'x_offset': 0,
195         'y_offset': 0,
196         'x_scale': 1.5,
197         'y_scale': 1.5,
198     }) #第一个参数为图表插入的起始位置, x_offset、y_offset为偏移量, x_scale、y_scale为缩放比率
199
200     myWorkbook.close()
201
202 if __name__ == '__main__':
203     write_excel('./datasource/test_query_bak.xls')
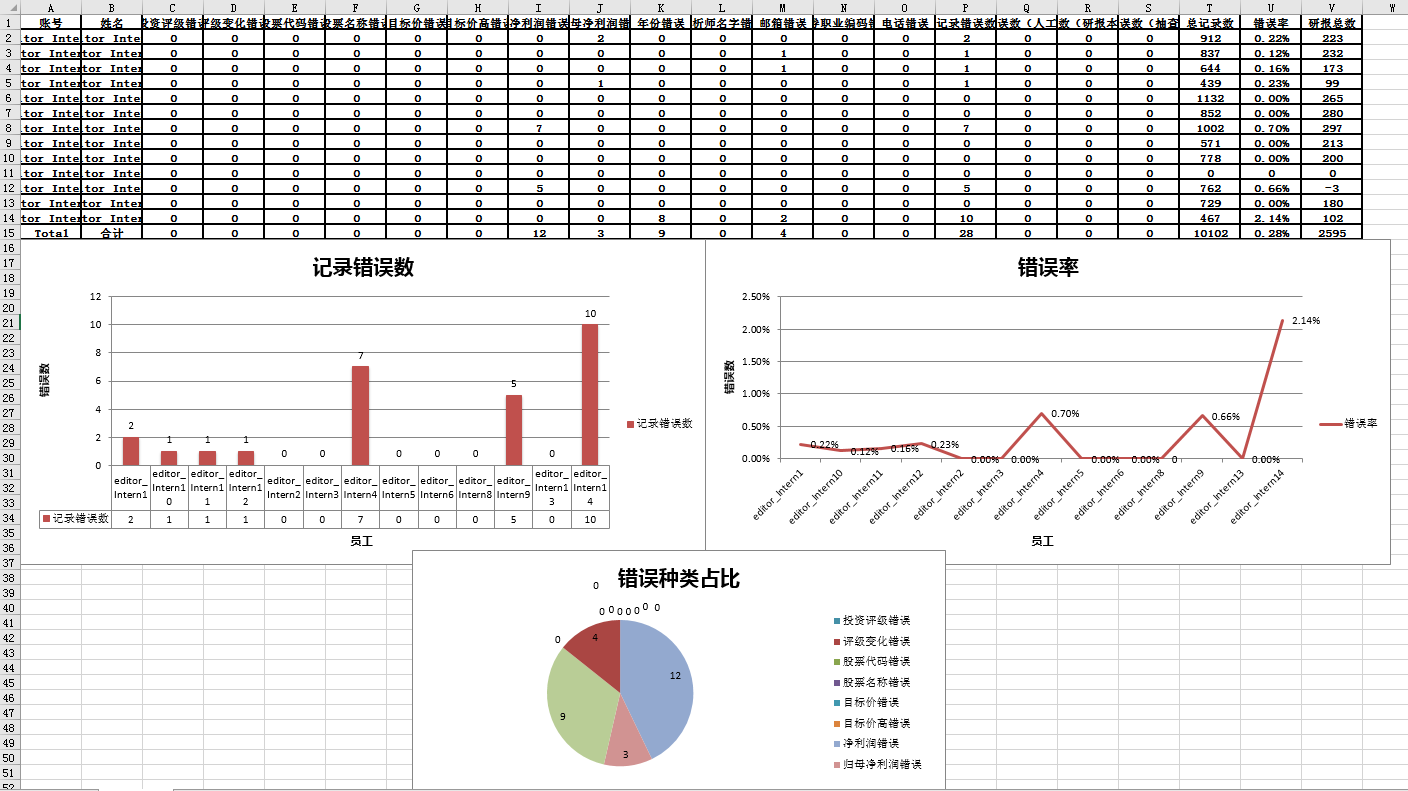
总体来说,如果只需要从excel读取数据及向excel中插入数据,用xlrd包及xlwt包就可以很好的解决了;但如果想要在excel中绘制各种报表图片就需要借助xlsxwriter包来进行了(xlsxwriter官网:http://xlsxwriter.readthedocs.io/chart.html)
附上xlsxwriter绘制的图表的截图
本文来自博客园,作者:南鱼羁荒渡,转载请注明原文链接:https://www.cnblogs.com/nanyu/articles/9796415.html

 浙公网安备 33010602011771号