
python画连续变量柱状图
弗里德曼-迪亚科尼斯规则
在统计学中,Freedman-Diaconis规则用于确定直方图中的条柱宽度, 它以David A.Freedman和Persi Diaconis的名字命名。该规则定义:
\[条柱宽度 = 2 \times \frac{IQR}{\sqrt[3]{n}}
\]
其中,IQR是四分位距,n是观测样本数目。
import numpy as np
import pandas as pd
import seaborn as sns
from matplotlib import pyplot as plt
plt.rcParams["font.sans-serif"] = ["SimHei"]
# 1. 导入数据
file_path = r"../../机器学习数据/data_train.csv"
df = pd.read_csv(file_path, encoding='gbk')
# 2. 查看数据
# print(df.head())
# print(df.columns)
# print(df.info)
# print(df.isnull().sum()) # 检查空值
std = df["房价"].describe()
def freedman_diaconis(x):
"""
:param x: 输入数据
:return num_bin: 条柱数目
"""
static = x.describe()
IQR = static["75%"] - static["25%"]
bin_width = (2 * IQR) / np.power(x.shape[0], 1 / 3)
x_max, x_min = static["max"], static["min"]
num_bin = int(((x_max - x_min) / bin_width) + 1)
return num_bin
bins = freedman_diaconis(df["房价"]) # 箱子数目
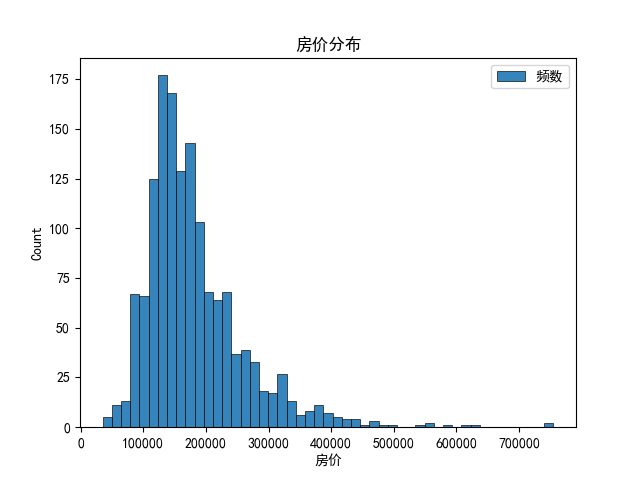
plt.figure()
plt.hist(df["房价"], bins=bins, edgecolor="black", linewidth=0.5, alpha=0.9)
plt.title("房价分布")
plt.xlabel("房价")
plt.ylabel("Count")
plt.legend({"频数"})
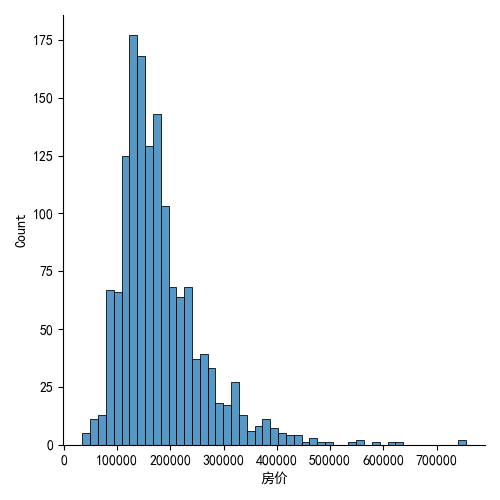
sns.displot(df["房价"])
plt.show()
模仿:
sns.displot():

 浙公网安备 33010602011771号