当 dotnet-monitor 遇上 Prometheus, 是种什么样的体验?

对于开发和运维人员来说, 监控大屏很棒, 让我们来做一个 Dashboard 吧! 大家可能听说过一些 CLI 诊断工具, 比如 dotnet-counters,dotnet-dump 和 dotnet-trace, 那 dotnet-monitor 又是什么呢?简单理解就是把上面的几种诊断工具进行了包装, 并且暴露了 对应的 REST API, 让诊断变的更容易, 在去年, dotnet-monitor 还是一个实验性的诊断工具, 当时我也写了一篇文章介绍 dotnet-monitor, 使用 dotnet-monitor 分析.NET 应用程序, 而最近, .NET 团队宣布第一个 release 版本的 dotnet-monitor, 同时它也是 .NET 6 的内容 😍, 也就是 dotnet-monitor 6.0.0 !
今天我们关注的主要是指标, 也就是 /metrics 端点, 正如文档所说,它是按照 Prometheus 的格式显示当前dotnet程序的 metrics 快照, 顺便说一句,这是非常简单的格式,如下:
# HELP systemruntime_cpu_usage_ratio CPU Usage
# TYPE systemruntime_cpu_usage_ratio gauge
systemruntime_cpu_usage_ratio 0 1632929076109
systemruntime_cpu_usage_ratio 0 1632929076111
systemruntime_cpu_usage_ratio 0 1632929086110
# HELP systemruntime_working_set_bytes Working Set
# TYPE systemruntime_working_set_bytes gauge
systemruntime_working_set_bytes 1529000000 1632929066112
systemruntime_working_set_bytes 1529000000 1632929076110
systemruntime_working_set_bytes 1529000000 1632929076112
...
# HELP systemruntime_time_in_gc_ratio % Time in GC since last GC
# TYPE systemruntime_time_in_gc_ratio gauge
systemruntime_time_in_gc_ratio 0 1632929066112
systemruntime_time_in_gc_ratio 0 1632929076110
systemruntime_time_in_gc_ratio 0 1632929076112
上面看到的是 System.Runtime counters 的指标, 接下来,我们需要把这些信息展示到 Grafana Dashboard。
1. 准备一个 dotnet core 应用
为了更好的展示, 这里我们使用了一个内存泄露的示例项目, 这是一个.NET 5 的应用, 你可以在github上面找到,然后下载到本地
https://github.com/sebastienros/memoryleak
git clone https://github.com/sebastienros/memoryleak.git
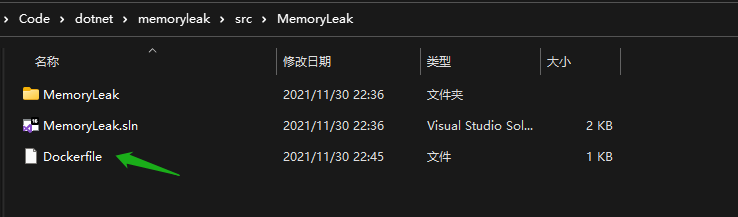
接下来, 我们让应用在 docker 容器中运行, 这里准备了一个 Dockerfile 文件, 你需要把它手动添加到项目的解决方案目录下
# https://hub.docker.com/_/microsoft-dotnet
FROM mcr.microsoft.com/dotnet/sdk:5.0 AS build
WORKDIR /source

COPY . .
RUN dotnet restore
RUN dotnet publish -c release -o /app --no-restore

# final stage/image
FROM mcr.microsoft.com/dotnet/aspnet:5.0
RUN apt-get update && apt-get install -y procps
WORKDIR /app
COPY --from=build /app .
ENTRYPOINT ["dotnet", "MemoryLeak.dll"]
然后构建镜像
docker build --pull -t memoryleak-image -f Dockerfile .
因为我们的 dotnet-monitor 是在 sidecar 容器运行的, 所以需要共享 volume (用于 IPC 通信), 使用以下命令创建一个 volume
docker volume create dotnet-tmp
现在我们准备运行我们的 memoryleak 镜像, 然后映射端口 80 ---> 5000
docker run -d -it --rm -e TZ=Asia/Shanghai -p 5000:80 --mount "source=dotnet-tmp,target=/tmp" memoryleak-image
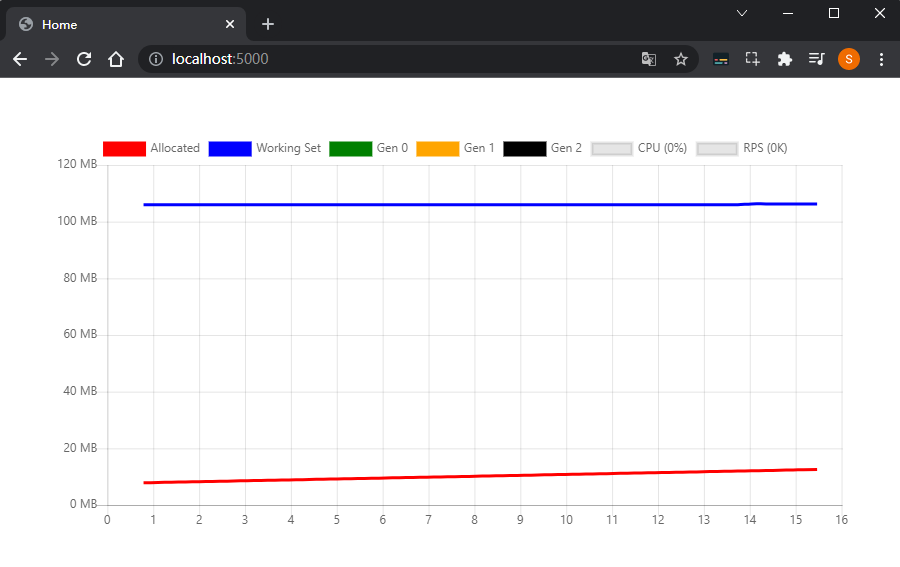
运行成功后, 访问 http://localhost:5000/
2. dotnet-monitor
我们可以安装 dotnet-monitor 为全局工具,但让我们继续使用 Docker 容器, Microsoft Container Registry 上有可用的容器映像,只需要使用以下命令即可:
docker run -d -it --rm -e TZ=Asia/Shanghai -p 12323:52323 --mount "source=dotnet-tmp,target=/tmp" mcr.microsoft.com/dotnet/monitor --urls http://*:52323 --no-auth
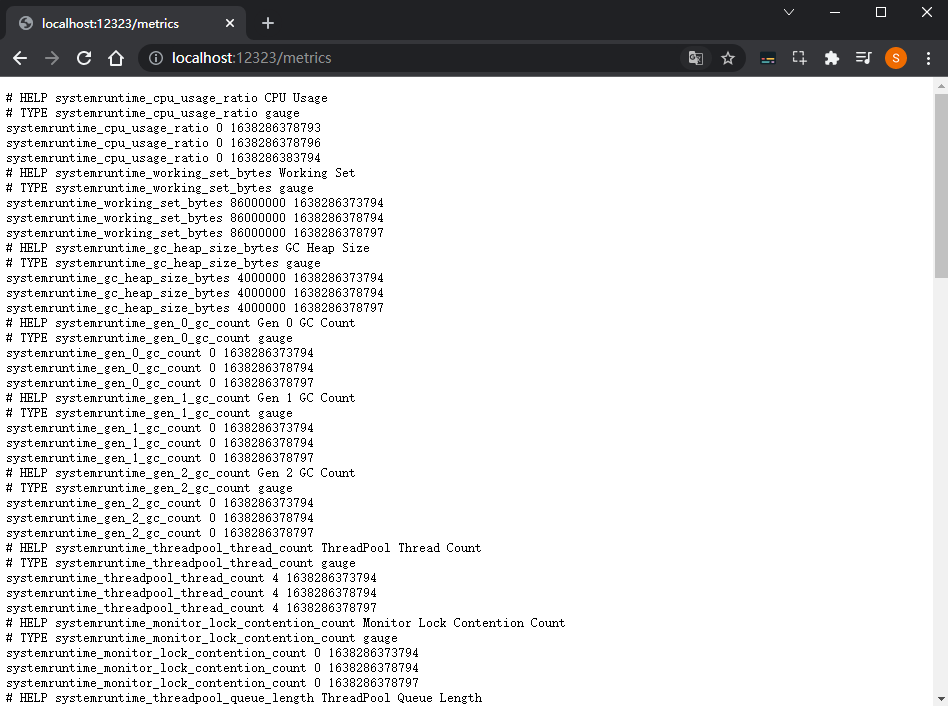
同样, 挂载了我们上面创建的 dotnet-tmp volume, 然后访问 http://localhost:12323/metrics , 现在已经能看到指标信息了
3. Prometheus
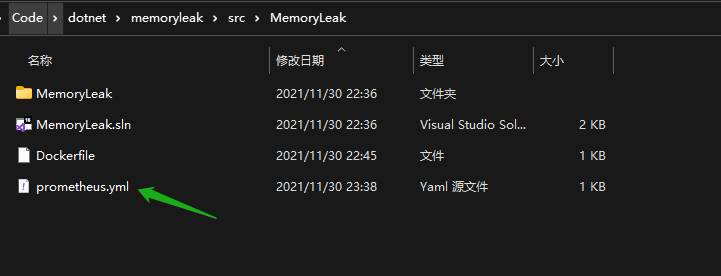
Prometheus 是一个免费的监控系统和时序数据库, 我们需要存储 dotnet-monitor 收集的 metrics 指标信息, 同样,我们可以通过各种方式运行/安装 Prometheus,这里我们还继续使用 Docker, 首先还需要一个 prometheus.yml 配置文件, 你可以手动添加到解决方案目录下
global:
  scrape_interval: 15s
  scrape_timeout: 10s
  evaluation_interval: 15s
alerting:
  alertmanagers:
  - scheme: http
    timeout: 10s
    api_version: v1
    static_configs:
    - targets: []
scrape_configs:
- job_name: prometheus
  honor_timestamps: true
  scrape_interval: 15s
  scrape_timeout: 10s
  metrics_path: /metrics
  scheme: http
  static_configs:
  - targets:
    - localhost:9090
- job_name: memoryleak
  honor_timestamps: true
  scrape_interval: 2s
  scrape_timeout: 2s
  metrics_path: /metrics
  scheme: http
  static_configs:
  - targets:
    - host.docker.internal:12323
上面配置中, 定时 2s 抓取了 http://host.docker.internal:12323/metrics , 这是 dotnet-monitor 暴露的指标信息, 然后使用下边的命令, 在 docker 中启动 prometheus, 注意 D:\Code\dotnet\memoryleak\src\MemoryLeak\prometheus.yml 这里要改成你本地 prometheus.yml 文件路径。
docker run -d --name prometheus-container -e TZ=Asia/Shanghai -p 30090:9090 -v D:\Code\dotnet\memoryleak\src\MemoryLeak\prometheus.yml:/etc/prometheus/prometheus.yml ubuntu/prometheus
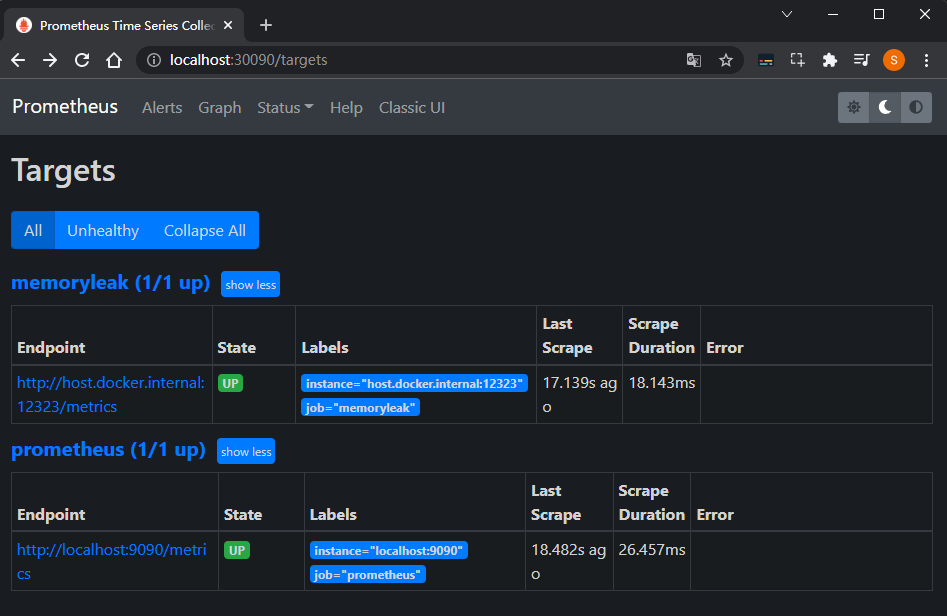
就是这么简单, Prometheus 运行后, 我们访问 http://localhost:30090/targets , 查看运行状态, 一切 OK
4. Grafana
最后, 就是用 Grafana 做可视化, 同样, 我们使用下面的命令在docker中运行 Grafana
docker run -d -e TZ=Asia/Shanghai -p 3000:3000 grafana/grafana
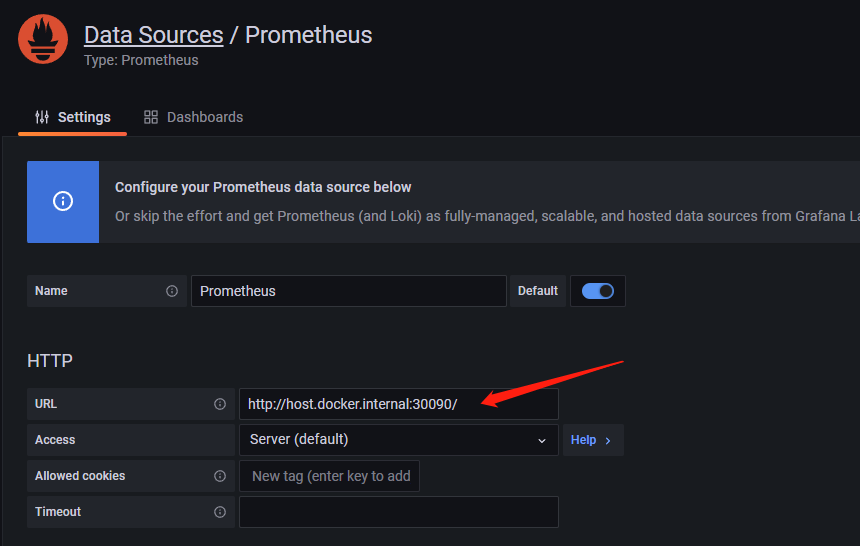
接下来, 我们访问 http://localhost:3000/ , 首次登录可以使用 admin/admin, 然后转到 Configuration -> Data sources, 点击 Add data source 添加数据源, 选择 Prometheus, 然后设置 URL 为 http://host.docker.internal:30090/ , 其他的参数默认, 然后 Save & test 保存, 如下

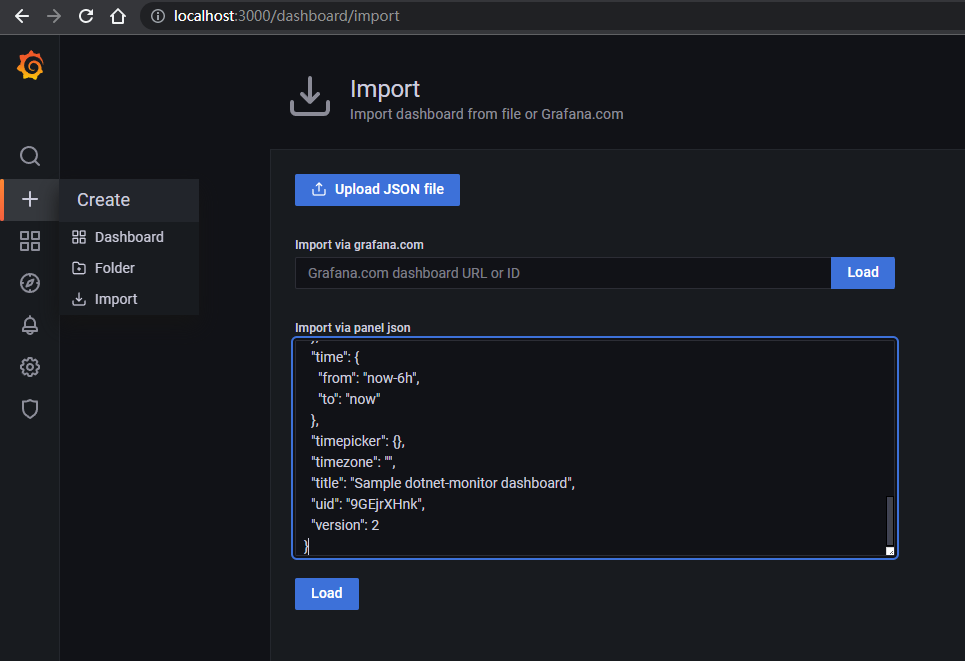
现在数据源设置好了, 接下来还需要配置 dashboard , 这里有一个json文件, 你可以直接复制内容到文本框并导入, 如下
https://dotnetos.org/assets/files/posts/sample-dotnet-monitor-dashboard.json
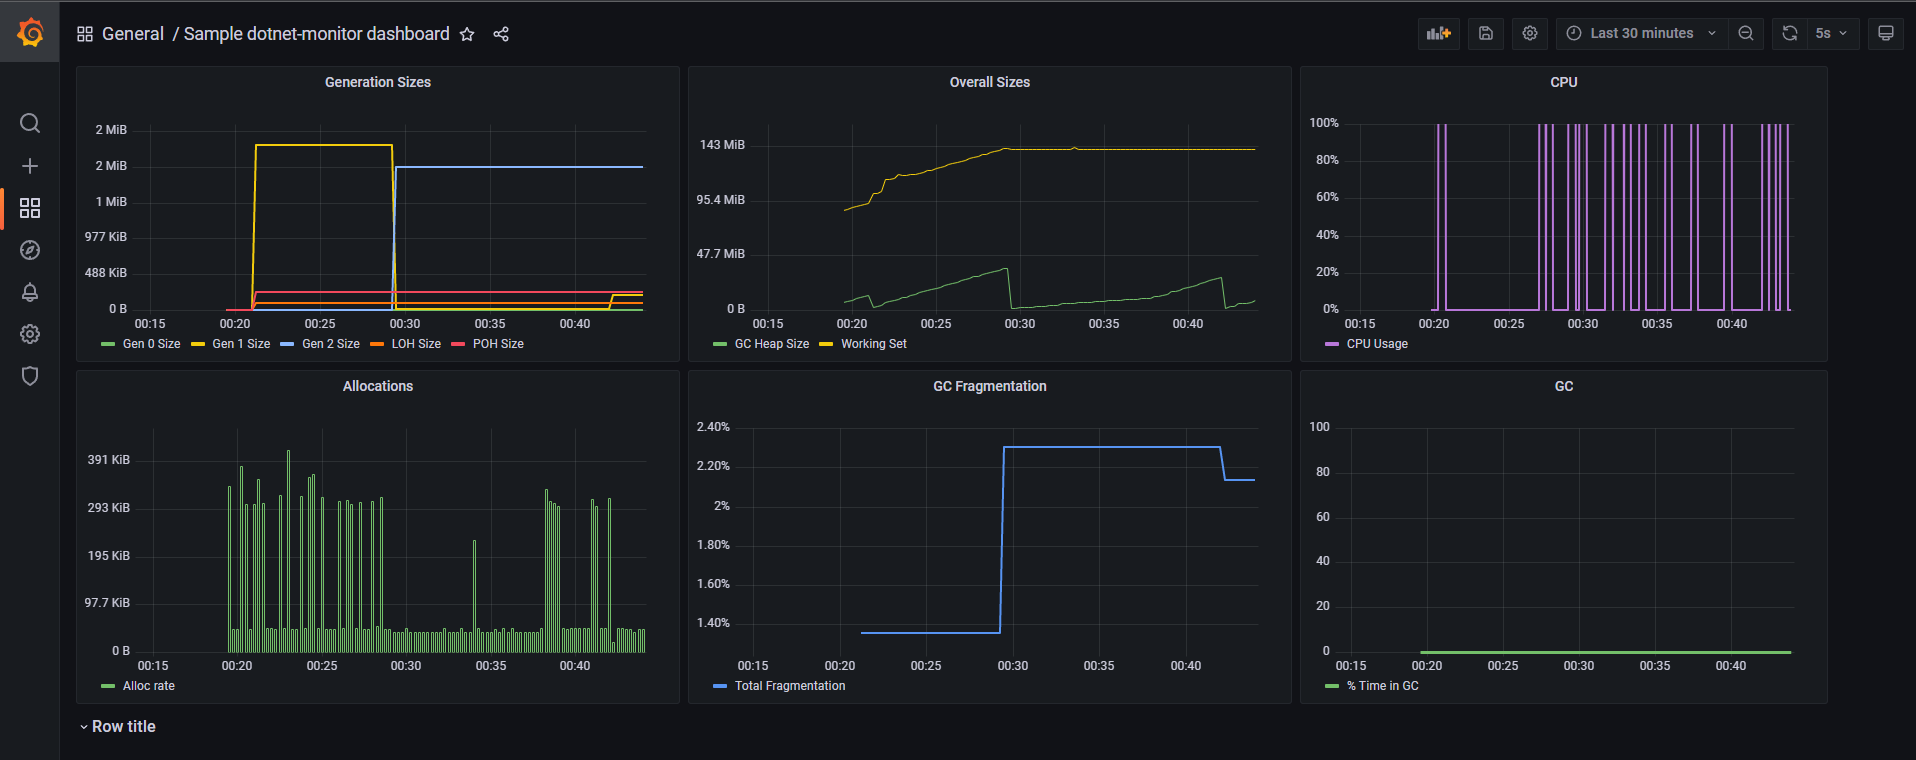
恭喜, 现在你已经有一个看上去很nice的仪表盘!
总结
我们回顾一下整个过程, 总共有4个容器, 首先是 .NET 5 的应用, 然后 dotnet-monitor 收集应用的指标信息, Prometheus 定时拉取并存储 dotnet-monitor 的 metrics, 最后用 Grafana 进行可视化。
原文链接: https://dotnetos.org/blog/2021-11-22-dotnet-monitor-grafana/

 浙公网安备 33010602011771号