利用AmChart制作图表信息(效果动态好看,很花哨)
最近都是在做图表,老大觉得不好看,换了几个,熟悉了几个制作图表的插件,分享一下使用,这个是使用Amchart制作的,不多说,直接上源码:
<div id="chartdiv" style="width: 820px; height: 360px;">
                    </div>
<input type="radio" class="radioItem" name="optiontype" checked="checked" value="0"
                            style="height: 20px; width: 20px; vertical-align: middle;" /><lable style="vertical-align: middle;">按月查询</lable>
                        <input type="radio" class="radioItem" name="optiontype" value="1" style="height: 20px;
                            width: 20px; vertical-align: middle;" /><lable style="vertical-align: middle;">按日查询</lable>

                        <input type="text" id="startTime" class="Wdate" style="width: 110px;" onfocus="selectChange()" />
                        至
                        <input type="text" id="endTime" class="Wdate" style="width: 110px;" onfocus="selectChange()" />

                        <input type="button" id="serach" title="点击查询" value="点击查询" onclick="buildChart()" />
js引用(引用地址自行修改)
        <script src="Scripts/amcharts/amcharts.js" type="text/javascript"></script>

        <script src="Scripts/amcharts/serial.js" type="text/javascript"></script>
后台数据处理代码
 Dictionary<string, object> result = new Dictionary<string, object>();
            List<Data> data = new List<Data>();
            result.Add("access", getData_exec(all_amount));
            result.Add("pay", GetList(GetTable(sql_pay), OptionType, day));
            result.Add("received", GetList(GetTable(sql_received), OptionType, day));
            result.Add("payable", GetList(GetTable(sql_payable), OptionType, day));
            result.Add("receivable", GetList(GetTable(sql_receivable), OptionType, day));
            string access = result["access"].ToString();
            List<statistics> pay = result["pay"] as List<statistics>;
            List<statistics> received = result["received"] as List<statistics>;
            List<statistics> payable = result["payable"] as List<statistics>;
            List<statistics> receivable = result["receivable"] as List<statistics>;
            ArrayList arrList = new ArrayList();
            arrList.Add(pay);
            arrList.Add(received);
            arrList.Add(payable);
            arrList.Add(receivable);
            StringBuilder sb = new StringBuilder();
            foreach (statistics item in pay)
            {
                Data d1 = new Data();
                d1.year = item.time;
                d1.amount = access;
                d1.pay = item.amount;
                d1.received = received.Where(c => c.time == item.time).ToList().FirstOrDefault().amount;
                d1.payable = payable.Where(c => c.time == item.time).ToList().FirstOrDefault().amount;
                d1.receivable = receivable.Where(c => c.time == item.time).ToList().FirstOrDefault().amount;
                data.Add(d1);
            }
            Decimal max = Convert.ToDecimal(access);

            Decimal a = pay.Max<statistics>(c => Convert.ToDecimal(c.amount));
            max = a > max ? a : max;
            Decimal b = received.Max<statistics>(c => Convert.ToDecimal(c.amount));
            max = b > max ? b : max;
            Decimal e = payable.Max<statistics>(c => Convert.ToDecimal(c.amount));
            max = e > max ? e : max;
            Decimal d = receivable.Max<statistics>(c => Convert.ToDecimal(c.amount));
            max = d > max ? d : max;
            if (max <= 200)
            {
                max = 200;
            }
            HttpCookie cookie = new HttpCookie("max", max.ToString());
            Context.Response.Cookies.Add(cookie);
            JavaScriptSerializer jss = new JavaScriptSerializer();
            string str= jss.Serialize(data);
            HttpContext.Current.Response.Clear();
            HttpContext.Current.Response.Write(str);
            HttpContext.Current.Response.End();
前端数据处理
var chart;
//这一个方法是用来动态刷新数据的,不用的话会导致数据不会动态变化
    function init(chartData){
        var max=getCookie("max");
        chart.dataProvider = chartData;
        var valueAxis = new AmCharts.ValueAxis();
        valueAxis.minimum = 0;
        valueAxis.maximum = max;
        chart.validateNow();
        chart.validateData();
    }
    function lineContrast(data)
    {
       var max=parseInt(getCookie("max"));
       max=max+50;
        AmCharts.ready(function () {
            // SERIAL CHART
            chart = new AmCharts.AmSerialChart();
            chart.dataProvider = data;
            chart.categoryField = "year";
            chart.startDuration = 0.5;
            chart.balloon.color = "#000000";

            // AXES
            // category
            var categoryAxis = chart.categoryAxis;
            categoryAxis.fillAlpha = 1;
            categoryAxis.fillColor = "#FAFAFA";
            categoryAxis.gridAlpha = 0;
            categoryAxis.axisAlpha = 0;
            categoryAxis.dashLength = 0;
            categoryAxis.labelRotation = 45;
            categoryAxis.gridPosition = "start";
            categoryAxis.position = "bottom";

            // value
            var valueAxis = new AmCharts.ValueAxis();
            valueAxis.title = "金额";
            valueAxis.color ="#8420CA";
            valueAxis.dashLength = 5;
            valueAxis.axisAlpha = 0;
            valueAxis.minimum = 0.00;
            valueAxis.maximum = max;
            //valueAxis.integersOnly = true;
            valueAxis.gridCount = 0;
            valueAxis.dashLength =0;
            //valueAxis.inside = true;
            valueAxis.reversed = false; // this line makes the value axis reversed
            chart.addValueAxis(valueAxis);

            // GRAPHS
            // 总资产
            var graph = new AmCharts.AmGraph();
            graph.title = "资产总量";
            graph.valueField = "amount";
            //graph.hidden = true; // this line makes the graph initially hidden
            graph.balloonText = "[[category]] 资产总量为:[[value]]";
            graph.lineAlpha = 1;
            graph.bullet = "round";
            graph.lineColor="red";
            chart.addGraph(graph);

            // 已付款
            var graph = new AmCharts.AmGraph();
            graph.title = "已付金额";
            graph.valueField = "pay";
            graph.balloonText = "  [[category]] 已付金额: [[value]]";
            graph.bullet = "round";
            graph.lineColor="blue";
            chart.addGraph(graph);

            // 已收款
            var graph = new AmCharts.AmGraph();
            graph.title = "已收金额";
            graph.valueField = "received";
            graph.balloonText = "[[category]] 已收金额: [[value]]";
            graph.bullet = "round";
            graph.lineColor="green";
            chart.addGraph(graph);

            // 应付款
            var graph = new AmCharts.AmGraph();
            graph.title = "应付款";
            graph.valueField = "payable";
            graph.balloonText = "[[category]] 应付款:[[value]]";
            graph.bullet = "round";
            graph.bulletBorderThickness = 2;
            graph.lineThickness = 2;
            graph.bulletBorderThickness = 2;
            graph.bulletBorderAlpha = 1;
            graph.lineColor="gray";
            graph.dashLength=9;
            chart.addGraph(graph);

            // 应收款
            var graph = new AmCharts.AmGraph();
            graph.title = "应收款";
            graph.valueField = "receivable";
            graph.balloonText = "[[category]] 应收款: [[value]]";
            graph.bullet = "round";
            graph.lineColor="black";
            graph.dashLength=3;
            chart.addGraph(graph);

            // CURSOR
            var chartCursor = new AmCharts.ChartCursor();
            chartCursor.cursorPosition = "mouse";
            chartCursor.zoomable = false;
            chartCursor.cursorAlpha = 0;
            chart.addChartCursor(chartCursor);

            // LEGEND
            var legend = new AmCharts.AmLegend();
            legend.bulletType = "round";
            legend.equalWidths = false;
            legend.useGraphSettings = true;
            legend.gridPosition = "start";
            legend.position = "top";
            chart.addLegend(legend);

            // WRITE
            chart.write("chartdiv");
        });
    }


function buildChart()
    {
        if($("#startTime").val()>$("#endTime").val()||($("#startTime").val()>getNowFormatDate("month")&&$("#startTime").val()>getNowFormatDate()))
        {
            layer.msg("请输入正确时间");
            return;
        }
        var BeginTime =$("#startTime").val();
        var EndTime = $("#endTime").val();
        var OptionType=$('input[name="optiontype"]:checked').val();
        $.ajax({
            url: '/WebUI_Index.aspx?method=GetData',
            type: 'POST',
            data: { BeginTime: BeginTime, EndTime: EndTime,OptionType:OptionType},
            dataType: "json",
            cache: false,
            async: false,
            success: function (obj) {
                lineContrast(obj);
                window.setInterval(init(obj), 5000);
            },
            error: function (jqXHR, textStatus, errorThrown) {
                layer.msg(jqXHR.responseText);
            }
        });
    }
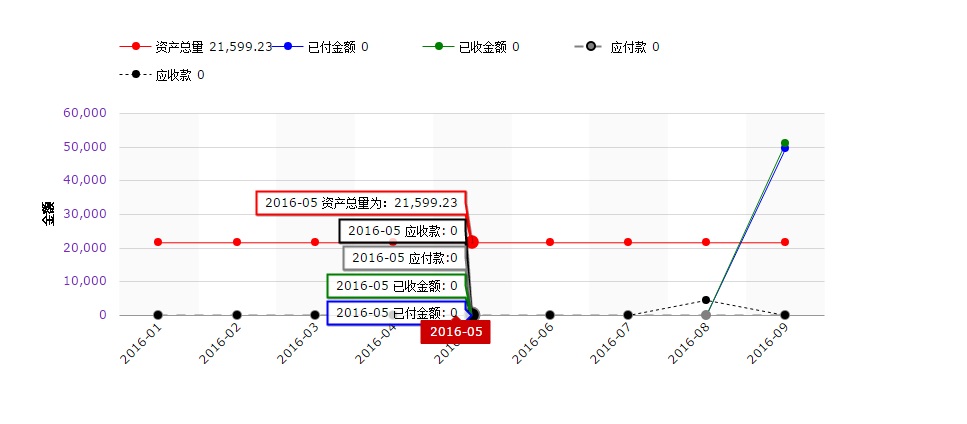
效果图例:

 浙公网安备 33010602011771号