在vue中使用 Echarts组件化 父子组件--> 拆分option
在初始化 chartInstance 对象的时候 初始化 图表的样式
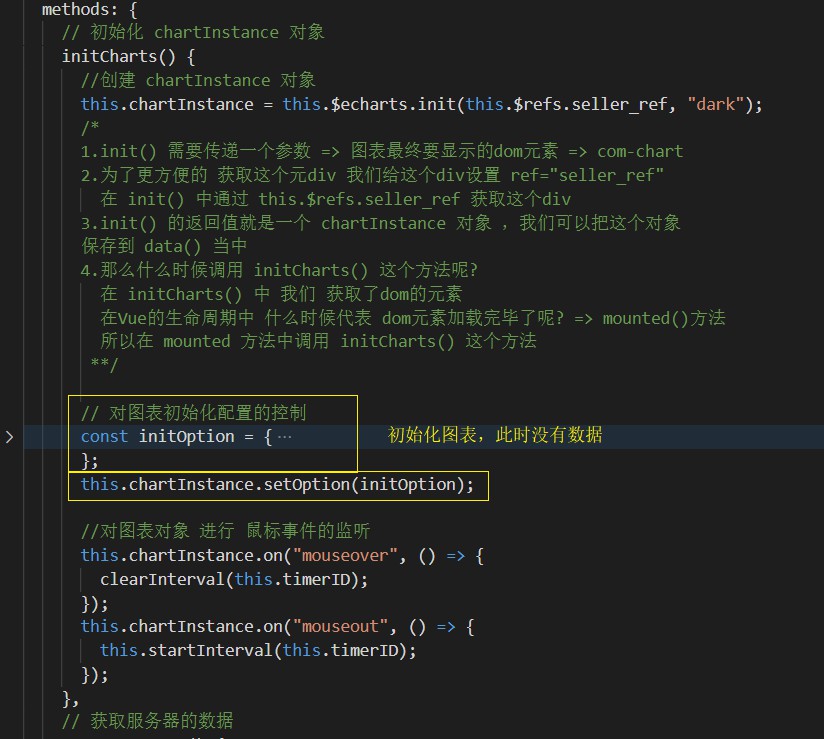
// 对图表初始化配置的控制
      const initOption = {
        title: {
          text: "▎商家销售统计",
          textStyle: { fontSize: 45 },
          top: 10,
          left: 20,
        },
        grid: {
          top: "20%",
          left: "3%",
          right: "6%",
          bottom: "3%",
          containLabel: true,
        },
        xAxis: {
          type: "value",
        },
        yAxis: {
          type: "category",
        },
        tooltip: {
          // 什么时候触发背景颜色呢? 鼠标引入到坐标轴的时候
          trigger: "axis",
          // 鼠标移到坐标轴所展示出来的样式
          axisPointer: {
            type: "line",
            z: 0,
            lineStyle: {
              width: 66,
              color: "#2d3443",
            },
          },
        },
        series: [
          {
            type: "bar",
            barWidth: 66,
            label: {
              show: true,
              position: "right",
              textStyle: {
                color: "white",
              },
            },
            itemStyle: {
              barBorderRadius: [0, 33, 33, 0], //左上 、右上 、右下 、左下
              // 线性渐变对象 => 指明颜色渐变方向 => 指明不同颜色下 百分比的值
              color: new this.$echarts.graphic.LinearGradient(0, 0, 1, 0, [
                // 百分之0状态下的颜色值
                { offset: 0, color: "#5052ee" },
                // 百分之100状态下的颜色值
                { offset: 1, color: "#ab6ee5" },
              ]),
            },
          },
        ],
      };
在更新的时候 ,传递数据到图表
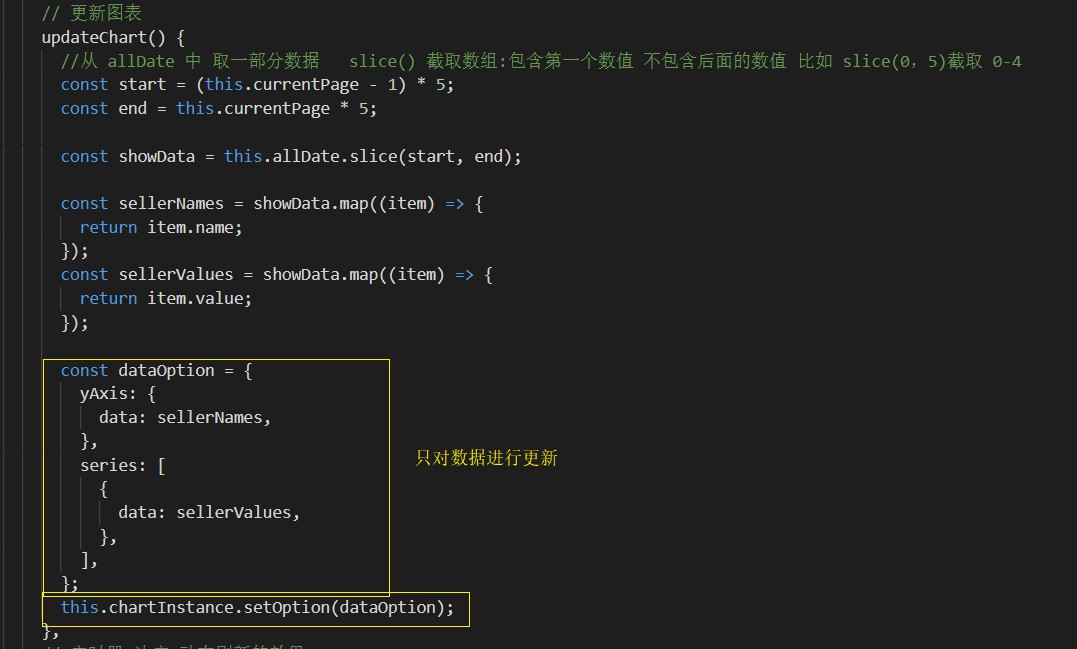
多次 setOption 并不会 替代之前的 ,只会相互融合。

 浙公网安备 33010602011771号