SQL优化案例(执行计划固定)
业务反应某个模块加载很慢(需要一分钟左右),以前是正常的。
配合业务部门,跟踪他们业务上的会话,数据库gv$session定位到慢sql,sql_child_number为2。
获取执行计划
selet * from table(dbms_xplan.display_cursor('xxx',2));
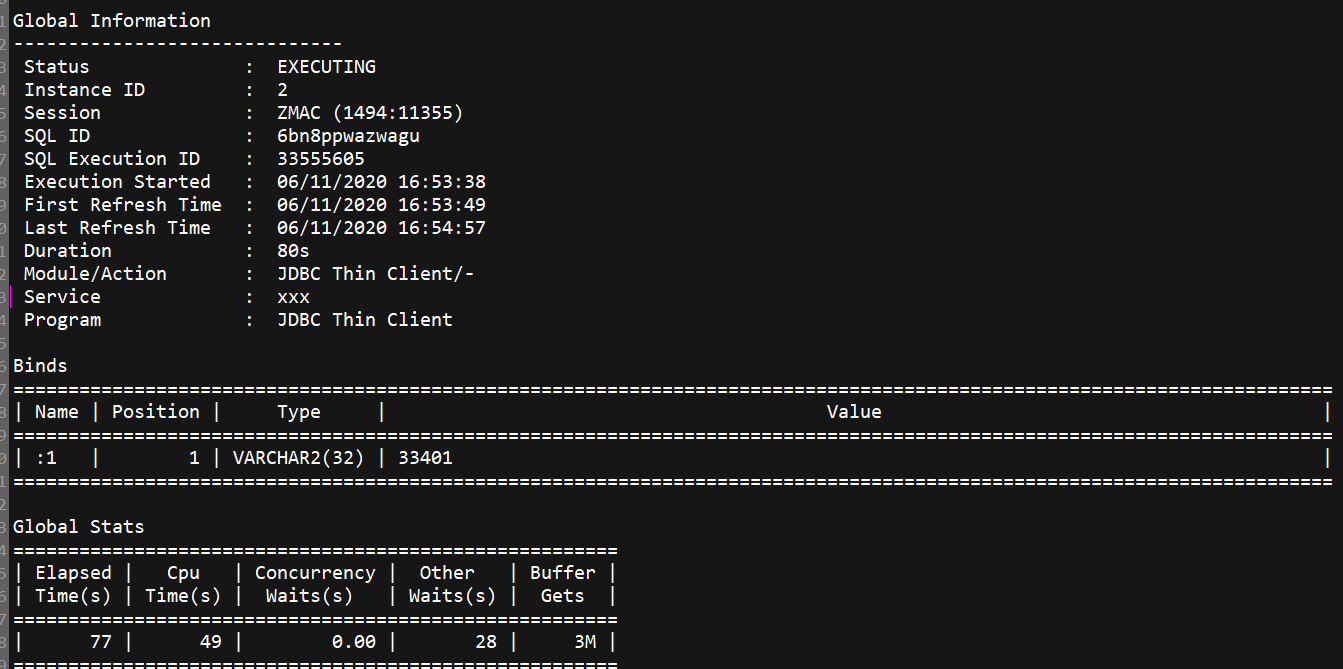
个人比较喜欢看v$sql_montor,信息比较全。
SQL Monitoring Report
SQL Text
------------------------------
select d.name, nvl(sum(nvl(a.w_stat, 0)), 0) value from Z_WARN_STAT a, k_dim_rela b, Z_TOPIC c,
p_code d,z_warn w where a.stat_ymd = to_char(w.this_time, 'yyyymmdd') and a.if_new = '1' and
a.t_id = w.t_id and w.w_type = '01' and b.dim_code = 'org' and a.org_no = b.dim_value and
b.top_dim_value = :1 and a.t_id = c.t_id and c.b_sub_type = d.value and d.code_type = 'subBusiness'
group by d.name, d.disp_sn order by d.disp_sn
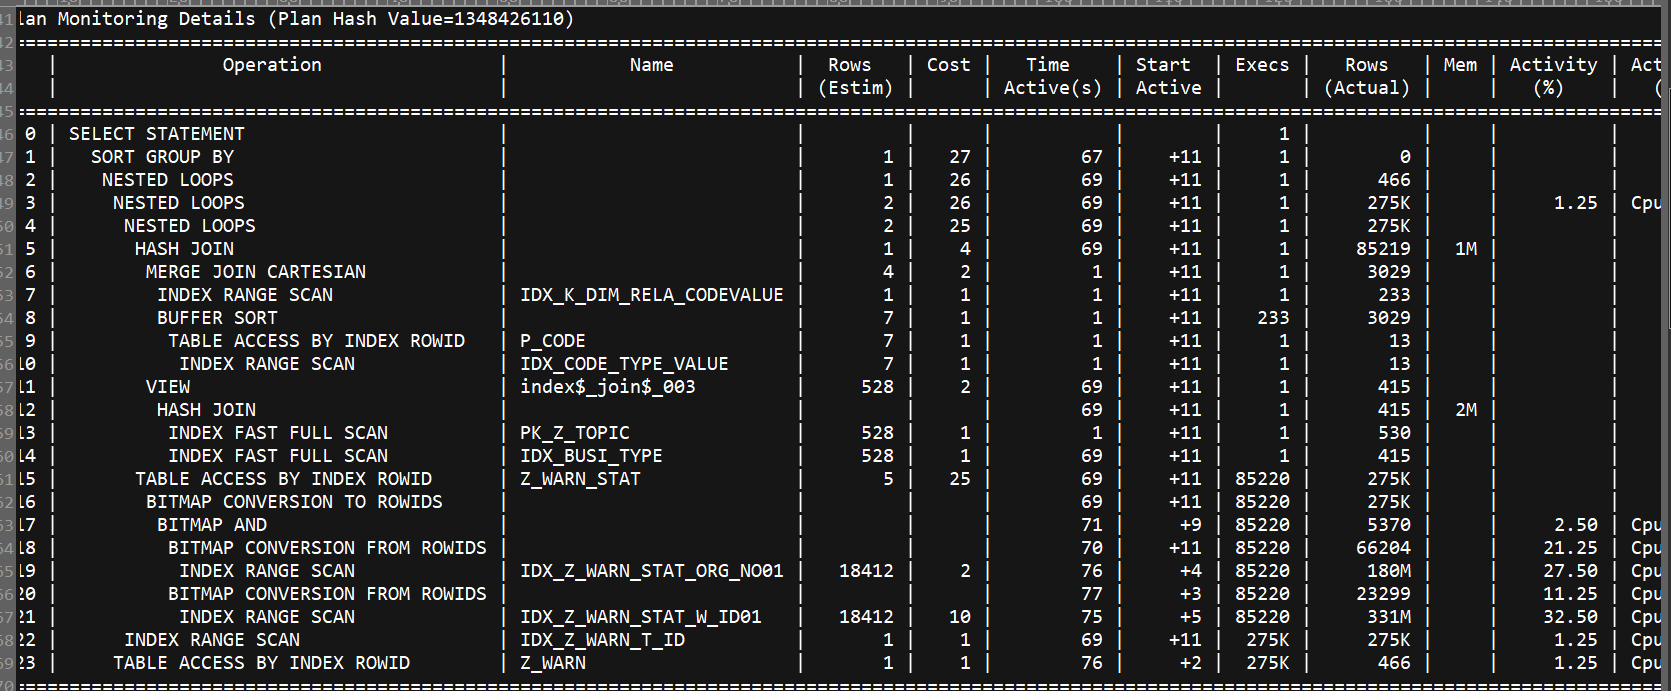
从执行计划我们立马能看到

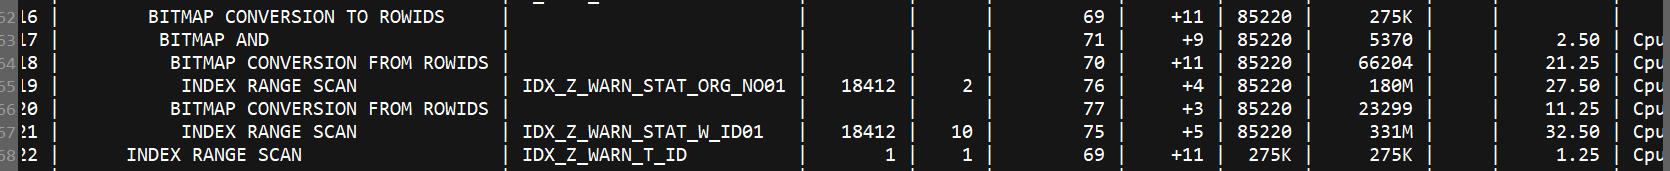
这段执行步骤消耗大量资源,且使用了位图转换。
因为业务反应之前都是正常的,所以马上联想到了查询优化器可能走了错误的执行计划。
select * from table(dbms_xplan.display_awr('6bn8ppwazwagu'))
或者通过awrsqrpt工具(更加具体直观)
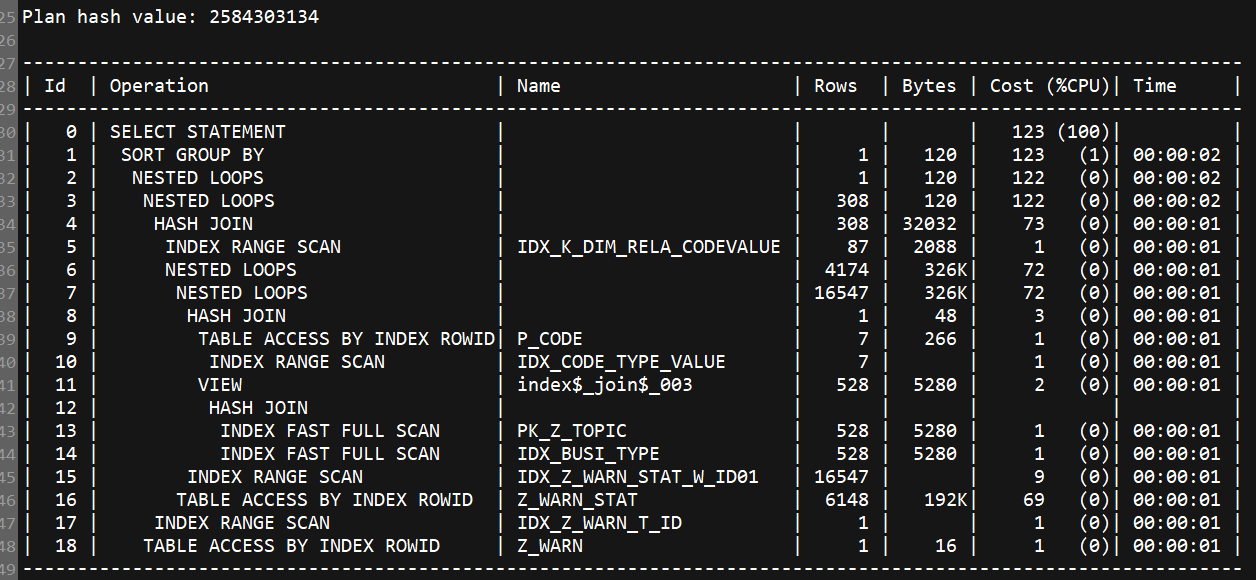

两份执行计划,现在走的是Plan hash value为1348426110。
从执行计划中的cost我们看到是Plan hash value: 2584303134 消耗的资源更多。
cost是执行计划的参考值,
cost的计算方式是oracle通过自己的规则,计算出资源消耗的综合值(cpu,内存,io)。
而我们关心的是sql的响应时间(最快返回对应结果)。
所以有些时候,oracle会使用cost较小的执行计划,但响应时间很长。
固定执行计划(sql_profile):
declare
v_hints sys.sqlprof_attr;
cl_sql_text clob;
wrong_sql_id varchar2(50):='6bn8ppwazwagu';
right_sql_id varchar2(50):='6bn8ppwazwagu';
right_child_num number:=4;
right_PLAN_HASH_VALUE number :=2573941063;
begin
select extractvalue(VALUE(d), '/hint') bulk collect
into v_hints
from xmltable('/*/outline_data/hint' passing
(select xmltype(other_xml) as xmlval
from dba_hist_sql_plan
where sql_id = right_sql_id
and PLAN_HASH_VALUE=right_PLAN_HASH_VALUE
and other_xml is not null)) d;
select sql_fulltext
into cl_sql_text
from v$sql
where sql_id = wrong_sql_id
and Rownum = 1;
dbms_sqltune.import_sql_profile(cl_sql_text,
v_hints,
'P_'||wrong_sql_id,
force_match => true,
replace => true);
end;
/
执行上述脚本,使sql强制执行right_PLAN_HASH_VALUE为2573941063的执行计划。
执行计划固定后,业务访问模块正常。

 浙公网安备 33010602011771号