

支持 JDK6+,零侵入,通过 Attach 机制连接 JVM,无需重启服务即可定位问题。
CLI 支持 Tab 自动补全,并提供 Web Console。
一、核心价值
- 线上问题快速定位:CPU 飙升、内存泄漏、线程阻塞
- 动态反编译验证代码:jad 命令
- 方法级性能分析:耗时、调用频次、异常统计
- 热更新/日志修改:无需重启即可修改代码或日志格式
优势:
- 零侵入
- 全功能 CLI
- 多环境支持(Linux/Mac/Windows + JDK6+)
二、安装与启动
1. 下载
# 官方下载
curl -O https://arthas.aliyun.com/arthas-boot.jar
wget https://alibaba.github.io/arthas/arthas-boot.jar
wget https://arthas.gitee.io/arthas-boot.jar
# 命令行安装
curl -L https://arthas.aliyun.com/install.sh | sh
2. 启动
# 探测 Java 进程并 attach
java -jar arthas-boot.jar
# 直接指定 PID
java -jar arthas-boot.jar [PID]
# 查看 Arthas 版本
version
3. Web Console
访问 http://127.0.0.1:8563/,操作模式与 CLI 一致。
三、核心命令与使用场景
| 命令 | 功能 | 示例/说明 |
|---|---|---|
| dashboard | JVM 实时数据面板(线程/内存/GC/环境) | dashboard -i 10000 -n 3 每 10 秒刷新 3 次 |
| thread | 查看线程堆栈及 CPU 占用 | thread -n 3 Top3 线程;thread -b 检测死锁 |
| watch | 方法执行数据观测 | watch com.example.Service *Method "{params,returnObj,throwExp}" -x 3 |
| trace | 方法内部调用路径及耗时 | trace com.example.Service getUserById -n 5 |
| stack | 查看方法调用路径 | stack com.example.Service getUserById |
| tt | 方法时空隧道,记录多次调用参数与返回值 | tt -t com.example.Service check |
| monitor | 方法执行监控(总数/耗时/失败率) | monitor -c 5 com.example.Service getUserById |
| jvm | JVM 信息概览 | jvm |
| vmoption | 查看/更新 JVM 诊断参数 | vmoption |
| sc | 查看 JVM 已加载类 | sc -d java.util.Stack |
| sm | 查看类方法 | sm com.example.Service |
| jad | 反编译类源码 | jad com.example.Service |
| classloader | 类加载器信息 | classloader -t |
| heapdump | 导出堆快照 | heapdump --live /tmp/dump.hprof |
| profiler | 性能剖析,生成火焰图 | profiler start → profiler stop --format html |
| redefine | 热更新代码 | redefine /tmp/com/example/Class.class |
| ognl | 查看/修改静态变量 | ognl '@com.example.Service@hashSet.add("test")' |
| logger | 查看/修改日志级别 | logger --name ROOT --level debug |
每个命令可加
-h查看详细帮助。
四、典型排查场景
1. CPU 飙升
thread -n 1           # 找出高 CPU 线程
trace com.example.Service getUserById  # 分析热点方法
jad com.example.Service                  # 反编译验证代码
2. 内存泄漏
dashboard                # Old 区增长监控
heapdump /tmp/dump.hprof # 导出堆快照
3. 接口响应慢
trace com.example.Controller *API      # 慢方法定位
watch com.example.DAO *Query "{params,#cost}" -x 2
4. 死锁/阻塞
thread -b                 # 定位死锁
thread <线程ID>           # 查看具体线程堆栈
5. 线上代码热更新
jad --source-only com.example.Class > /tmp/Class.java
# 修改后编译
mc /tmp/Class.java -d /tmp
# 热更新
redefine /tmp/com/example/Class.class
6. 火焰图生成
profiler start
profiler status
profiler stop --format svg
五、生产环境注意事项
- 安全控制:限制 Arthas 端口,避免公网暴露
- 性能影响:watch/trace 命令增加 5%~15% 开销,使用
-n限制输出次数 - 输出记录:关键命令通过
-o /tmp/arthas.log保存结果 - 问题解决后及时
stop释放资源
六、扩展工具链
- GC日志分析:GCeasy
- 内存分析:MAT/Eclipse Memory Analyzer
- 远程诊断:Arthas Tunnel Server
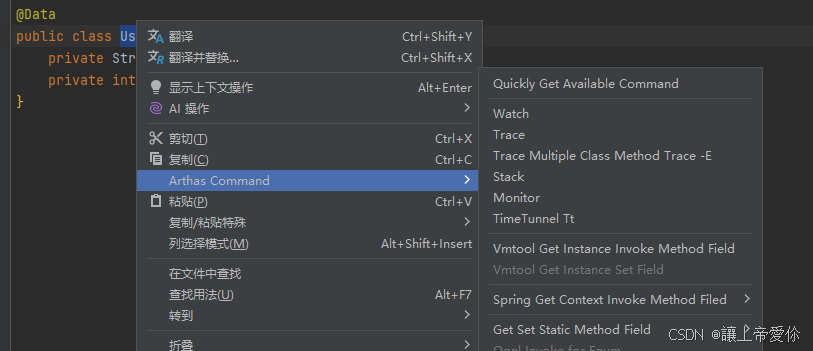
- IDE 插件:Arthas IDEA / ArthasHotSwap

 浙公网安备 33010602011771号