ML: Model Selection | Precision, Recall, and F1 Score | Diagnosing Bias and Variance
Source: Coursera Machine Learning provided by Stanford University Andrew Ng - Machine Learning | Coursera
Practical Techniques
model selection:
To choose between different models/hypotheses (e.g. different sets of features, degrees of polynomials, regularization parameter $\lambda$), they can be evaluated in the following way:
- Split the dataset into the training set (60%), cross validation set (20%), and test set (20%).
- Train the models on the training set.
- Compute their performances on the cross validation set.
- Choose the best model accordingly.
- Compute its performance on the test set to estimate its general performance.
For performance computation, the error for linear regression is:
$$ J_{set}(\theta) = \frac{1}{2m_{set}} \sum_{i=1}^{m_{set}}(h_{\theta}(x_{set}^{(i)}) - y_{set}^{(i)})^{2} $$
The "0/1 misclassification" error for logistic regression is:
$$ err(h_{\theta}(x),y) = \left\{\begin{matrix}0,\ if\ h_{\theta}(x)\geq threshold\ and\ y=0\ or\ h_{\theta}(x)<threshold\ and\ y=1\\1,\ otherwise\end{matrix}\right. $$
$$ error=\frac{1}{m_{set}} \sum_{i=1}^{m_{set}} err(h_{\theta}(x_{set}^{(i)}),y_{set}^{(i)})$$
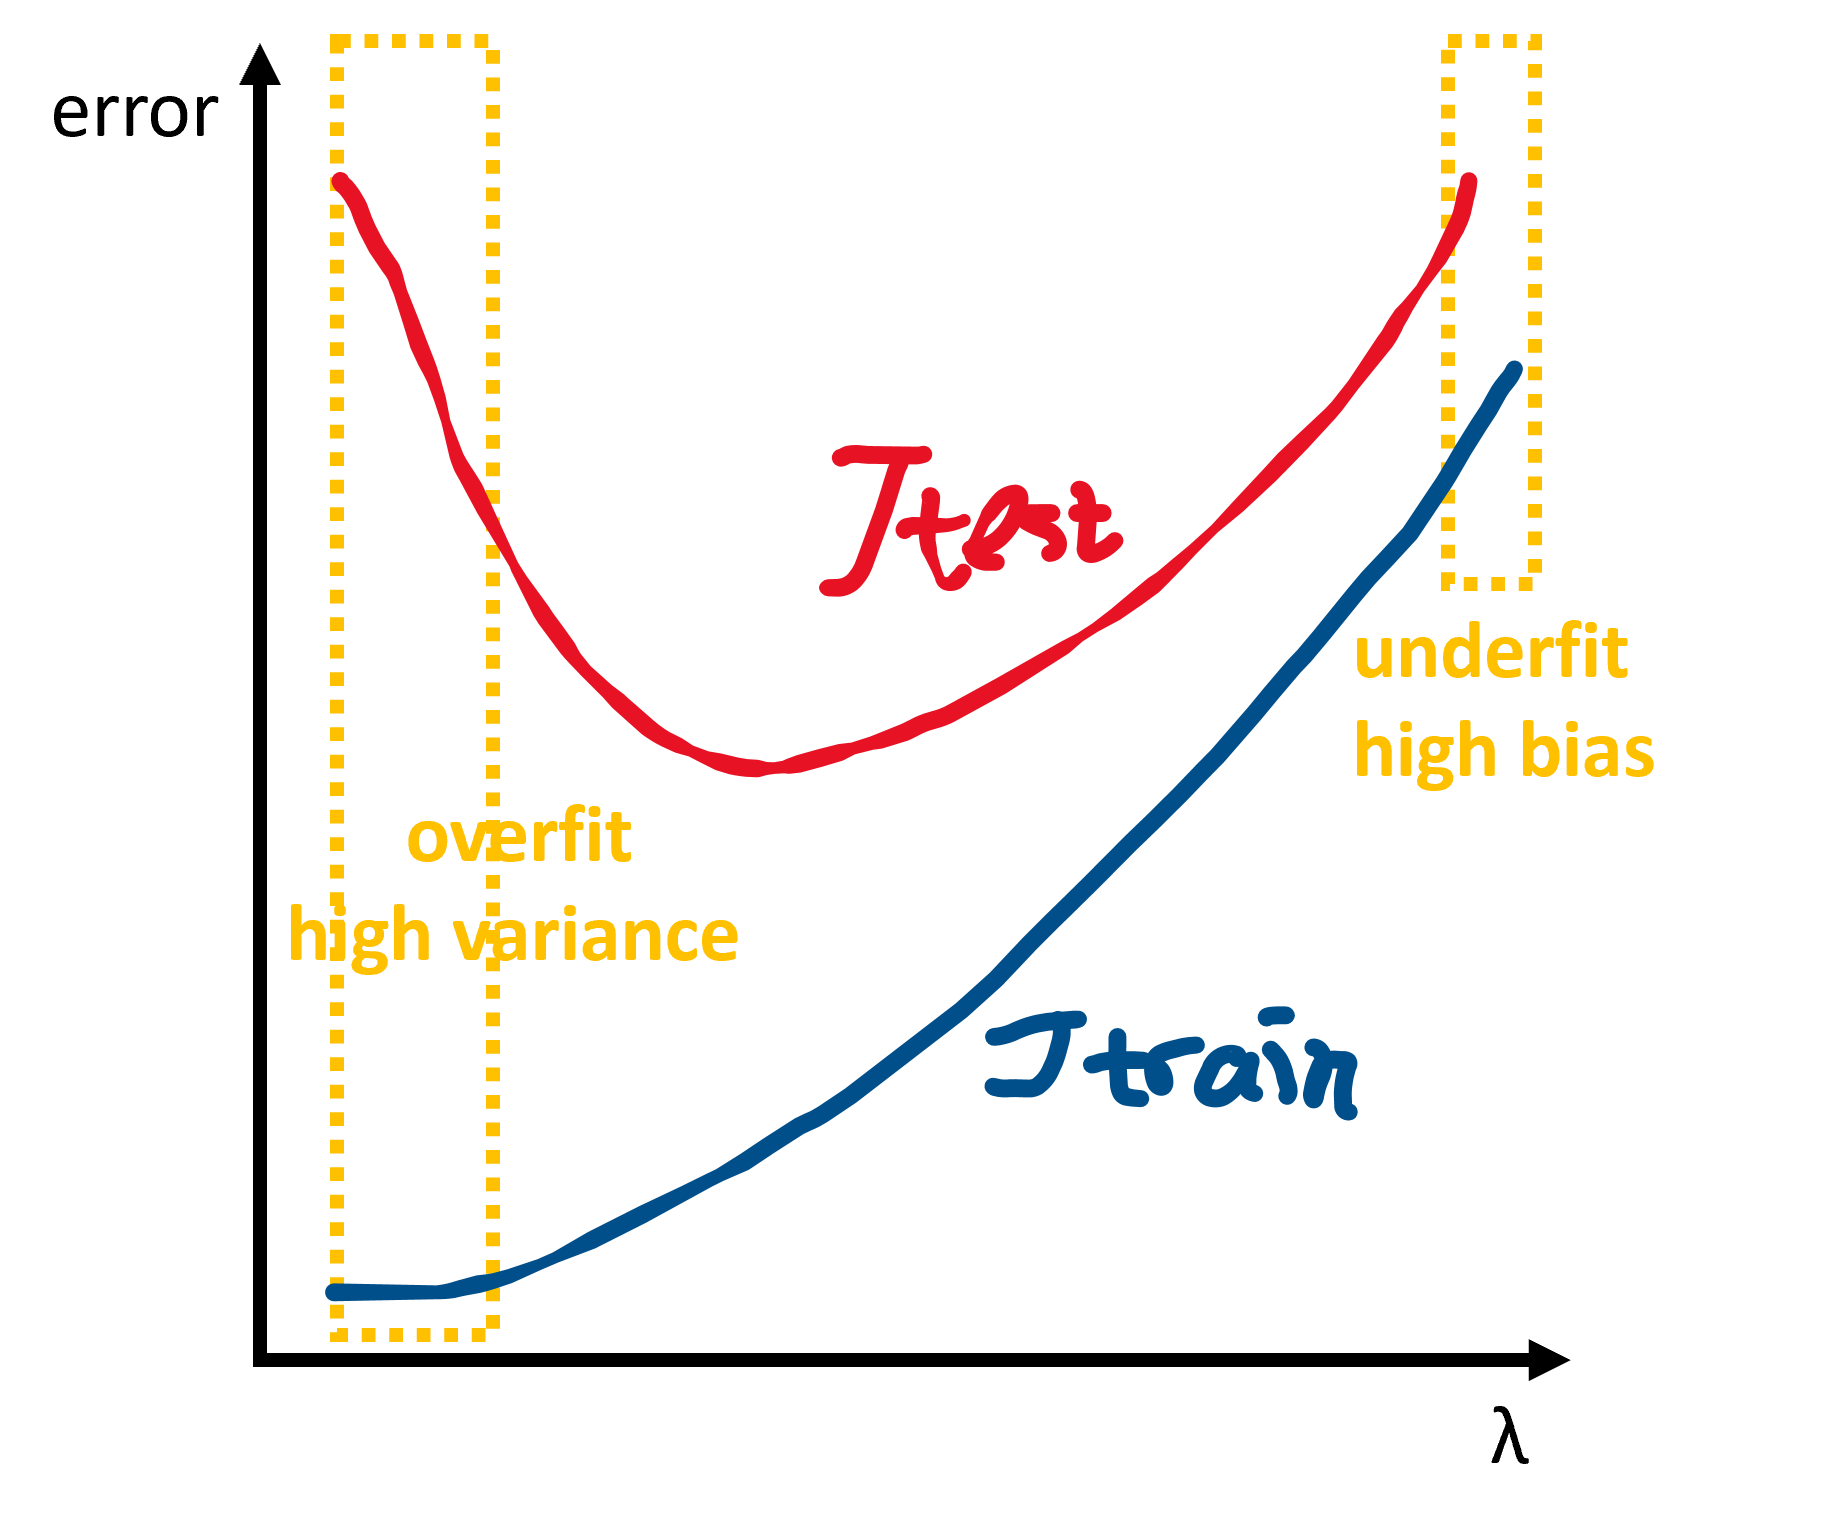
Note that when choosing the regularization parameter $\lambda$, the error does not contain the regularization term.
precision and recall:
For skewed data in logistic regression, only measuring the error may not be comprehensive. Additionally, precision and recall should be considered.
$$ precision = P = \frac{true\ positive}{predicted\ positive} = \frac{true\ positive}{true\ positive + false\ positive} $$
$$ recall = R = \frac{true\ positive}{actual\ positive} = \frac{true\ positive}{true\ positive + false\ negative} $$
where class 1 is often the rare one. A good model should have both high precision and recall. Combine the two to get one real-valued score - $F_{1}$ score:
$$ F_{1} = 2 \frac{PR}{P+R} $$
By lifting the threshold of $h_{\theta}(x)$, the model has higher precision (because it is more "confident" with result 1) and lower recall (because it is more "cautious" about predicting 1), and vice versa.
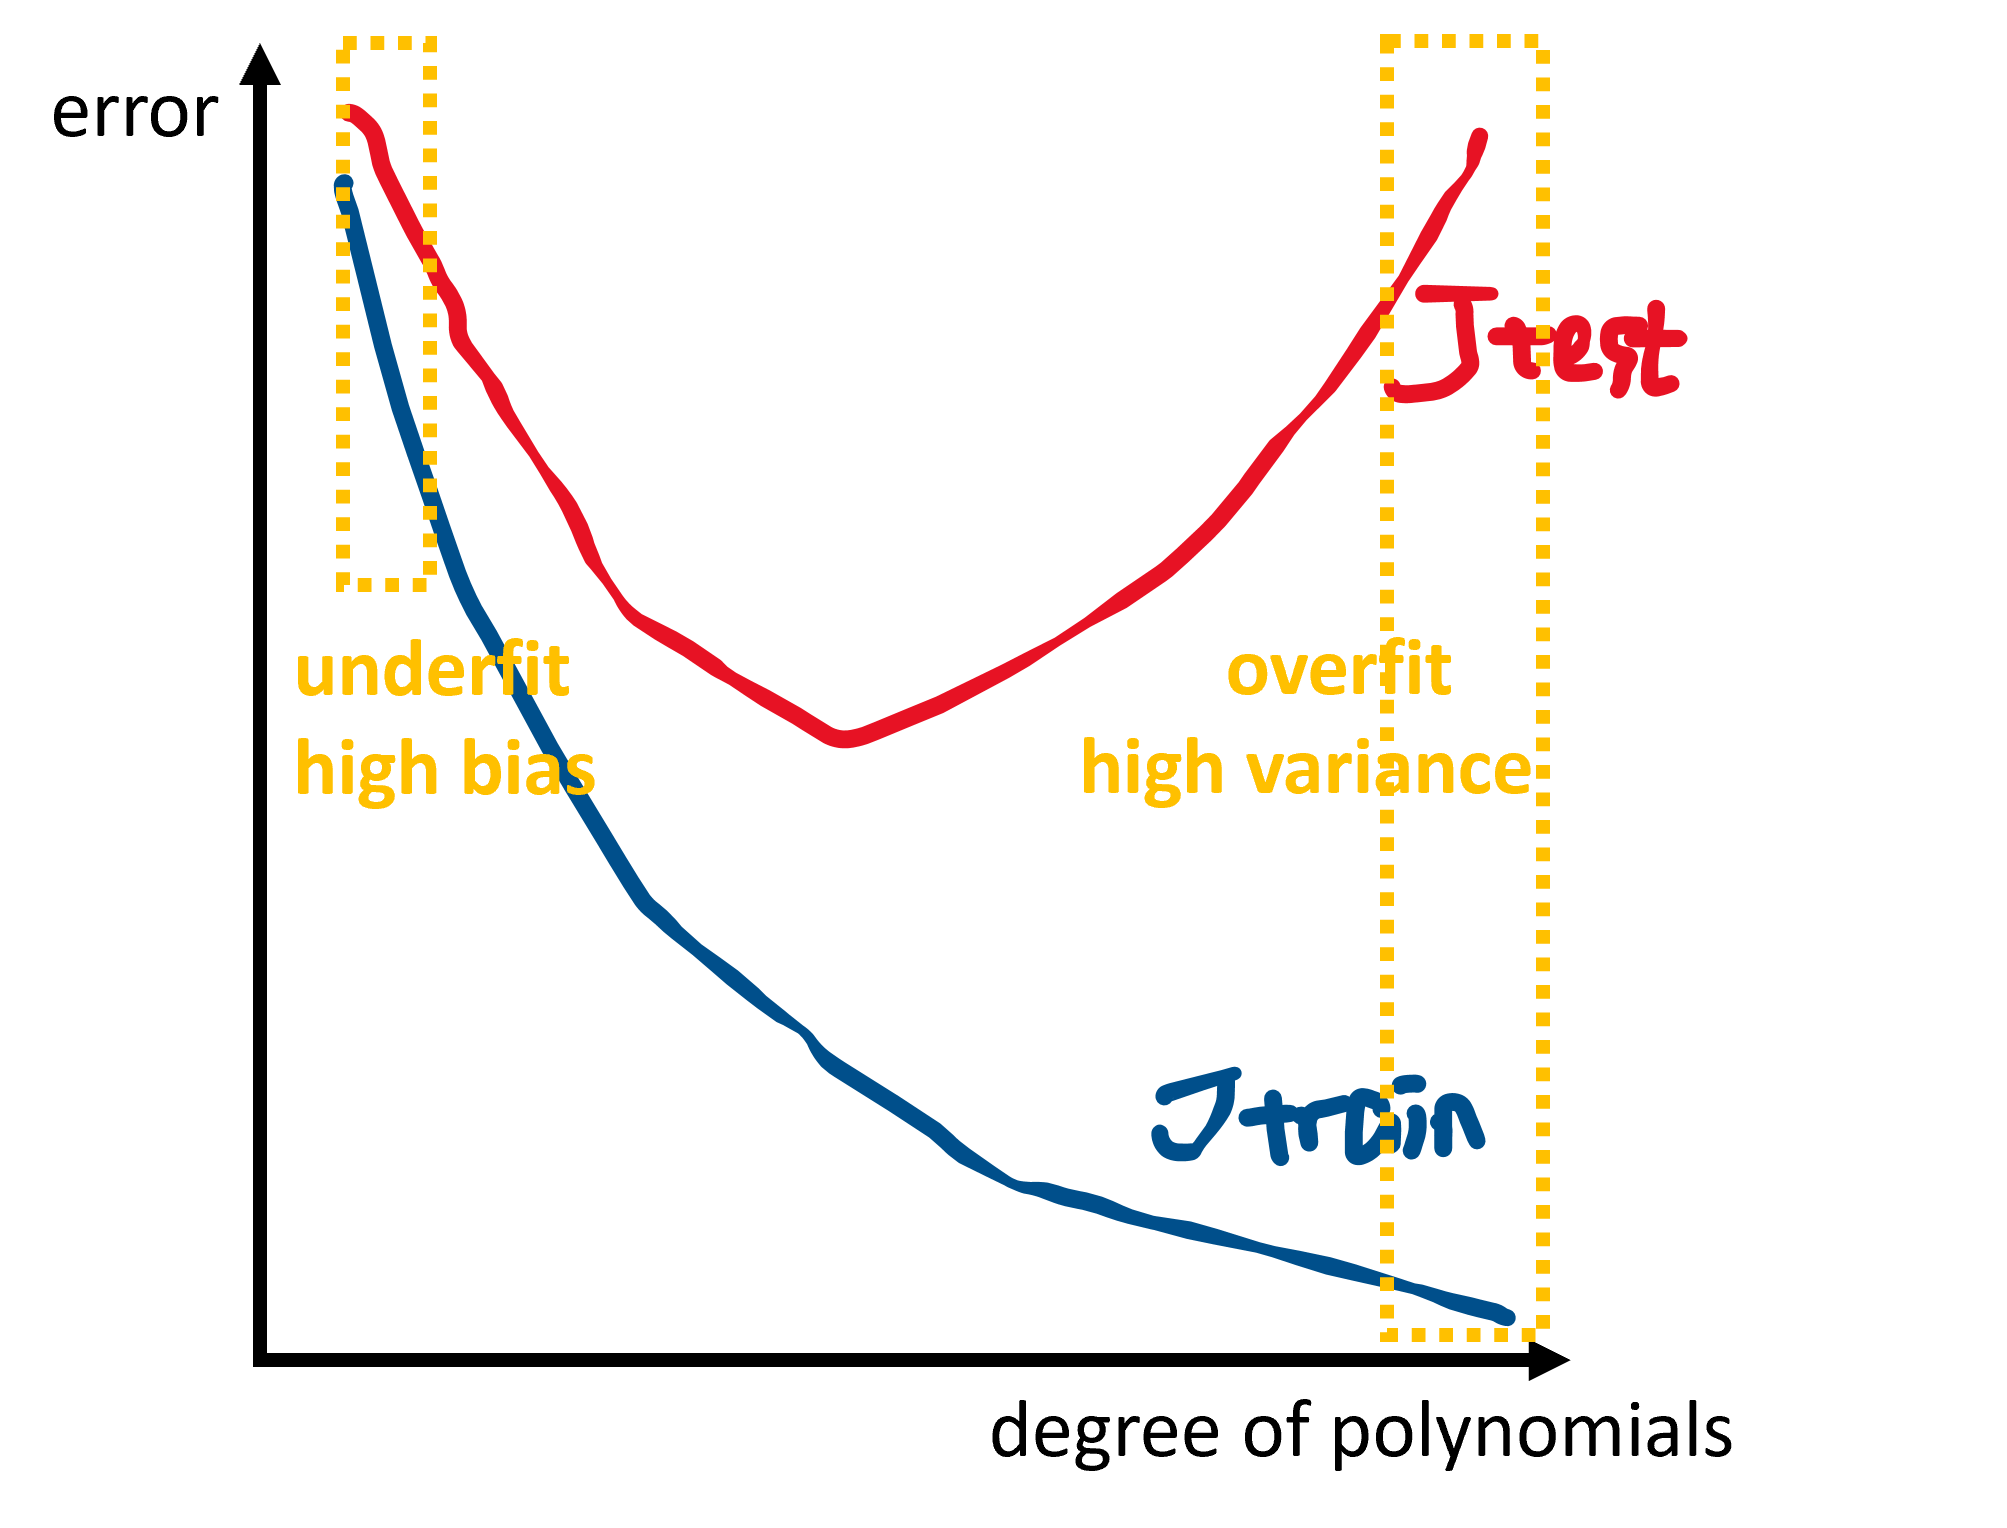
diagnosing bias and variance:
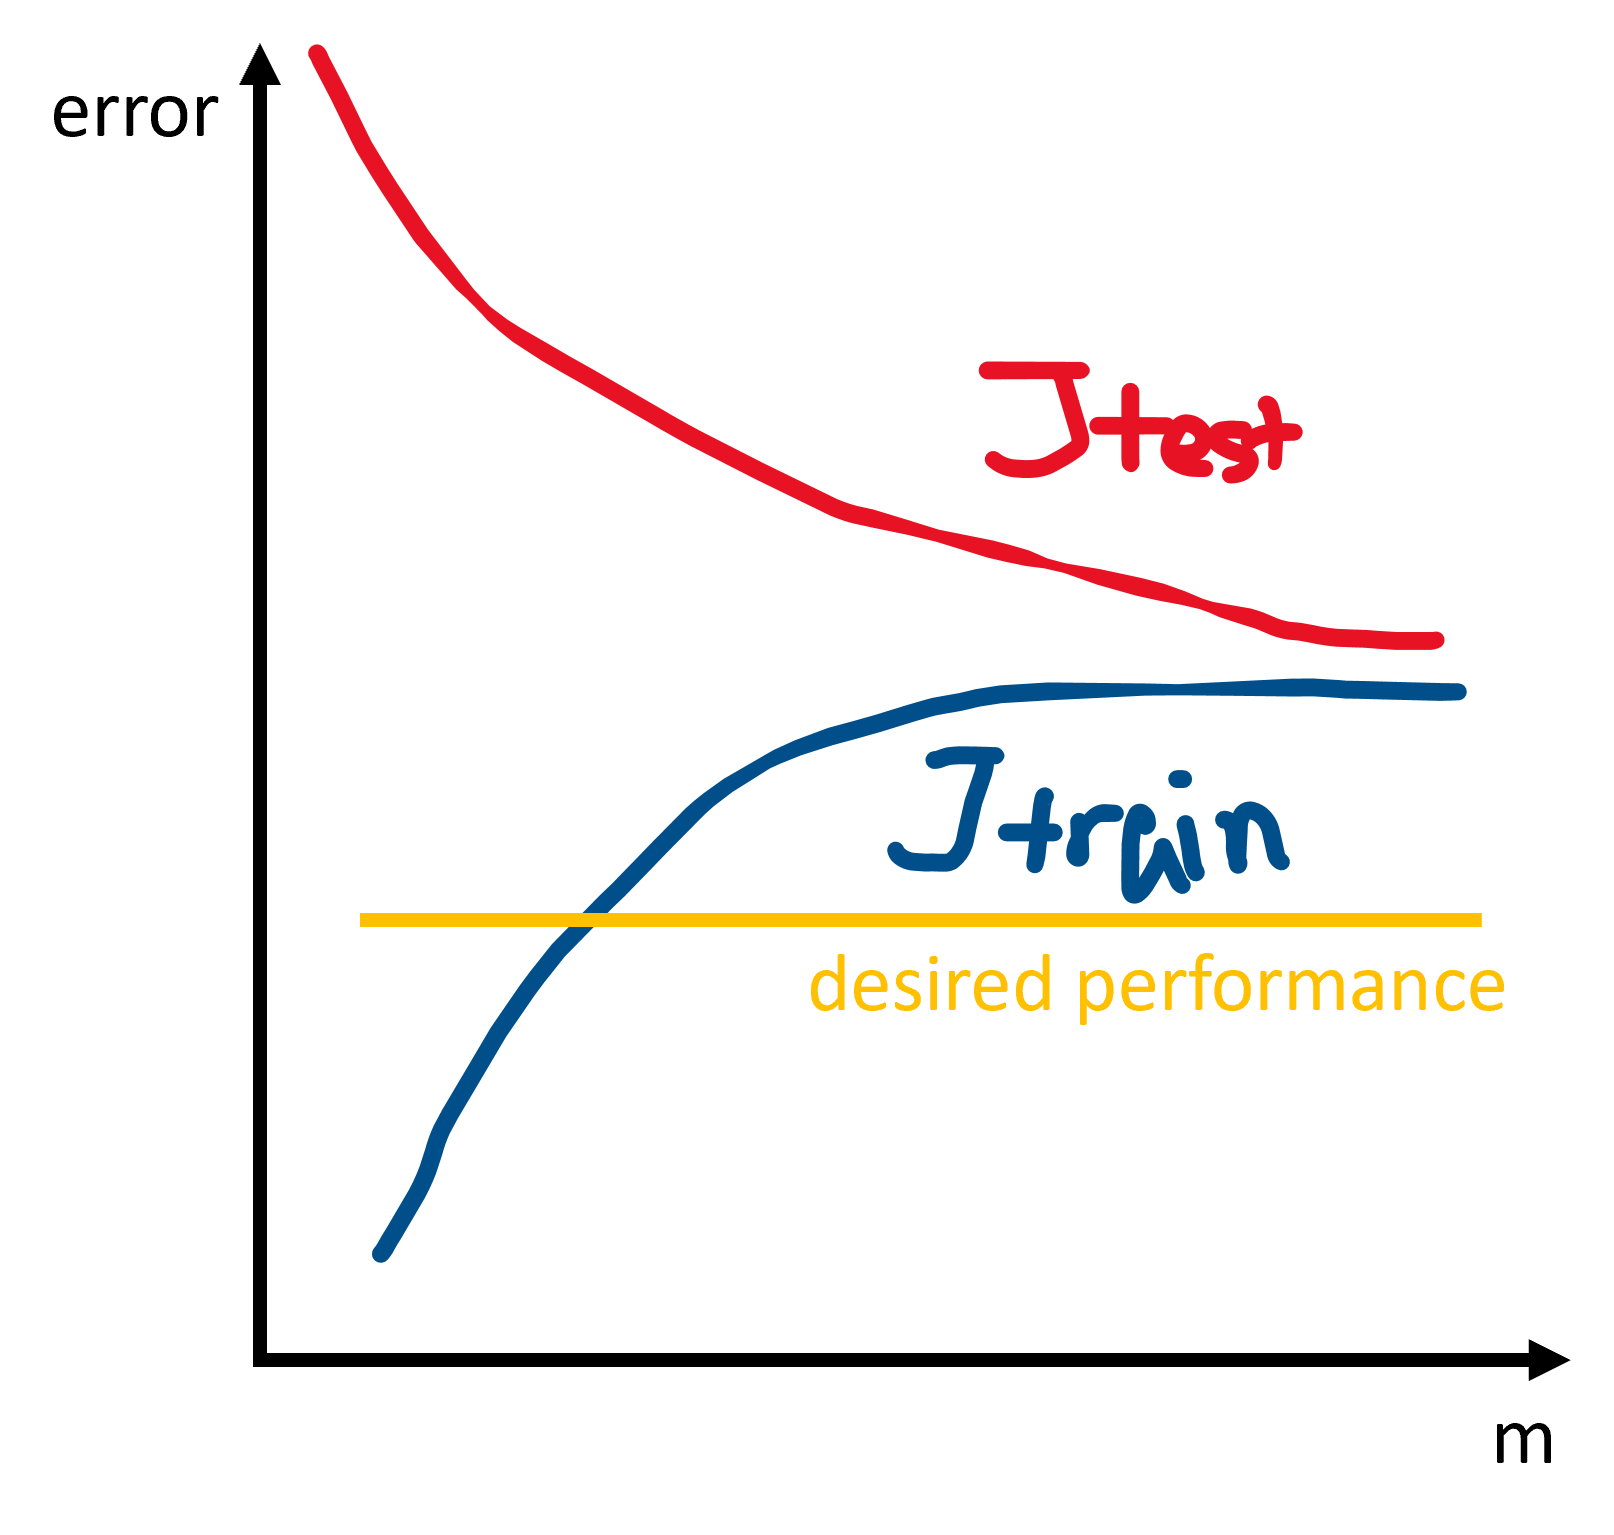
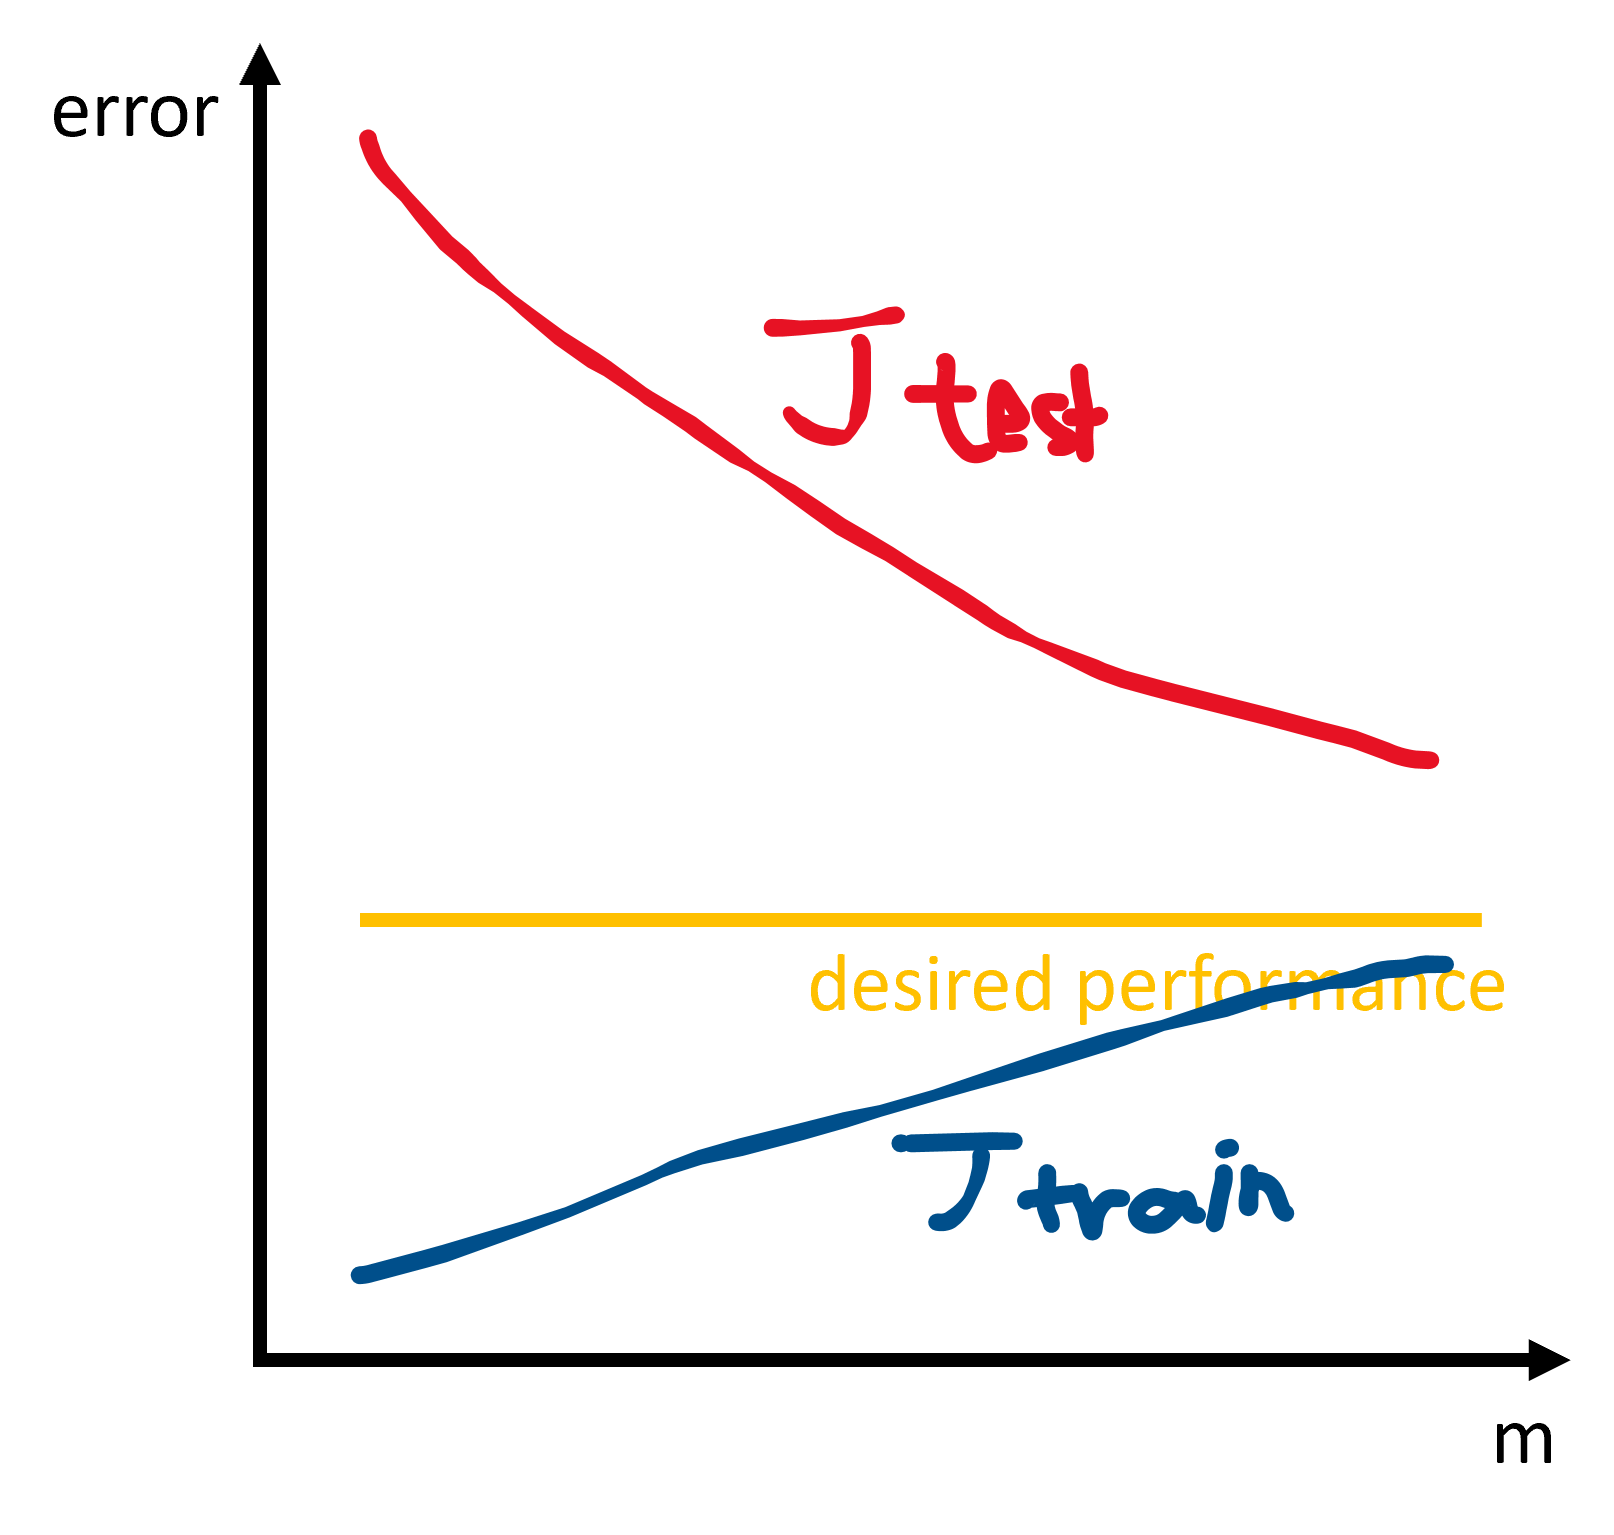
Plotting learning curves is a common way to diagnose bias/variance. In both cases, $J_{train}$ increases as the training set size grows larger, while $J_{test}$ decreases.
For underfitting/high bias:
- small training set size: $J_{train}(\theta)$ is low and $J_{test}(\theta)$ is high.
- large training set size: both $J_{train}(\theta)$ and $J_{test}(\theta)$ are high and $J_{train}(\theta) \approx J_{test}(\theta)$.
For overfitting/high variance:
- small training set size: $J_{train}(\theta)$ is low and $J_{test}(\theta)$ is high.
- large training set size: $J_{train}(\theta)$ increases and $J_{test}(\theta)$ decreases without levelling off. $J_{train}(\theta) < J_{test}(\theta)$ with a significant difference.
For bias/variance problems, solutions may be:
- high bias: add polynomials, add features, decrease $\lambda$
- high variance: collect more training examples, use smaller sets of features, increase $\lambda$

 浙公网安备 33010602011771号