GNU GDB
1 说明
本文主要介绍一些简单的、常用的gdb调试技巧。
环境:GNU gdb (GDB) Red Hat Enterprise Linux (7.2-60.el6_4.1)
参考文档:《gdb调试技巧》 作者不详
2 测试代码
#include <stdio.h>

int test_func2(void)
{
    int a = 1;
    int b = 2;

    return a + b;
}

void test_func1(int flag)
{
    int a[] = {0x12, 0x23, 0x43, 0x78};
    int b = 12;
    int i = 0;

    if (flag == 0) {
        return;
    }

    for (i = 0; i < sizeof(a)/sizeof(int); i++) {
        a[i] += b;
    }

    for (i = 0; i < sizeof(a)/sizeof(int); i++) {
        printf("%d\t", a[i]);
    }

    printf("\n");

    test_func2();

}

int main(void)
{
    test_func1(1);

    test_func2();

    return 0;
}
下面调试过程中的代码就是以上代码。
编译:gcc -g test_gdb.c (注:必须加上-g参数,表示在文件中加入调试信息)
3 调试步骤
3.1 与断点相关
| 操作 | 命令 |
|---|---|
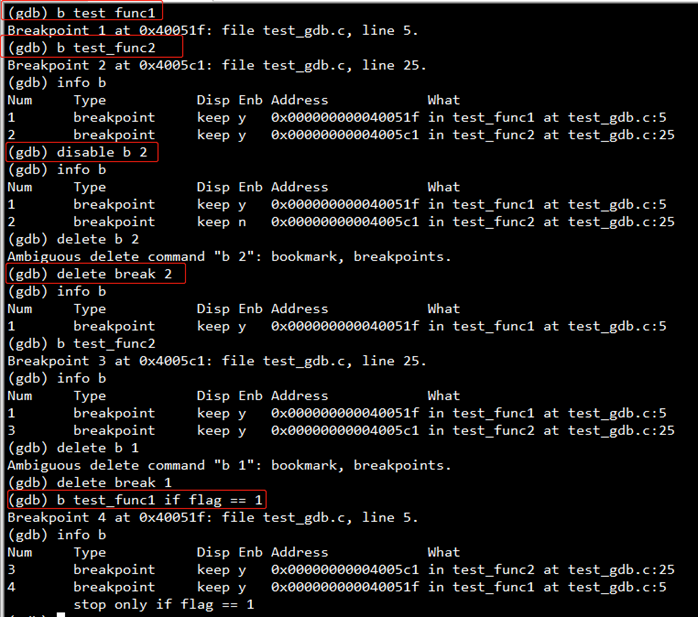
| 加入一个断点 | (gdb) b test_func1 (gdb) break test_func2 注:两种方式是等价的,一般简写为b |
| 加入一个断点并设置进入条件 | (gdb) b test_func1 if flag == 1 |
| 显示断点信息 | (gdb) info b (gdb) info breakpoints |
| 失能一个断点 | (gdb) disable b 2 注:disable了的停止点,GDB不会删除,需要时,enable即可。 |
| 使能一个断点 | (gdb) enable b 2 |
| 删除一个断点 | (gdb) delete break 2 |
3.2 运行与查看
| 操作 | 命令 |
|---|---|
| 运行程序 | (gdb) run (gdb) r |
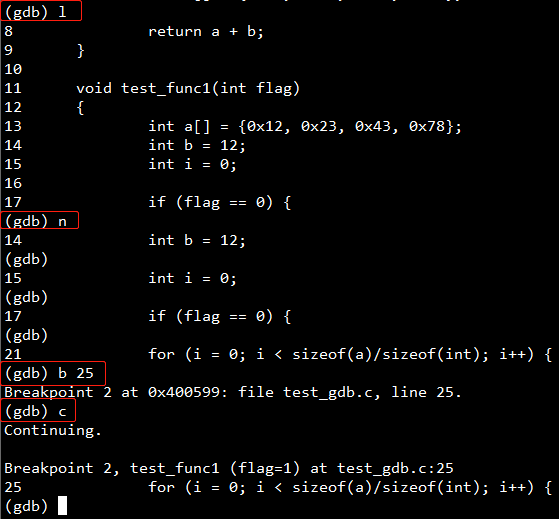
| 列出源代码 | (gdb) list (gdb) l |
| 单步调试 | (gdb) next (gdb) n |
| 单步跟踪,进入函数 | (gdb) step (gdb) s |
| 在指定行停住 | (gdb) b 25 |
| 继续运行 | (gdb) continue (gdb) c |
3.3 查看运行时的数据
| 操作 | 命令 |
|---|---|
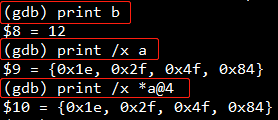
| 查看某一变量值 | (gdb) print b (gdb) print a[0] |
| 查看静态数组 | (gdb) print /x a 注:/x表示以十六进制显示 |
| 查看动态数组 | (gdb) print /x *a@4 注:@的左边是数组的首地址的值,也就是变量array所指向的内容,右边则是数据的长度 |
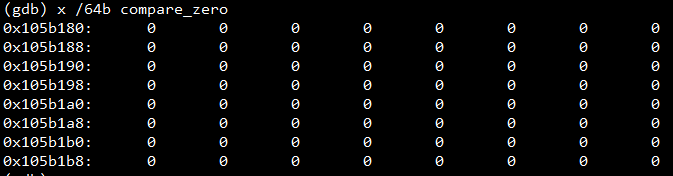
| 查看内存 | (gdb) x/4xh a 语法格式:x/<n/f/u> <addr> n、f、u是可选的参数。n是一个正整数,表示显示内存的长度,也就是说从当前地址向后显示几个地址的内容。f 表示显示的格式,参见上面。如果地址所指的是字符串,那么格式可以是s,如果地址是指令地址,那么格式可以是i。u 表示从当前地址往后请求的字节数,u参数可以用下面的字符来代替,b表示单字节,h表示双字节,w表示四字节,g表示八字节。 |
gdb数据显示格式:
| 格式 | 说明 |
|---|---|
| x | 按十六进制格式显示变量 |
| d | 按十进制格式显示变量 |
| u | 按十六进制格式显示无符号整型 |
| o | 按八进制格式显示变量 |
| t | 按二进制格式显示变量 |
| a | 按十六进制格式显示变量 |
| c | 按字符格式显示变量 |
| f | 按浮点数格式显示变量 |
查看数组a的内存的四个地址以十六进制显示,每个地址请求4个字节(因为数组成员定义为int):

查看数组compare_zero的内存的64个地址以十进制显示,每个地址请求单个字节。
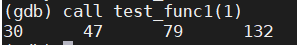
3.4 调用函数
格式:call 函数名(函数参数)
3.5 其它一些用法
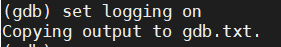
3.5.1 打开日志收集功能
格式:(gdb) set logging on
目的:将窗口中输出的debug相关的打印信息存放到日志中。
3.5.2 调试多线程
GDB调试多进程程序 - 面具下的戏命师 - 博客园 (cnblogs.com)
3.5 退出
直接使用quit命令就可退出调试。
4 补充
参考:https://github.com/SimpleSoft-2020/gdbdebug
4-6栈溢出核心转储core dump分析_哔哩哔哩_bilibili
启动调试并传入参数
- 启动gdb时带参数:gdb --args <exe-file>
- 运行gdb后带参数:set args <args>
- 运行gdb后带参数:r <args>
附加到进程
适用于程序已经启动:
- gdb attach <pid>
- gdb --pid <pid>
逐过程执行
单步执行(step-over),遇到函数跳过函数
- next
- n
逐语句执行
单步执行(step-into),遇到函数进入函数
- step
- s
退出当前函数
- finish
退出调试
- 分离,退出线程调试:detach
- 退出gdb:quit
- 退出gdb:q
断点
设置断点:
- 在源代码某一行设置断点:break/b <file name>:<line numnber>
- 为函数设置断点,同名函数也会同时设置:b <function name>
- 为满足正则表达式的函数设置断点:rb <regular expression>
- 设置条件断点:b <break points> <condition>,比如:b test_work if num==1,仅num=1时,test_work函数才停止
- 设置临时断点,仅执行一次:tb <break points>
查看断点:
- 查看所有断点:i b
- 查看某个断点:i b <断点编号>
禁用、启用断点:
- disable/enable <断点编号>
删除断点:
- 删除某个断点:delete <断点编号>
- 删除所有断点:delete
查看变量
-
查看函数参数:info <args>
-
查看变量的值:print 变量名
-
查看变量的值:p 变量名
-
设置字符串的显示规则:
-
优化显示格式:set print pretty
(gdb) p test1
$1 = {a = 305419896, c = -1 '\377', s = {a = -1430532899, s = -26232}}
(gdb) p /x test1
$2 = {a = 0x12345678, c = 0xff, s = {a = 0xaabbccdd, s = 0x9988}}
(gdb) set print pretty
(gdb) p /x test1
$3 = {
  a = 0x12345678,
  c = 0xff,
  s = {
    a = 0xaabbccdd,
    s = 0x9988
  }
}
-
-
显示结构体:set print array on
(gdb) p a $1 = {17, 34, 0 <repeats 18 times>} (gdb) p a $5 = {17, 34, 0 <repeats 18 times>} -
显示数组,使用gdb内嵌函数,比如sizeof函数、字符串操作函数
(gdb) p sizeof(a)
$6 = 80
修改变量的值
- 修改变量的值,包括普通变量、结构体、类等:print 变量名=值
(gdb) p a[0]
$8 = 17
(gdb) p a[0]=20
$9 = 20
(gdb) p a[0]
$10 = 20
查看/修改内存
- x /选项 内存地址
- x /s str
- x /d
- x /4d
- x /16s 结构体变量地址
(gdb) p itest
$2 = 305419896
(gdb) p &itest
$3 = (int *) 0x7fffffffe114
(gdb) x 0x7fffffffe114
0x7fffffffe114: 0x12345678
(gdb) x &itest
0x7fffffffe114: 0x12345678
(gdb) x /4b &itest
0x7fffffffe114: 0x78    0x56    0x34    0x12
(gdb) p test_str
$1 = 0x4005a0 "this is a test"

# 查看内存的值
(gdb) x /s test_str
0x4005a0:       "this is a test"
(gdb) x /10d  test_str
0x4005a0:       116     104     105     115     32      105     115     32
0x4005a8:       97      32
(gdb) x /10x  test_str
0x4005a0:       0x74    0x68    0x69    0x73    0x20    0x69    0x73    0x20
0x4005a8:       0x61    0x20

# 修改内存的值
(gdb) set (int)itest=110
(gdb) x /2d &itest
0x7fffffffe114: 110     0
查看寄存器
- i registers
- i r rdi
| 寄存器 | 函数参数 |
|---|---|
| rdi | 第一个参数 |
| rsi | 第二个参数 |
| rdx | 第三个参数 |
| rcx | 第四个参数 |
| r8 | 第五个参数 |
| r9 | 第六个参数 |
如果函数参数超过六个,则放在函数栈中。
Reading symbols from /home/C_study/gdb/gdbdebug/section6/section6...(no debugging symbols found)...done.
(gdb) i args
No symbol table info available.
(gdb) p age
No symbol table is loaded. Use the "file" command.
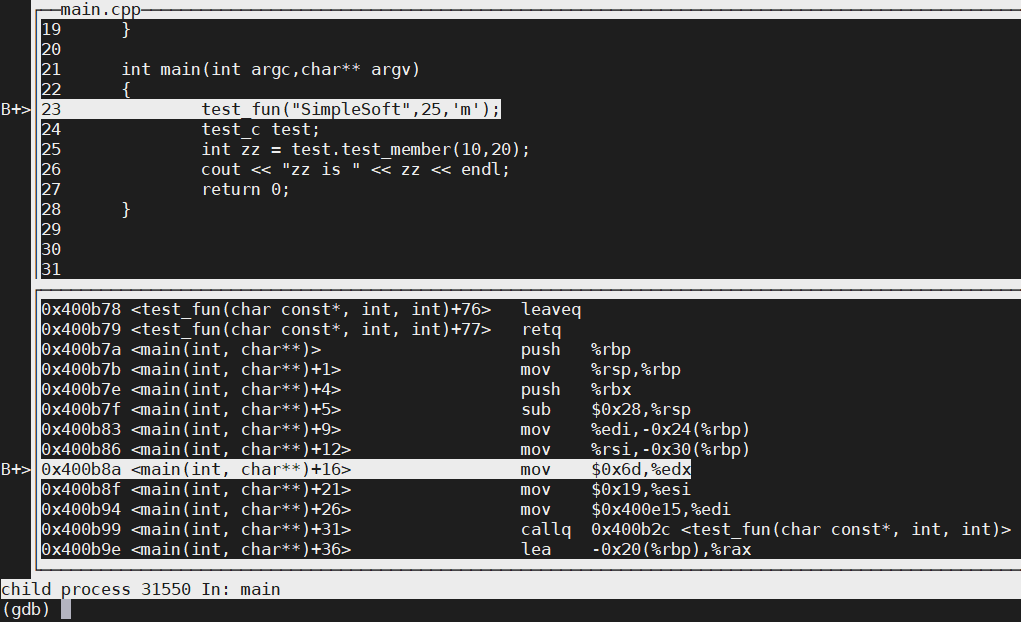
(gdb) i registers
rax 0x40072b 4196139
rbx 0x0 0
rcx 0x60 96
rdx 0x6d 109
rsi 0x19 25
rdi 0x400840 4196416
rbp 0x7fffffffe0c0 0x7fffffffe0c0
rsp 0x7fffffffe0c0 0x7fffffffe0c0
r8 0x7ffff75b5e80 140737343348352
r9 0x0 0
r10 0x7fffffffdae0 140737488345824
r11 0x7ffff7226f30 140737339617072
r12 0x4005f0 4195824
r13 0x7fffffffe1c0 140737488347584
r14 0x0 0
r15 0x0 0
rip 0x4006e1 0x4006e1 <test_fun(char const*, int, int)+4>
eflags 0x202 [ IF ]
cs 0x33 51
ss 0x2b 43
ds 0x0 0
es 0x0 0
fs 0x0 0
gs 0x0 0
(gdb) i r rdx # 查看第一个参数
rdx 0x6d 109
(gdb) i r rsi # 查看第二个参数
rsi 0x19 25
(gdb) i r rdi # 查看第三个参数,这是一个字符串
rdi 0x400840 4196416
(gdb) x /s 0x400840
0x400840: "SimpleSoft"
(gdb) p (char*)0x400840
$1 = 0x400840 "SimpleSoft"
修改寄存器
pc/rip (program counter)寄存器,保存程序下一条要执行的指令,通过修改pc寄存器来改变程序执行的流程。
- 修改寄存器:set var $pc=xxx
- 修改寄存器:p $rip=xxx
(gdb) info line 15  # 查看代码行汇编代码地址
Line 15 of "main.cpp"
   starts at address 0x400718 <test_fun(char const*, int, int)+59>
   and ends at 0x40071e <test_fun(char const*, int, int)+65>.
(gdb) p $rip=0x40071e # 修改pc寄存器值
$1 = (void (*)(void)) 0x40071e <test_fun(char const*, int, int)+65>
源代码查看/管理
- 显示源代码:list/l,默认显示10行
- 设置每次显示的行数:set listsize xx
- 查看指定函数代码:list test_func
- 查看执行文件指定行代码:list main.cpp:15
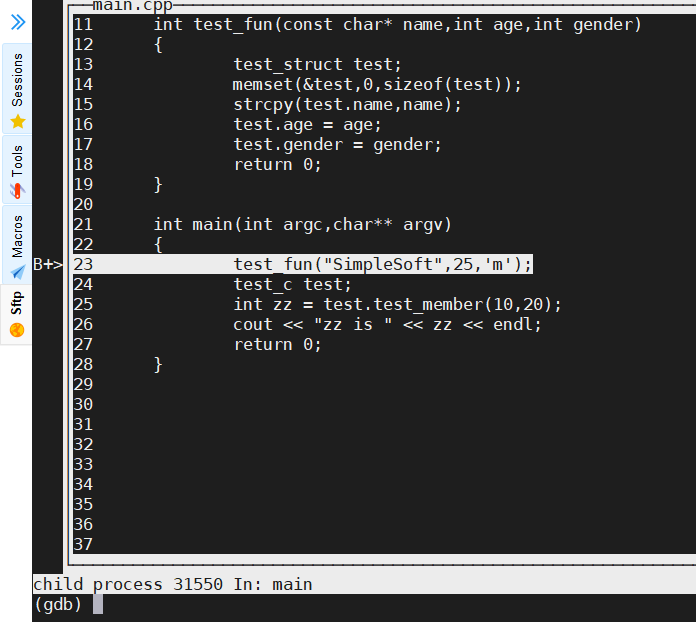
(gdb) r
Starting program: /home/C_study/gdb/gdbdebug/view_source/viewsource

Breakpoint 1, main (argc=1, argv=0x7fffffffe1b8) at main.cpp:23
23              test_fun("SimpleSoft",25,'m');
(gdb) list  # 默认显示当前行的往前5行,往后5行
18              return 0;
19      }
20
21      int main(int argc,char** argv)
22      {
23              test_fun("SimpleSoft",25,'m');
24              test_c test;
25              int zz = test.test_member(10,20);
26              cout << "zz is " << zz << endl;
27              return 0;
(gdb) l   # 继续往后显示
28      }
(gdb) l - # 往前显示
18              return 0;
19      }
20
21      int main(int argc,char** argv)
22      {
23              test_fun("SimpleSoft",25,'m');
24              test_c test;
25              int zz = test.test_member(10,20);
26              cout << "zz is " << zz << endl;
27              return 0;
(gdb) list test_fun  # 查看指定函数的代码
7               char name[12];
8               char gender;
9               int age;
10      };
11      int test_fun(const char* name,int age,int gender)
12      {
13              test_struct test;
14              memset(&test,0,sizeof(test));
15              strcpy(test.name,name);
16              test.age = age;
(gdb) l main.cpp:10  # 显示指定文件的指定行数
5       struct test_struct
6       {
7               char name[12];
8               char gender;
9               int age;
10      };
11      int test_fun(const char* name,int age,int gender)
12      {
13              test_struct test;
14              memset(&test,0,sizeof(test));
(gdb) l test_member
Function "test_member" not defined.
(gdb) set listsize 5 # 设置每次显示5行代码
(gdb) l main.cpp:10
8               char gender;
9               int age;
10      };
11      int test_fun(const char* name,int age,int gender)
12      {
搜索/查找源代码
- 搜索源代码:search 正则表达式
- 搜索源代码,往前搜索:forward-search 正则表达式
- 搜索源代码,往回搜索:reverse-search 正则表达式
- 设置源代码搜索目录:directory path
(gdb) search test # 搜索test匹配字符串
5       struct test_struct
(gdb) # 继续搜索,默认向前搜索
11      int test_fun(const char* name,int age,int gender)
(gdb) search fun
23              test_fun("SimpleSoft",25,'m');
(gdb) forward-search fun
11      int test_fun(const char* name,int age,int gender)
(gdb)
23              test_fun("SimpleSoft",25,'m');
(gdb)
Expression not found
(gdb) reverse-search fun  # 往回搜索
11      int test_fun(const char* name,int age,int gender)
(gdb) show directories # 查看源代码搜索路径
Source directories searched: $cdir:$cwd
(gdb) directory view_source2  # 增加搜索目录
Warning: /home/C_study/gdb/view_source2/view_source2: No such file or directory.
Source directories searched: /home/C_study/gdb/view_source2/view_source2:$cdir:$cwd
函数调用栈管理
栈帧:当程序进行函数调用时,函数的调用信息,比如调用的参数,局部变量,寄存器等信息。
调用栈:所有栈帧组成的信息,称为调用堆栈。
当函数开始执行时,只有一个栈帧(main),当调用其它函数时,会增加栈帧,当函数调用结束时,函数对应的栈帧也随之结束。
- 查看栈回溯信息:backtrack/bt
- 切换栈帧:frame n
- 查看栈帧信息:info f n
(gdb) bt  # 一个栈帧
#0  main (argc=1, argv=0x7fffffffe1b8) at main.cpp:14
(gdb) bt  # 二个栈帧
#0  call_test () at main.cpp:8
#1  0x0000000000400b5e in main (argc=1, argv=0x7fffffffe1b8) at main.cpp:14
(gdb) bt  # 三个栈帧
#0  test_child::test_member (this=0x7fffffffe090, x=10, y=20)
    at test_child.cpp:6
#1  0x0000000000400aef in call_test () at main.cpp:9
#2  0x0000000000400b5e in main (argc=1, argv=0x7fffffffe1b8) at main.cpp:14

(gdb) i args   # 查看当前栈帧的输入参数
this = 0x7fffffffe090
(gdb) frame 2  # 切换到第二个栈帧
#2  0x0000000000400ad9 in call_test () at main.cpp:8
8               test_child test;
(gdb) i args   # 查看第二个栈帧的输入参数
No arguments.
(gdb) i locals # 查看第二个栈帧的局部变量
test = {<test_c> = {_vptr.test_c = 0x2}, <No data fields>}
zz = 0
(gdb) info frame 0  # 查看0号栈帧的信息
Stack frame at 0x7fffffffe070:
 rip = 0x400be6 in test_c::test_c (test.cpp:3); saved rip 0x400bd0
 called by frame at 0x7fffffffe090
 source language c++.
 Arglist at 0x7fffffffe060, args: this=0x7fffffffe090
 Locals at 0x7fffffffe060, Previous frame's sp is 0x7fffffffe070
 Saved registers:
  rbp at 0x7fffffffe060, rip at 0x7fffffffe068
观察点
观测点:观察点时一个特殊的断点,当表达式的值发生变化时,它将中断下来。表达式可以是一个变量的值,也可以包含由运算符组合的一个或多个变量的值,例如'a+b',有时被称为数据断点。
- 写观察点,当变量的值发生变化,并被写的时候触发观察点:watch
- 读观察点:rwatch
- 读写观察点:awatch
- 查看观察点:info watch
- 删除/禁止/启用观察点:delete/disable/enable
(gdb) watch gdata  # 设置观察点,写gdata触发
Hardware watchpoint 1: gdata  # 通过硬件方式观察,不影响性能
(gdb) r
Hardware watchpoint 1: gdata

Old value = 0  # 触发断点,变量原始值
New value = 3  # 变量新的值
test_thread (data=0x7fffffffe08c) at main.cpp:13
13              gdata2 = 2 * (*temp);

(gdb) c
Continuing.
thread data:3
test thread exited
[Thread 0x7ffff6fd0700 (LWP 24679) exited]
[Switching to Thread 0x7ffff67cf700 (LWP 24680)]
Hardware watchpoint 1: gdata

Old value = 3
New value = 5
test_thread (data=0x7fffffffe07c) at main.cpp:13
13              gdata2 = 2 * (*temp);

(gdb) rwatch gdata  # 设置读watch
Hardware read watchpoint 1: gdata
(gdb) c
The program is not being run.
(gdb) r
Hardware read watchpoint 1: gdata

Value = 3
0x0000000000401051 in test_thread (data=0x7fffffffe08c) at main.cpp:14
14              cout << "thread data:" << gdata << endl;

(gdb) awatch gdata  # 设置读写观察点
Hardware access (read/write) watchpoint 1: gdata

(gdb) watch gdata thread 1  # 设置线程1的gdata watch
Hardware watchpoint 2: gdata

(gdb) info watchpoints  # 查看当前观察点
Num     Type           Disp Enb Address            What
2       hw watchpoint  keep y                      gdata thread 1
        stop only in thread 1

(gdb) watch gdata+gdata2 > 10  # 仅当gdata+gdata2大于10才停止
Hardware watchpoint 1: gdata+gdata2 > 10

(gdb) r
Hardware watchpoint 1: gdata+gdata2 > 10

Old value = false
New value = true
(gdb) p gdata
$1 = 5
(gdb) p gdata2
$2 = 6
捕获点
捕获点是一个特殊的断点,命令语法为:
- 捕获到event这个事件时,程序就会中断下来:catch event
catch assert -- Catch failed Ada assertions, when raised.
catch catch -- Catch an exception, when caught.
catch exception -- Catch Ada exceptions, when raised.
catch exec -- Catch calls to exec.
catch fork -- Catch calls to fork.
catch handlers -- Catch Ada exceptions, when handled.
catch load -- Catch loads of shared libraries.
catch rethrow -- Catch an exception, when rethrown.
catch signal -- Catch signals by their names and/or numbers.
catch syscall -- Catch system calls by their names, groups and/or numbers.
catch throw -- Catch an exception, when thrown.
catch unload -- Catch unloads of shared libraries.
catch vfork -- Catch calls to vfork.
为断点执行命令
-
为断点执行命令:
commands
cmd ...
end
-
保存断点信息到文件:save breakpoints filename
-
从文件中读取断点信息:source filename
(gdb) commands
Type commands for breakpoint(s) 1, one per line.
End with a line saying just "end".
>i args
>p test
>end
(gdb) info b
Num     Type           Disp Enb Address            What
1       breakpoint     keep y   0x0000000000400b8a in main(int, char**)
                                                   at main.cpp:23
        i args
        p test
(gdb) r
Starting program: /home/C_study/gdb/gdbdebug/view_source/viewsource

Breakpoint 1, main (argc=1, argv=0x7fffffffe1b8) at main.cpp:23
23              test_fun("SimpleSoft",25,'m');
argc = 1
argv = 0x7fffffffe1b8

(gdb) save breakpoints b.txt
Saved to file 'b.txt'.
(gdb) !cat b.txt
break main
  commands
    i args
    p test
  end

(gdb) source b.txt
Breakpoint 1 at 0x400b8a: file main.cpp, line 23.
(gdb) info b
Num     Type           Disp Enb Address            What
1       breakpoint     keep y   0x0000000000400b8a in main(int, char**)
                                                   at main.cpp:23
        i args
        p test
Text User Interface
| 命令 | 作用 |
|---|---|
| layout src | 显示源码窗口 |
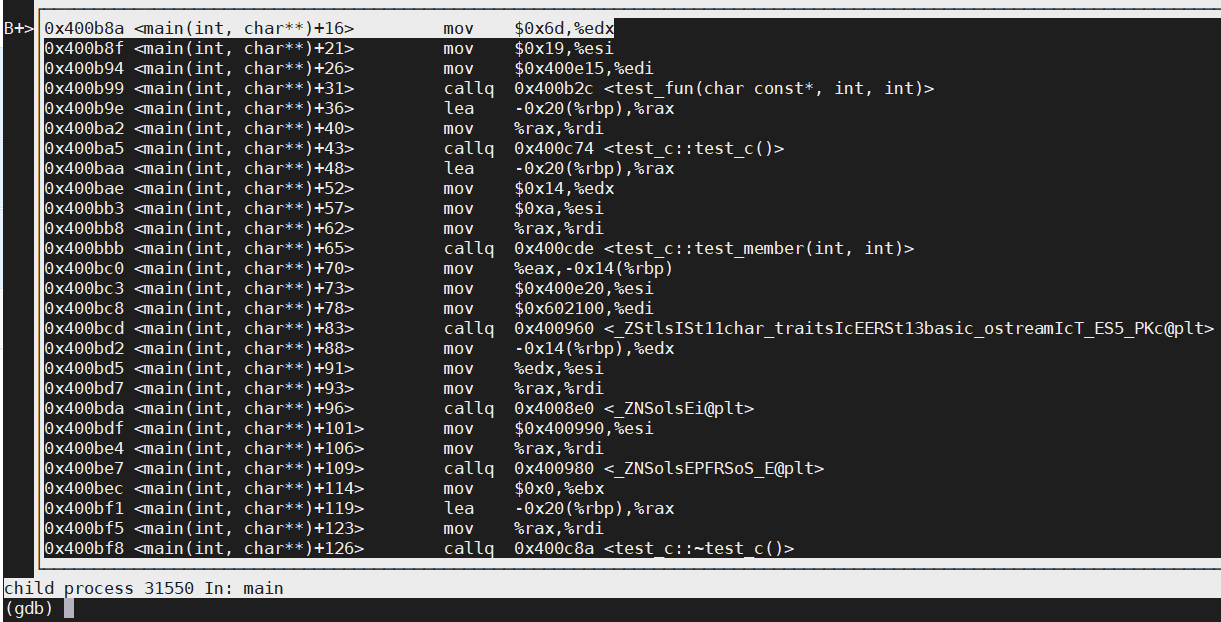
| layout asm | 显示汇编窗口 |
| layout reg | 显示寄存器窗口 |
| layout split | 切分窗口 |
| focus src/asm/reg | 切换窗口交点 |
| info win | 查看当前拥有交点的窗口 |
| ctrl+x+a | 退出窗口模式 |
(gdb) layout src
(gdb) layout asm
(gdb) layout split
(gdb) info win
        SRC     (15 lines)  <has focus>  # 当前交点在源码,按上下键切换的是源码
        ASM     (15 lines)
        CMD     (15 lines)

(gdb) focus cmd  # 交点切换到gdb命令窗口
Focus set to CMD window.
(gdb) info win
        SRC     (15 lines)
        ASM     (15 lines)
        CMD     (15 lines)  <has focus> # 当前交点在cmd,按上下键切换的是cmd
查看变量类型信息
比如查看结构体、类、派生类等
- whatis
- ptype /r /o /m /t
- i variables
- set print object on
(gdb) whatis test1 # 查看变量类型
type = test_1
(gdb) whatis test2
type = test_1 *
(gdb) whatis main # 查看函数类型
type = int (int, char **)
(gdb) ptype test1 # 查看变量类型
type = class test_1 {
private:
int x;
int *test;
int y;
public:
test_1(void);
~test_1(int);
virtual void test_fun(void);
}
(gdb) ptype /m test1 # /m参数,仅查看变量
type = class test_1 {
private:
int x;
int *test;
int y;
}
(gdb) set print object on
(gdb) ptype test2
type = /* real type = test_2 * */
class test_1 {
private:
int x;
int *test;
int y;
public:
test_1(void);
~test_1(int);
virtual void test_fun(void);
} *
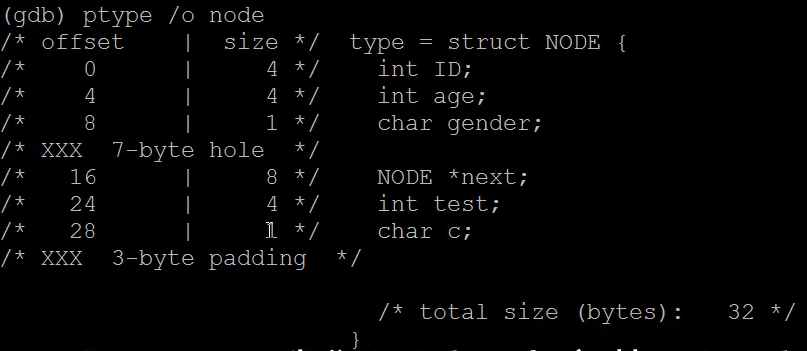
(gdb) ptype node2 # 查看结构体类型
type = struct NODE2 {
int ID;
int age;
NODE *next;
int test;
char gender;
char c;
}
(gdb) i variables count  # 查看全局变量或静态变量count在哪些地方定义
All variables matching regular expression "count":

File main.cpp:
int count;
线程管理相关命令
- 查看所有线程信息:info threads
- 查找线程(线程地址、线程名、线程ID):thread find 正则表达式
- 切换线程:thread thread-id
- 设置线程名字:thread name
- 为线程设置断点:b breakpoint thread id
- 为线程执行命令:thread apply
- 锁定线程:set scheduler-locking off | on | step
- 显示当前GDB检测到线程已经启动和退出时是否打印消息:show print thread-events
- 设置是否打印线程日志:set print thread-events on | off
(gdb) info threads
  Id   Target Id         Frame
  6    Thread 0x7ffff4fcc700 (LWP 13686) "multhread3" 0x00007ffff70c0aad in write () from /lib64/libc.so.6
  5    Thread 0x7ffff57cd700 (LWP 13685) "multhread3" 0x00007ffff70968ed in nanosleep () from /lib64/libc.so.6
  4    Thread 0x7ffff5fce700 (LWP 13684) "multhread3" 0x00007ffff70968ed in nanosleep () from /lib64/libc.so.6
  3    Thread 0x7ffff67cf700 (LWP 13683) "multhread3" 0x00007ffff70968ed in nanosleep () from /lib64/libc.so.6
  2    Thread 0x7ffff6fd0700 (LWP 13682) "multhread3" 0x00007ffff70968ed in nanosleep () from /lib64/libc.so.6
* 1    Thread 0x7ffff7fdd740 (LWP 13676) "multhread3" main (argc=1,
    argv=0x7fffffffe1b8) at main.cpp:54  # 前面有个*号,表示当前线程,0x7ffff7fdd740线程地址,LWP 13676线程ID(LSW表示轻量级进程,可以通过ps -aL命令查看)
(gdb) bt  # 查看的是当前线程的栈帧情况
#0  main (argc=1, argv=0x7fffffffe1b8) at main.cpp:54

(gdb) thread 2  # 切换到2号线程
[Switching to thread 2 (Thread 0x7ffff6fd0700 (LWP 13682))]
#0  0x00007ffff70968ed in nanosleep () from /lib64/libc.so.6
(gdb) bt  # 查看的是2号线程的栈帧
#0  0x00007ffff70968ed in nanosleep () from /lib64/libc.so.6
#1  0x00007ffff7096784 in sleep () from /lib64/libc.so.6
#2  0x00007ffff796c179 in std::this_thread::__sleep_for(std::chrono::duration<long, std::ratio<1l, 1l> >, std::chrono::duration<long, std::ratio<1l, 1000000000l> >) () from /lib64/libstdc++.so.6
#3  0x00000000004019ba in std::this_thread::sleep_for<long, std::ratio<1l, 1l> > (__rtime=...) at /usr/include/c++/4.8.2/thread:281
#4  0x0000000000401064 in test_thread (data=0x7fffffffe034) at main.cpp:35
#5  0x00000000004063ca in std::_Bind_simple<void (*(void*))(void*)>::_M_invoke<0ul>(std::_Index_tuple<0ul>) (this=0x60d040)
    at /usr/include/c++/4.8.2/functional:1732
#6  0x0000000000405f41 in std::_Bind_simple<void (*(void*))(void*)>::operator()() (this=0x60d040) at /usr/include/c++/4.8.2/functional:1720
#7  0x0000000000405da2 in std::thread::_Impl<std::_Bind_simple<void (*(void*))(void*)> >::_M_run() (this=0x60d028) at /usr/include/c++/4.8.2/thread:115
#8  0x00007ffff796c330 in ?? () from /lib64/libstdc++.so.6
#9  0x00007ffff7bc6ea5 in start_thread () from /lib64/libpthread.so.0
#10 0x00007ffff70cf9fd in clone () from /lib64/libc.so.6

(gdb) thread find multhread  # 通过名字查找线程
Thread 6 has target name 'multhread3'
Thread 5 has target name 'multhread3'
Thread 4 has target name 'multhread3'
Thread 3 has target name 'multhread3'
Thread 2 has target name 'multhread3'
Thread 1 has target name 'multhread3'
(gdb) thread find 13685  # 通过线程ID查找线程
Thread 5 has target id 'Thread 0x7ffff57cd700 (LWP 13685)'
(gdb) thread find 682    # 通过关键字查找
Thread 2 has target id 'Thread 0x7ffff6fd0700 (LWP 13682)'

(gdb) thread name main  # 更改当前线程名为main
* 2    Thread 0x7ffff6fd0700 (LWP 13682) "main" 0x00007ffff70968ed in nanosleep
    () from /lib64/libc.so.6

(gdb) b 28 thread 5  # 仅为5号线程设置断点
Breakpoint 2 at 0x401863: file main.cpp, line 28.
(gdb) c
Continuing.
Breakpoint 2, test::do_work_3 (this=0x60d820, arg=0x406742, x=10, y=20)
    at main.cpp:28
28                      cout << "thread do work 3 exited" << endl;

(gdb) thread apply 1 i args  # 查看1号线程的参数

Thread 1 (Thread 0x7ffff7fdd740 (LWP 20083)):
argc = 1
argv = 0x7fffffffe1b8

(gdb) thread apply 1 2 3 i args # 查看1 2 3号线程的参数

Thread 1 (Thread 0x7ffff7fdd740 (LWP 20777)):
argc = 1
argv = 0x7fffffffe1b8

Thread 2 (Thread 0x7ffff6fd0700 (LWP 20782)):
No symbol table info available.

Thread 3 (Thread 0x7ffff67cf700 (LWP 20783)):
No symbol table info available.

(gdb) thread apply 1-3 5 i locals  # 查看1 2 3 5号线程的局部变量

Thread 1 (Thread 0x7ffff7fdd740 (LWP 20777)):
data = 10
t2 = {_M_id = {_M_thread = 140737328772864}}
test3 = {_vptr.test = 0x406990 <vtable for test+16>}
t4 = {_M_id = {_M_thread = 140737311987456}}
test5 = {_vptr.test = 0x406990 <vtable for test+16>}
t1 = {_M_id = {_M_thread = 140737337165568}}
t3 = {_M_id = {_M_thread = 140737320380160}}
test4 = {_vptr.test = 0x406990 <vtable for test+16>}
t5 = {_M_id = {_M_thread = 0}}

(gdb) thread apply all i locals  # 查看所有线程的局部变量

Thread 5 (Thread 0x7ffff57cd700 (LWP 20785)):
No symbol table info available.

Thread 4 (Thread 0x7ffff5fce700 (LWP 20784)):
No symbol table info available.

Thread 3 (Thread 0x7ffff67cf700 (LWP 20783)):
No symbol table info available.

Thread 2 (Thread 0x7ffff6fd0700 (LWP 20782)):
No symbol table info available.

Thread 1 (Thread 0x7ffff7fdd740 (LWP 20777)):
data = 10
t2 = {_M_id = {_M_thread = 140737328772864}}
test3 = {_vptr.test = 0x406990 <vtable for test+16>}
t4 = {_M_id = {_M_thread = 140737311987456}}
test5 = {_vptr.test = 0x406990 <vtable for test+16>}
t1 = {_M_id = {_M_thread = 140737337165568}}
t3 = {_M_id = {_M_thread = 140737320380160}}
test4 = {_vptr.test = 0x406990 <vtable for test+16>}
t5 = {_M_id = {_M_thread = 0}}
(gdb) show print thread-events  # 查看线程打印事件状态
Printing of thread events is on.
(gdb) set print thread-events off  # 配置不打印线程日志信息,创建销毁线程不会打印
(gdb) set print thread-events on   # 配置打印线程日志信息,创建销毁线程会打印
(gdb) c
Continuing.
[Thread 0x7ffff67cf700 (LWP 29556) exited]
[Thread 0x7ffff5fce700 (LWP 29557) exited]
[Thread 0x7ffff6fd0700 (LWP 29555) exited]
[Thread 0x7ffff57cd700 (LWP 29558) exited]
[Thread 0x7ffff4fcc700 (LWP 29559) exited]
[Inferior 1 (process 29551) exited normally]
执行命令和结果输出
- 执行外部命令:shell | !
- 启用/禁止结果输出:set logging on | off
- 设置输出文件名:set logging file filename
- 覆盖输出文件,默认为追加:set logging overwrite
(gdb) !free
              total        used        free      shared  buff/cache   available
Mem:      131750728    47577404     3317536     1694880    80855788    81660672
Swap:       4194300     1446912     2747388
(gdb) shell ls
main.cpp  main.d  main.o  Makefile  multhread4

(gdb) set logging on  # 设置输出信息到文件,默认是gdb.txt
Copying output to gdb.txt.
(gdb) set logging off
(gdb) set logging file debug.txt  # 设置输出文件名
(gdb) set logging on  # 设置输出信息到文件debug.txt
Copying output to debug.txt.
(gdb) set logging off
Done logging to debug1.txt.
(gdb) set logging overwrite # 设置输出文件内容为覆盖
(gdb) set logging on
Copying output to debug1.txt.
(gdb) !cat debug1.txt
(gdb)
跳转执行代码jump
- jump location
- j location
即在指定位置恢复执行,如果存在断点,执行到指定位置时将中断下来。如果没有断点,则不会停下来,因此我们通常会在指定位置设置一个断点。
跳转指令不会更改当前堆栈帧、堆栈指针、程序计数器以外的任何寄存器,最好不要跳转到其它函数。
(gdb) p name  # 当前在19行
$1 = '\000' <repeats 99 times>
(gdb) info line 12  # 查看12行的地址
Line 12 of "main.cpp" starts at address 0x4008e1 <main(int, char**)+25>
   and ends at 0x4008e8 <main(int, char**)+32>.
(gdb) p $pc=0x4008e1  # 修改pc指针,指向12行
$2 = (void (*)(void)) 0x4008e1 <main(int, char**)+25>
(gdb) n  # 从13行开始执行
13              char name[100]={0};

(gdb) c  # 继续执行,当前在19行
Continuing.
name=SimpleSoft,age=25

Breakpoint 1, main (argc=1, argv=0x7fffffffe1b8) at main.cpp:19
19              return 0;
(gdb) b 12 # 在12行设置断点
Breakpoint 2 at 0x4008e1: file main.cpp, line 12.
(gdb) jump 12  # 跳转到12行执行
Continuing at 0x4008e1.
Breakpoint 2, main (argc=1, argv=0x7fffffffe1b8) at main.cpp:12
12              int age = 25;

(gdb) l
14      test_label:
15              strcpy(name,"SimpleSoft");
16              test_work(name,age);
17              memset(name,0,sizeof(name));
18              age = 0;
19              return 0;
20      }
(gdb) jump test_label  # 跳转到test_label处,然后继续执行
Continuing at 0x400905.
name=SimpleSoft,age=0
Breakpoint 1, main (argc=1, argv=0x7fffffffe1b8) at main.cpp:19
19              return 0;
方向执行undo
- 反向执行的开始处:record
- 反向执行一行,遇到函数跳过不进入:rn(reverse-next)
- 反向执行一行,遇到函数跳过进入:rs(reverse-step)
- 反向执行多行,直到回退到record命令处:rc(reverse-continue)
- 反向执行结束,直接反向到开始执行record命令处:reverse-finish
- 结束record命令:record stop
注:反向执行对文件IO是无效的。
(gdb)  # 当前在11行
11              int b=0;
(gdb) record   # 执行撤销之前,需要先执行record
(gdb) n  # 下一步
12              int c=0;
(gdb) n # 下一步
13              g1=10;
(gdb) # 下一步
14              g2=20;
(gdb) rn  # 撤销,执行13行
13              g1=10;
(gdb)     # 撤销,执行12行
12              int c=0;

(gdb) reverse-finish  # 反向执行到record命令执行的地方
Run back to call of #0  test1 () at main.cpp:12
No more reverse-execution history.
test1 () at main.cpp:11
11              int b=0;

(gdb) record stop  # 结束反向执行
Process record is stopped and all execution logs are deleted.
(gdb) rn  # 执行无效
Target child does not support this command.

(gdb) c
Continuing.
call test1
Breakpoint 2, test1 () at main.cpp:8
8               g1=5;
(gdb) record  # 在8行开始记录反向执行
(gdb) n
9               g2=6;
(gdb)
10              int a=0;
(gdb)
11              int b=0;
(gdb)
12              int c=0;
(gdb)
13              g1=10;
(gdb)
14              g2=20;
(gdb) rc   # 反向执行到第8行
Continuing.
No more reverse-execution history.
test1 () at main.cpp:8
8               g1=5;

(gdb) reverse-finish  # 反向执行结束,直接反向到开始执行record命令处
Run back to call of #0  test1 () at main.cpp:14

No more reverse-execution history.
test1 () at main.cpp:8
8               g1=5;
调试父子进程
(gdb) b 18  # 在18行加断点,这里只有子进程才会执行到
Breakpoint 1 at 0x4009a7: file main.cpp, line 18.
(gdb) set follow-fork-mode child  # 调试子进程,默认是父进程
(gdb) show follow-fork-mode  # 查看当前fork模式,是子进程
Debugger response to a program call of fork or vfork is "child".
(gdb) r
Starting program: /home/C_study/gdb/gdbdebug/fork-section/./fork-section
[Thread debugging using libthread_db enabled]
Using host libthread_db library "/lib64/libthread_db.so.1".
begin fork
[Attaching after process 18513 fork to child process 18513]
[New inferior 2 (process 18513)]
[Detaching after fork from parent process 18508]
[Inferior 1 (process 18508) detached]
after fork,pid is 18513
Parent data is 101
My pid is 18508,child pid is 18513*****  # 父进程执行结束

[Thread debugging using libthread_db enabled]
Using host libthread_db library "/lib64/libthread_db.so.1".
after fork,pid is 0
[Switching to Thread 0x7ffff7fdd740 (LWP 18513)]  # 子进程ID是18513
Breakpoint 1, main (argc=1, argv=0x7fffffffe1b8) at main.cpp:18
18                      data++;
Missing separate debuginfos, use: debuginfo-install glibc-2.17-324.el7_9.x86_64 libgcc-4.8.5-44.el7.x86_64 libstdc++-4.8.5-44.el7.x86_64
(gdb) call (int)getpid()  # 查看子进程ID
$1 = 18513
(gdb) n
19                      cout << "Child data is " << data << endl;
(gdb) i locals
data = 101
pid = 0

(gdb) b 18  # 子进程运行代码
Breakpoint 1 at 0x4009a7: file main.cpp, line 18.
(gdb) b 26  # 父进程运行代码
Breakpoint 2 at 0x400a53: file main.cpp, line 26.
(gdb) set follow-fork-mode child  # 设置调试子进程
(gdb) set detach-on-fork off  # 子进程调试结束后,调试父进程

(gdb) i inferiors  # 查看被调试的子进程,这两个进程是gdb的子进程
  Num  Description       Executable
* 2    process 22584     /home/C_study/gdb/gdbdebug/fork-section/./fork-section
  1    process 22580     /home/C_study/gdb/gdbdebug/fork-section/./fork-section

(gdb) i locals  # 查看的是当前进程(2号)的变量
data = 100
pid = 0
(gdb) i args # 查看的是当前进程(2号)的变量
argc = 1
argv = 0x7fffffffe1b8
(gdb) inferior 1  # 切换到1号进程
[Switching to inferior 1 [process 22580] (/home/C_study/gdb/gdbdebug/fork-section/./fork-section)]
[Switching to thread 1 (process 22580)]
#0  0x00007ffff7096a02 in fork () from /lib64/libc.so.6
(gdb) bt  # 查看的是1号进程的栈信息
#0  0x00007ffff7096a02 in fork () from /lib64/libc.so.6
#1  0x0000000000400967 in main (argc=1, argv=0x7fffffffe1b8) at main.cpp:13

(gdb) c  # 当前进程结束
Continuing.
Parent data is 101
My pid is 22580,child pid is 22584*****
[Inferior 1 (process 22580) exited normally]
(gdb) i inferiors #  查看进程信息
  Num  Description       Executable
  2    process 22584     /home/C_study/gdb/gdbdebug/fork-section/./fork-section
* 1    <null>            /home/C_study/gdb/gdbdebug/fork-section/./fork-section
调试多进程
inferior:gdb用inferior来表示一个被调试进程的状态,通常情况下,一个inferior代表一个进程,一个inferior仅能调试一个进程,这是gdb内部的概念和对象。
- i inferiors
- inferior [id]
- add-inferior
- remove-inferior
- attach pid
- detach inferior [id]
- set schedule-multiple on
- show schedule-multiple
(gdb) i inferiors  # gdb调试启动时,默认有一个inferior
  Num  Description       Executable
* 1    <null>            /home/C_study/gdb/gdbdebug/patch-section/./patch-section
(gdb) r # 启动程序
Starting program: /home/C_study/gdb/gdbdebug/patch-section/./patch-section

Breakpoint 1, 0x00000000004007f1 in main ()
Missing separate debuginfos, use: debuginfo-install glibc-2.17-324.el7_9.x86_64 libgcc-4.8.5-44.el7.x86_64 libstdc++-4.8.5-44.el7.x86_64
(gdb) i inferiors # 当前进程就是一个inferior调试对象
  Num  Description       Executable
* 1    process 31040     /home/C_study/gdb/gdbdebug/patch-section/./patch-section
$ gdb  # 仅启动gdb
(gdb) i inferiors  # 默认inferior为空
  Num  Description       Executable
* 1    <null>
(gdb) attach 3679  # attach一个进程当作inferior
(gdb) i inferiors  # 当前inferior为attach的进程
  Num  Description       Executable
* 1    process 3679      /usr/bin/gdb
gdb) bt  # 当前线程的堆栈信息
#0  0x00007fccd6f47cb0 in __poll_nocancel () from /lib64/libc.so.6
#1  0x00000000005e4463 in gdb_wait_for_event ()
#2  0x00000000005e4bda in gdb_do_one_event ()
#3  0x00000000005e4e17 in start_event_loop ()
#4  0x00000000005ddc43 in captured_command_loop ()
#5  0x00000000005dc42a in catch_errors ()
#6  0x00000000005de906 in captured_main ()
#7  0x00000000005dc42a in catch_errors ()
#8  0x00000000005df544 in gdb_main ()
#9  0x000000000045794e in main ()
(gdb) inferior 1  # 切换到1号进程

(gdb) show schedule-multiple
Resuming the execution of threads of all processes is off.
(gdb) set schedule-multiple on  # 设置两个线程都执行,也就是gdb中被调试进程,和正在运行的进程(两个窗口)
(gdb) show schedule-multiple
Resuming the execution of threads of all processes is on.
(gdb) detach inferiors 1  # detach进程,退出调试
直接调用函数
- p 表达式:求表达式的值并显示结果值。表达式可以包括对正在调试的程序中的函数的调用,即使函数返回值是void,也会显示。
- call 表达式:求表达式的值并显示结果值,如果是函数调用,返回值是void的话,不显示void返回值。
(gdb) l -
4       int test(int x,int y)
5       {
6               cout << "x=" << x << "y=" << y << endl;
7               return x + y;
8       }
(gdb) l -
9       void fun(int x)
10      {
11              cout << "x=" << x << endl;
12      }
(gdb) call test(10, 20)
x=10y=20
$1 = 30
(gdb) call fun(30)
x=30

(gdb) p test(10,20)
x=10y=20
$2 = 30
(gdb) p fun(30)
x=30
$3 = void

(gdb) call malloc(10)  # 调用系统函数
$5 = 6299696
(gdb) call strcpy($5, "soft") # 调用系统函数
$7 = 6299696
(gdb) x /s 6299696
0x602030:       "soft"
tion...(no debugging symbols found)...done.  # 生成的程序没有调试信息
(gdb) b main
Breakpoint 1 at 0x40095d
(gdb) l
No symbol table is loaded.  Use the "file" command.
(gdb) call test(10, 20)  # 没调试信息,也可以执行call命令
x=10y=20
$1 = 30
(gdb) set $tmp = malloc(4)
(gdb) ptype $tmp
type = int
(gdb) call tmp_func($tmp)
断点相关-skip
- 跳过函数:skip function
- 跳过文件的所有函数:skip file filenam
- 跳过common目录下的所有cpp文件:skip -gfi common/*.cpp
(gdb) skip test_c::get_number()  # 跳过函数,不进入函数,但是还是会执行
Function test_c::get_number() will be skipped when stepping.

(gdb) skip file test.cpp  # 跳过整个文件的函数,单步不进入函数
File test.cpp will be skipped when stepping.
发行版(Release)
制作发行版第一种方法:Makefile去掉-g参数,make一个版本,同时再需要一个带有-g参数的版本。
$ make -f DebugMake  # 生成Debug版本程序
$ mak 				 # 生成不带debug的版本
制作发行版第二种方法:默认生成带debug信息的版本,再使用strip命令去掉调试信息
$ mak 				 				# 生成带debug的版本
$ strip -g release-debug -o release # 去除debug信息,输出为release
Reading symbols from /home/C_study/gdb/gdbdebug/release-section/release...(no debugging symbols found)...done. # 没有调试信息
(gdb) l  # 没有调试信息
No symbol table is loaded.  Use the "file" command.
(gdb)
调试第一种方法:
$ gdb --symbol=release-debug -exec=release  # 导入调试符号
Reading symbols from /home/C_study/gdb/gdbdebug/release-section/release-debug...done.  # 调试符号来自release-debug
调试第二种方法:
# 先使用objcopy命令生成符号文件
$ objcopy --only-keep-debug release-debug debug.sym
# 再使用gdb导入调试符号
$ gdb --symbol=debug.sym -exec=release
Reading symbols from /home/C_study/gdb/gdbdebug/release-section/debug.sym...done.

(gdb) generate-core-file rel.core  # 生成core dump文件
Saved corefile rel.core
$ gdb release rel.core  # 直接调试发行版的core dump文件也没有debug信息
Reading symbols from /home/C_study/gdb/gdbdebug/release-section/release...(no debugging symbols found)...done.
(gdb) i locals
No symbol table info available.

$ gdb release-debug rel.core  # 加载调试版本,调试core文件
Reading symbols from /home/C_study/gdb/gdbdebug/release-section/release-debug...done.
Using host libthread_db library "/lib64/libthread_db.so.1".
Core was generated by `/home/C_study/gdb/gdbdebug/release-section/./release'.
(gdb) l
288     */
289     void ShowTree(BST<int>& btree)
290     {
291             cout << "当前二叉树为:" << endl;
292             btree.Inorder(btree.root);
293             cout << endl;
294     }
295     int main()
296     {
297             int a[] = { 63, 90, 70, 55, 67, 42, 98 };
(gdb) bt
#0  0x00007ffff70c0a30 in __read_nocancel () from /lib64/libc.so.6
#1  0x00007ffff704cd54 in __GI__IO_file_underflow () from /lib64/libc.so.6
#2  0x00007ffff704df22 in __GI__IO_default_uflow () from /lib64/libc.so.6
#3  0x00007ffff70488fa in getchar () from /lib64/libc.so.6
#4  0x0000000000400ed0 in main () at main.cpp:331
修改可执行文件
源代码:
$ more main.cpp
#include <iostream>
#include <cstring>
using namespace std;
int check_some()
{
        int x=100;
        return x;
}

int main(int argc,char** argv)
{
        if(check_some() == 100)
        {
                cout << "check failed!" << endl;
                return 1;
        }
        else
        {
                cout << "check successfully!" << endl;
        }
        //do somethings

        return 0;
}
更改check_some函数中的x的值:
$ ./patch-section
check failed!

$ gdb --write patch-section  # 需要加--write参数
Reading symbols from /home/zhengzhiqiang/C_study/gdb/gdbdebug/patch-section/patch-section...done.
(gdb) disassemble /mr check_some
Dump of assembler code for function check_some():
5       {
   0x00000000004007dd <+0>:     55      push   %rbp
   0x00000000004007de <+1>:     48 89 e5        mov    %rsp,%rbp

6               int x=100;
   0x00000000004007e1 <+4>:     c7 45 fc 64 00 00 00    movl   $0x64,-0x4(%rbp)

7               return x;
   0x00000000004007e8 <+11>:    8b 45 fc        mov    -0x4(%rbp),%eax

8       }
   0x00000000004007eb <+14>:    5d      pop    %rbp
   0x00000000004007ec <+15>:    c3      retq

End of assembler dump.

(gdb) p {unsigned char}0x00000000004007e4=0x65  # 0x00000000004007e4地址的值更改值为0x65
$1 = 101 'e'
(gdb) disassemble /mr check_some
Dump of assembler code for function check_some():
5       {
   0x00000000004007dd <+0>:     55      push   %rbp
   0x00000000004007de <+1>:     48 89 e5        mov    %rsp,%rbp

6               int x=100;
   0x00000000004007e1 <+4>:     c7 45 fc 65 00 00 00    movl   $0x65,-0x4(%rbp)

7               return x;
   0x00000000004007e8 <+11>:    8b 45 fc        mov    -0x4(%rbp),%eax

8       }
   0x00000000004007eb <+14>:    5d      pop    %rbp
   0x00000000004007ec <+15>:    c3      retq

End of assembler dump.
(gdb) q  # 更改完之后退出程序,不能运行,否则更改无效
$ ./patch-section
check successfully!
更改main函数:
$ gdb --write patch-section  # 需要加--write参数
Reading symbols from /home/zhengzhiqiang/C_study/gdb/gdbdebug/patch-section/patch-section...done.
(gdb) disassemble /mr main
Dump of assembler code for function main(int, char**):
11      {
   0x00000000004007ed <+0>:     55      push   %rbp
   0x00000000004007ee <+1>:     48 89 e5        mov    %rsp,%rbp
   0x00000000004007f1 <+4>:     48 83 ec 10     sub    $0x10,%rsp
   0x00000000004007f5 <+8>:     89 7d fc        mov    %edi,-0x4(%rbp)
   0x00000000004007f8 <+11>:    48 89 75 f0     mov    %rsi,-0x10(%rbp)

12              if(check_some() == 100)
   0x00000000004007fc <+15>:    e8 dc ff ff ff  callq  0x4007dd <check_some()>
   0x0000000000400801 <+20>:    83 f8 64        cmp    $0x64,%eax
   0x0000000000400804 <+23>:    0f 94 c0        sete   %al
   0x0000000000400807 <+26>:    84 c0   test   %al,%al
   0x0000000000400809 <+28>:    74 23   je     0x40082e <main(int, char**)+65>

13              {
14                      cout << "check failed!" << endl;
   0x000000000040080b <+30>:    be 40 09 40 00  mov    $0x400940,%esi
   0x0000000000400810 <+35>:    bf 60 10 60 00  mov    $0x601060,%edi
   0x0000000000400815 <+40>:    e8 a6 fe ff ff  callq  0x4006c0 <_ZStlsISt11char_traitsIcEERSt13basic_ostreamIcT_ES5_PKc@plt>
   0x000000000040081a <+45>:    be e0 06 40 00  mov    $0x4006e0,%esi
   0x000000000040081f <+50>:    48 89 c7        mov    %rax,%rdi
   0x0000000000400822 <+53>:    e8 a9 fe ff ff  callq  0x4006d0 <_ZNSolsEPFRSoS_E@plt>

15                      return 1;
   0x0000000000400827 <+58>:    b8 01 00 00 00  mov    $0x1,%eax
   0x000000000040082c <+63>:    eb 21   jmp    0x40084f <main(int, char**)+98>

16              }
17              else
18              {
19                      cout << "check successfully!" << endl;
   0x000000000040082e <+65>:    be 4e 09 40 00  mov    $0x40094e,%esi
   0x0000000000400833 <+70>:    bf 60 10 60 00  mov    $0x601060,%edi
   0x0000000000400838 <+75>:    e8 83 fe ff ff  callq  0x4006c0 <_ZStlsISt11char_traitsIcEERSt13basic_ostreamIcT_ES5_PKc@plt>
   0x000000000040083d <+80>:    be e0 06 40 00  mov    $0x4006e0,%esi
   0x0000000000400842 <+85>:    48 89 c7        mov    %rax,%rdi
   0x0000000000400845 <+88>:    e8 86 fe ff ff  callq  0x4006d0 <_ZNSolsEPFRSoS_E@plt>
20              }
21              //do somethings
22
23              return 0;
   0x000000000040084a <+93>:    b8 00 00 00 00  mov    $0x0,%eax

24      }
   0x000000000040084f <+98>:    c9      leaveq
   0x0000000000400850 <+99>:    c3      retq

End of assembler dump.
(gdb) p {unsigned char}0x0000000000400803=0x65
$1 = 101 'e'

$ ./patch-section
check successfully!

(gdb) info functions  # 查看有哪些函数
All defined functions:

File main.cpp:
int check_some();
int main(int, char**);
... ...
内存泄漏检查
- call malloc_stats
源代码:
$ more main.cpp
#include <malloc.h>
#include <string.h>
#include <thread>
#include <iostream>
#include <vector>
#include <string>
#include <assert.h>
using namespace std;

void test_malloc_leak(int size)
{
        malloc(1024);
}
void no_leak()
{
        void *p=malloc(1024*1024*10);
        free(p);
}
int main(int argc,char* argv[])
{
        no_leak();
        test_malloc_leak(1024);
        return 0;
}
(gdb) b 16
(gdb) r
Breakpoint 1, no_leak () at main.cpp:16
16              void *p=malloc(1024*1024*10);
(gdb) call malloc_stats()
Arena 0:
system bytes     =          0
in use bytes     =          0
Total (incl. mmap):
system bytes     =          0
in use bytes     =          0
max mmap regions =          0
max mmap bytes   =          0
$2 = -147222080
(gdb) n  # 调用malloc,分配10M内存
17              free(p);
(gdb) call malloc_stats()
Arena 0:
system bytes     =          0
in use bytes     =          0
Total (incl. mmap):
system bytes     =   10489856  # 系统空间
in use bytes     =   10489856  # 可以看出,分配了10M,用户空间
max mmap regions =          1
max mmap bytes   =   10489856
$3 = -147222080
(gdb) n  # 释放malloc分配的内存
18      }
(gdb) call malloc_stats()
Arena 0:
system bytes     =          0
in use bytes     =          0
Total (incl. mmap):
system bytes     =          0
in use bytes     =          0
max mmap regions =          1
max mmap bytes   =   10489856
$4 = -147222080
(gdb) n  # 分配内存
main (argc=1, argv=0x7fffffffe1a8) at main.cpp:22
22              test_malloc_leak(1024);
(gdb)
23              return 0;
(gdb) call malloc_stats()
Arena 0:
system bytes     =     135168
in use bytes     =       1040
Total (incl. mmap):
system bytes     =     135168
in use bytes     =       1040  # 分配1024,占用1040,因为有链表占用空间
max mmap regions =          1
max mmap bytes   =   10489856
$5 = -147222080
内存检查
使用GCC编译选项来检查内存泄漏,大型程序常使用。
gcc选项:-fsanitize=address
- 检查内存泄漏
- 检查堆溢出
- 检查栈溢出
- 检查全局内存溢出
- 检查释放后再使用(野指针)
源代码:
#include <stdlib.h>
#include <iostream>
#include <string.h>
using namespace std;
void new_test()
{
	int *test = new int[80];
	test[0]=0;
}
void malloc_test()
{
	int *test =(int*) malloc(100);
	test[0]=0;
}
void heap_buffer_overflow_test()
{
	char *test = new char[10];
	const char* str = "this is a test string";
	strcpy(test,str);
	delete []test;

}
void stack_buffer_overflow_test()
{
	int test[10];
	test[1]=0;
	int a = test[13];
	cout << a << endl;

}
int global_data[100] = {0};
void global_buffer_overflow_test()
{
	int data = global_data[102];
	cout << data << endl;

}
void use_after_free_test()
{
	char *test = new char[10];
	strcpy(test,"this test");
	delete []test;
	char c = test[0];
	cout << c << endl;
}
- 测试内存泄漏
int main()
{
	new_test();
	malloc_test();
	return 0;
}
$ make clean;make;./memcheck-section
g++  -g -fsanitize=address -Wall -O0 -I. -I. -MMD  -c -o main.o main.cpp
g++ -fsanitize=address -o memcheck-section main.o

=================================================================
==3289==ERROR: LeakSanitizer: detected memory leaks

Direct leak of 320 byte(s) in 1 object(s) allocated from:
    #0 0x7f8397c966b2 in operator new[](unsigned long) (/usr/lib/x86_64-linux-gnu/libasan.so.2+0x996b2)
    #1 0x400ec7 in new_test() /home/share/gdbdebug-master/memcheck-section/main.cpp:7
    #2 0x401219 in main /home/share/gdbdebug-master/memcheck-section/main.cpp:48
    #3 0x7f83974d183f in __libc_start_main (/lib/x86_64-linux-gnu/libc.so.6+0x2083f)

Direct leak of 100 byte(s) in 1 object(s) allocated from:
    #0 0x7f8397c95602 in malloc (/usr/lib/x86_64-linux-gnu/libasan.so.2+0x98602)
    #1 0x400f21 in malloc_test() /home/share/gdbdebug-master/memcheck-section/main.cpp:12
    #2 0x40121e in main /home/share/gdbdebug-master/memcheck-section/main.cpp:49
    #3 0x7f83974d183f in __libc_start_main (/lib/x86_64-linux-gnu/libc.so.6+0x2083f)

SUMMARY: AddressSanitizer: 420 byte(s) leaked in 2 allocation(s).
- 检测堆溢出问题
int main()
{
	heap_buffer_overflow_test();
	return 0;
}
$ make clean;make;./memcheck-section
g++  -g -fsanitize=address -Wall -O0 -I. -I. -MMD  -c -o main.o main.cpp
g++ -fsanitize=address -o memcheck-section main.o
=================================================================
==3334==ERROR: AddressSanitizer: heap-buffer-overflow on address 0x60200000effa at pc 0x7f8d1ece4709 bp 0x7ffc14173c30 sp 0x7ffc141733d8
WRITE of size 22 at 0x60200000effa thread T0
    #0 0x7f8d1ece4708  (/usr/lib/x86_64-linux-gnu/libasan.so.2+0x62708)
    #1 0x400f9a in heap_buffer_overflow_test() /home/share/gdbdebug-master/memcheck-section/main.cpp:19
    #2 0x401219 in main /home/share/gdbdebug-master/memcheck-section/main.cpp:50
    #3 0x7f8d1e55683f in __libc_start_main (/lib/x86_64-linux-gnu/libc.so.6+0x2083f)
    #4 0x400de8 in _start (/home/share/gdbdebug-master/memcheck-section/memcheck-section+0x400de8)

0x60200000effa is located 0 bytes to the right of 10-byte region [0x60200000eff0,0x60200000effa)
allocated by thread T0 here:
    #0 0x7f8d1ed1b6b2 in operator new[](unsigned long) (/usr/lib/x86_64-linux-gnu/libasan.so.2+0x996b2)
    #1 0x400f7b in heap_buffer_overflow_test() /home/share/gdbdebug-master/memcheck-section/main.cpp:17
    #2 0x401219 in main /home/share/gdbdebug-master/memcheck-section/main.cpp:50
    #3 0x7f8d1e55683f in __libc_start_main (/lib/x86_64-linux-gnu/libc.so.6+0x2083f)
- 栈溢出
int main()
{
	stack_buffer_overflow_test();
	return 0;
}
$ make clean;make;./memcheck-section
g++  -g -fsanitize=address -Wall -O0 -I. -I. -MMD  -c -o main.o main.cpp
g++ -fsanitize=address -o memcheck-section main.o
=================================================================
==3352==ERROR: AddressSanitizer: stack-buffer-overflow on address 0x7ffedb797684 at pc 0x00000040107f bp 0x7ffedb797610 sp 0x7ffedb797600
READ of size 4 at 0x7ffedb797684 thread T0
    #0 0x40107e in stack_buffer_overflow_test() /home/share/gdbdebug-master/memcheck-section/main.cpp:27
    #1 0x401219 in main /home/share/gdbdebug-master/memcheck-section/main.cpp:51
    #2 0x7f14d4bec83f in __libc_start_main (/lib/x86_64-linux-gnu/libc.so.6+0x2083f)
    #3 0x400de8 in _start (/home/share/gdbdebug-master/memcheck-section/memcheck-section+0x400de8)
Address 0x7ffedb797684 is located in stack of thread T0 at offset 84 in frame
    #0 0x400fc0 in stack_buffer_overflow_test() /home/share/gdbdebug-master/memcheck-section/main.cpp:24

  This frame has 1 object(s):
    [32, 72) 'test' <== Memory access at offset 84 overflows this variable
HINT: this may be a false positive if your program uses some custom stack unwind mechanism or swapcontext
      (longjmp and C++ exceptions *are* supported)
SUMMARY: AddressSanitizer: stack-buffer-overflow /home/share/gdbdebug-master/memcheck-section/main.cpp:27 stack_buffer_overflow_test()
- 全局buffer溢出
int main()
{
	global_buffer_overflow_test();
	return 0;
}
$ make clean;make;./memcheck-section
g++  -g -fsanitize=address -Wall -O0 -I. -I. -MMD  -c -o main.o main.cpp
g++ -fsanitize=address -o memcheck-section main.o
=================================================================
==3370==ERROR: AddressSanitizer: global-buffer-overflow on address 0x0000006024f8 at pc 0x00000040114c bp 0x7ffedc6ff480 sp 0x7ffedc6ff470
READ of size 4 at 0x0000006024f8 thread T0
    #0 0x40114b in global_buffer_overflow_test() /home/share/gdbdebug-master/memcheck-section/main.cpp:34
    #1 0x401219 in main /home/share/gdbdebug-master/memcheck-section/main.cpp:52
    #2 0x7efcccb8083f in __libc_start_main (/lib/x86_64-linux-gnu/libc.so.6+0x2083f)
    #3 0x400de8 in _start (/home/share/gdbdebug-master/memcheck-section/memcheck-section+0x400de8)

0x0000006024f8 is located 8 bytes to the right of global variable 'global_data' defined in 'main.cpp:31:5' (0x602360) of size 400
SUMMARY: AddressSanitizer: global-buffer-overflow /home/share/gdbdebug-master/memcheck-section/main.cpp:34 global_buffer_overflow_test()
- 使用野指针
int main()
{
	use_after_free_test();
	return 0;
}
$ make clean;make;./memcheck-section
g++  -g -fsanitize=address -Wall -O0 -I. -I. -MMD  -c -o main.o main.cpp
g++ -fsanitize=address -o memcheck-section main.o
=================================================================
==3386==ERROR: AddressSanitizer: heap-use-after-free on address 0x60200000eff0 at pc 0x0000004011e7 bp 0x7fff05286400 sp 0x7fff052863f0
READ of size 1 at 0x60200000eff0 thread T0
    #0 0x4011e6 in use_after_free_test() /home/share/gdbdebug-master/memcheck-section/main.cpp:43
    #1 0x401219 in main /home/share/gdbdebug-master/memcheck-section/main.cpp:53
    #2 0x7f1dc870583f in __libc_start_main (/lib/x86_64-linux-gnu/libc.so.6+0x2083f)
    #3 0x400de8 in _start (/home/share/gdbdebug-master/memcheck-section/memcheck-section+0x400de8)

0x60200000eff0 is located 0 bytes inside of 10-byte region [0x60200000eff0,0x60200000effa)
远程调试
- 服务器端/被调试机
安装gdbserver
启动gdbserver
- 客户端/调试机
gdb远程连接并进行调试
$ gdbserver 192.168.2.128:999 remote-section   # gdbserver端启动
Process remote-section created; pid = 3490
Listening on port 999

$ gdb  # gdb客户端启动gdb
(gdb) target remote 192.168.2.128:999 # attach到远端服务器的地址
Remote debugging using 192.168.2.128:999
Reading /home/share/gdbdebug-master/remote-section/remote-section from remote target...
warning: File transfers from remote targets can be slow. Use "set sysroot" to access files locally instead.
Reading /home/share/gdbdebug-master/remote-section/remote-section from remote target...
Reading symbols from target:/home/share/gdbdebug-master/remote-section/remote-section...done.
Reading /lib64/ld-linux-x86-64.so.2 from remote target...
Reading /lib64/ld-linux-x86-64.so.2 from remote target...
Reading symbols from target:/lib64/ld-linux-x86-64.so.2...Reading /lib64/ld-2.23.so from remote target...
Reading /lib64/.debug/ld-2.23.so from remote target...
(no debugging symbols found)...done.
0x00007ffff7dd7c30 in ?? () from target:/lib64/ld-linux-x86-64.so.2

$ gdbserver 192.168.2.128:999 remote-section
Process remote-section created; pid = 3490
Listening on port 999
Remote debugging from host 192.168.2.128  # gdbserver端提示gdb连接上了
多线程死锁调试
死锁的条件:
- 互斥条件
- 保持和请求条件
- 不可剥夺条件
- 循环等待条件
解决死锁的方式:
- 顺序使用锁
- 控制锁的作用范围
- 可以使用超时机制
分析死锁常用的命令:
- thread
- bt
- f
- p
$ ./deadlock-section   # 程序死锁
线程函数do_work_2开始
线程函数do_work_1开始

$ gdb attach 3653  # attach进入进程
Using host libthread_db library "/lib/x86_64-linux-gnu/libthread_db.so.1".
0x00007f77c117398d in pthread_join (threadid=140152304301824,
    thread_return=0x0) at pthread_join.c:90
90      pthread_join.c: No such file or directory.
(gdb) i threads
  Id   Target Id         Frame
* 1    Thread 0x7f77c158f740 (LWP 3653) "deadlock-sectio" 0x00007f77c117398d in pthread_join (threadid=140152304301824, thread_return=0x0)
    at pthread_join.c:90
  2    Thread 0x7f77c04ff700 (LWP 3654) "deadlock-sectio" __lll_lock_wait ()
    at ../sysdeps/unix/sysv/linux/x86_64/lowlevellock.S:135
  3    Thread 0x7f77bfcfe700 (LWP 3655) "deadlock-sectio" __lll_lock_wait ()
    at ../sysdeps/unix/sysv/linux/x86_64/lowlevellock.S:135
(gdb) p _mutex2  # 3号线程获取了_mutex2
$1 = {<std::__mutex_base> = {_M_mutex = {__data = {__lock = 2, __count = 0,
        __owner = 3655, __nusers = 1, __kind = 0, __spins = 0, __elision = 0,
        __list = {__prev = 0x0, __next = 0x0}},
      __size = "\002\000\000\000\000\000\000\000G\016\000\000\001", '\000' <repeats 26 times>, __align = 2}}, <No data fields>}
(gdb) p _mutex1  # 2号线程获取了_mutex1
$2 = {<std::__mutex_base> = {_M_mutex = {__data = {__lock = 2, __count = 0,
        __owner = 3654, __nusers = 1, __kind = 0, __spins = 0, __elision = 0,
        __list = {__prev = 0x0, __next = 0x0}},
      __size = "\002\000\000\000\000\000\000\000F\016\000\000\001", '\000' <repeats 26 times>, __align = 2}}, <No data fields>}
core dump
Linux core dump:一般称之为核心转储、内核转储,我们统称为转储文件。是某个时刻某个进程的内存信息映射,即包含了生成转储文件时该进程的整个内存信息以及寄存器等信息。转储文件可以是某个进程的,也可以是整个系统的。可以是进程活着的时候生成的,也可以是进程或者系统崩溃的时候自动生成的。
为活着的进程创建core dump文件一般可以通过gdb来生成,使用gdb把进程attach进来以后,执行generate-core-file或者gcore命令来生成core dump文件。
(gdb) attach 3781  # 调试某个线程
Attaching to process 3781
(gdb) generate-core-file # 生成core dump文件
Saved corefile core.3781
更多时候是对崩溃产生的core dump文件进行分析。
如何让程序崩溃的时候自动生成core dump?
- 第一种情况
$ ulimit -c
0  # 不会产生core dump文件
$ ./coredump1-section
Segmentation fault

$ ulimit -c unlimited
$ ulimit -c
unlimited # 不限制生成core dump文件

$ ./coredump1-section
Segmentation fault (core dumped)  # 生成了core dump文件
$ ll
-rw-------  1 root root  561152 Mar 10 23:37 core
$ more /proc/sys/kernel/core_pattern  # 这里指定了生成文件名
core
$ echo -e "%e-%p-%t" > /proc/sys/kernel/core_pattern  # 修改生成文件名的格式,不能用vim命令
$ more /proc/sys/kernel/core_pattern
%e-%p-%t
$ ./coredump1-section
Segmentation fault (core dumped)
$ ll
-rw-------  1 root root  561152 Mar 10 23:39 coredump1-secti-3996-1678520392

$ ulimit -c 0  # 更改为不产生core dump文件
$ ./coredump1-section
Segmentation fault
- 第二种情况
# Ubuntu下默认的生成文件格式,在这个格式下,修改ulimit -c 0也会产生core dump文件,这是因为生成core dump文件由/usr/share/apport/apport控制了
$ more /proc/sys/kernel/core_pattern
|/usr/share/apport/apport %p %s %c %d %P %E
$ ulimit -c 0
$ ./coredump1-section
Segmentation fault (core dumped)
# 使用coredump文件
$ gdb ./coredump1-section core
Core was generated by `./coredump1-section'.
Program terminated with signal SIGSEGV, Segmentation fault.
#0  0x00000000004006c6 in main () at main.cpp:12
12              *p = 10;
(gdb) bt
#0  0x00000000004006c6 in main () at main.cpp:12
(gdb)
扩展:
(gdb) shell ulimit -a
core file size          (blocks, -c) 0
data seg size           (kbytes, -d) unlimited
scheduling priority             (-e) 0
file size               (blocks, -f) unlimited
pending signals                 (-i) 7640
max locked memory       (kbytes, -l) 64
max memory size         (kbytes, -m) unlimited
open files                      (-n) 1024
pipe size            (512 bytes, -p) 8
POSIX message queues     (bytes, -q) 819200
real-time priority              (-r) 0
stack size              (kbytes, -s) 8192       # 函数栈空间大小
cpu time               (seconds, -t) unlimited
max user processes              (-u) 7640
virtual memory          (kbytes, -v) unlimited
file locks                      (-x) unlimited

 浙公网安备 33010602011771号