
微信小程序的wx-charts插件

还有就是可以使用一些小程序的插件,比如wx-charts.
先来看一下网上对这个插件的评价:

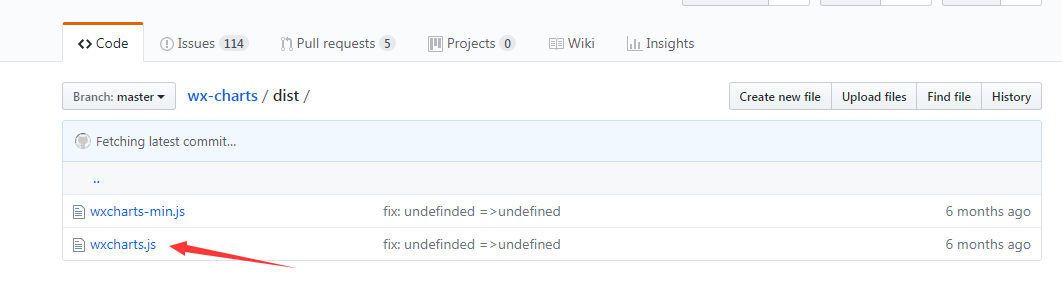
目前在github上有 1804颗星,使用的比较广泛。
github地址:https://github.com/xiaolin3303/wx-charts.git;
支持图标类型
- 饼图 pie
- 圆环图 ring
- 线图 line
- 柱状图 column
- 区域图 area
- 雷达图 radar
使用方法
直接引入编译好的dist里面的js文件(二选一)
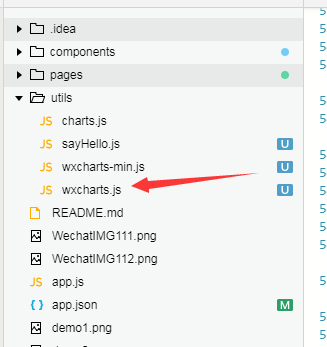
然后在需要使用的页面的js当中使用require引入即可:
let Charts = require('./../../utils/wxcharts.js');
.wxml中定义
<canvas canvas-id="canvas1"></canvas>
<canvas canvas-id="canvas2"></canvas>
<canvas canvas-id="canvas3"></canvas>
<canvas canvas-id="canvas4"></canvas>
<canvas canvas-id="canvas5"></canvas>
<canvas canvas-id="canvas6"></canvas>
canvas-id与js当中的new Charts选项当中的canvasId必须要一致才行;
参数说明:
opts                         Object
opts.canvasId                String required                    微信小程序canvas-id
opts.width                   Number required                canvas宽度,单位为px
opts.height                  Number required                canvas高度,单位为px
opts.title                   Object           (only for ring chart)
opts.title.name              String           标题内容
opts.title.fontSize          Number            标题字体大小(可选,单位为px)
opts.title.color             String           标题颜色(可选)
opts.subtitle                Object         (only for ring chart)
opts.subtitle.name           String           副标题内容
opts.subtitle.fontSize       Number          副标题字体大小(可选,单位为px)
opts.subtitle.color          String          副标题颜色(可选)
opts.animation               Boolean default true         是否动画展示
opts.legend                  Boolen default true       是否显示图表下方各类别的标识
opts.type                    String required 图表类型,可选值为pie, line, column, area,radar,ring
opts.categories              Array required       (饼图、圆环图不需要) 数据类别分类
opts.dataLabel               Boolean default true     是否在图表中显示数据内容值
opts.dataPointShape          Boolean default true   是否在图表中显示数据点图形标识
opts.xAxis                   Object       X轴配置
opts.xAxis.disableGrid       Boolean default false      不绘制X轴网格(适用于折线图,柱形图,区域图)
opts.yAxis                   Object    Y轴配置
opts.yAxis.format            Function           自定义Y轴文案显示
opts.yAxis.min               Number        Y轴起始值
opts.yAxis.max               Number           Y轴终止值
opts.yAxis.title             String       Y轴title
opts.yAxis.titleFontColor String Y轴title的文字的颜色
opts.yAxis.fontColor String Y轴文字的颜色
opts.yAxis.gridColor String Y轴格子的颜色
opts.yAxis.disabled          Boolean default false        不绘制Y轴
opts.series                  Array required        数据列表
数据列表series的参数
dataItem                      Object
dataItem.data                 Array required (饼图、圆环图为Number) 数据
dataItem.color                String 例如#7cb5ec 不传入则使用系统默认配色方案
dataItem.name                 String 数据名称
dateItem.format               Function 自定义显示数据内容
高清显示
设置canvas的尺寸为2倍大小,然后缩小到50%,建议都进行这样的设置,图表本身绘制时是按照高清显示配置的,不然整体效果会偏大(一般以iPhone6为标准进行设计)
/* 例如设计图尺寸为320 x 300 */
.canvas {
    width: 640px;
    height: 600px;
    transform: scale(0.5)
}
例子:
pie(饼图)
 new Charts({
      canvasId: 'canvas1',
      type: 'pie',
      series: [{ name: '一班', data: 50 }, { name: '二班', data: 30 }, { name: '三班', data: 20 }, { name: '四班', data: 18 }, { name: '五班', data: 8 }],
      width: 640,
      height: 400,
      dataLabel: true,
    });

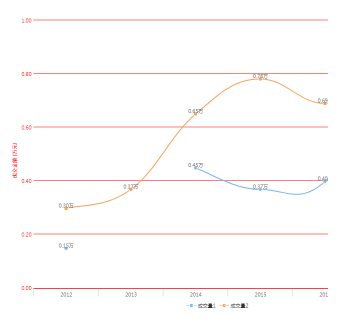
线图(circle)
new Charts({
canvasId: 'canvas2',
dataPointShape: "circle",
type: 'line',
extra: {
lineStyle: 'curve' //线条的形状(弧形)
},
categories: ['2012', '2013', '2014', '2015', '2016', '2017'],
series: [{
name: '成交量1',
data: [0.15, null, 0.45, 0.37, 0.4, 0.8],//设置某一个值为null会出现断层
format: function (val) {
return val.toFixed(2) + '万';
}
}, {
name: '成交量2',
data: [0.30, 0.37, 0.65, 0.78, 0.69, 0.94],
format: function (val) {
return val.toFixed(2) + '万';
}
}],
yAxis: {
title: '成交金额 (万元)',
format: function (val) {
return val.toFixed(2);
},
fontColor: "red",
titleFontColor: "red",
min: 0,
gridColor:"red"
},
width: 840,
height: 600,
dataLabel: true
});
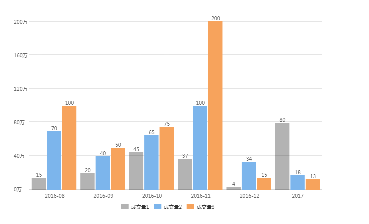
柱状图(column)
 new Charts({
      canvasId: 'canvas3',
      dataPointShape: false,
      type: 'column',
      categories: ['2016-08', '2016-09', '2016-10', '2016-11', '2016-12', '2017'],
      series: [{
        name: '成交量1',
        data: [15, 20, 45, 37, 4, 80],
     color:"rgba(0,0,0,0.3)"//支持rgba,但不支持渐变色
      }, {
        name: '成交量2',
        data: [70, 40, 65, 100, 34, 18]
      }, {
        name: '成交量3',
        data: [100, 50, 75, 200, 15, 13]
      }],
      yAxis: {
        format: function (val) {
          return val + '万';
        }
      },
      xAxis: {
        disableGrid: true,
      },
      width: 640,
      height: 400,
      dataLabel: true,
      extra: {
        column: {
          width: 40 //柱的宽度
        }
      }
    });
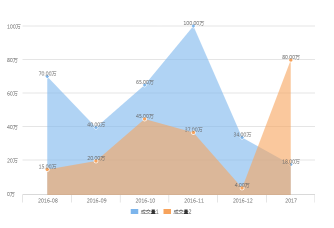
区域图(area)
  new Charts({
      canvasId: 'canvas4',
      type: 'area',
      categories: ['2016-08', '2016-09', '2016-10', '2016-11', '2016-12', '2017'],
      series: [{
        name: '成交量1',
        data: [70, 40, 65, 100, 34, 18],
        format: function (val) {
          return val.toFixed(2) + '万';
        }
      }, {
        name: '成交量2',
        data: [15, 20, 45, 37, 4, 80],
        format: function (val) {
          return val.toFixed(2) + '万';
        }
      }],
      yAxis: {
        format: function (val) {
          return val + '万';
        }
      },
      width: 640,
      height: 400
    });
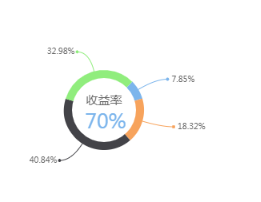
环形图(ring)
new Charts({
      animation: true,
      canvasId: 'canvas5',
      type: 'ring',
      extra: {
        ringWidth: 10,//圆环的宽度
        pie: {
          offsetAngle: -45//圆环的角度
        }
      },
      title: {
        name: '70%',
        color: '#7cb5ec',
        fontSize: 25
      },
      subtitle: {
        name: '收益率',
        color: '#666666',
        fontSize: 15
      },
      series: [{
        name: '成交量1',
        data: 15,
        stroke: false
      }, {
        name: '成交量2',
        data: 35,
        stroke: false
      }, {
        name: '成交量3',
        data: 78,
        stroke: false
      }, {
        name: '成交量4',
        data: 63,
        stroke: false
      }],
      disablePieStroke: true,
      width: 640,
      height: 200,
      dataLabel: true,
      legend: false,
      padding: 0
    });
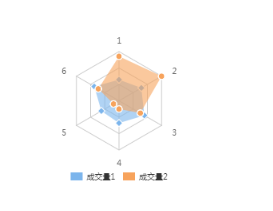
雷达图(radar)
 new Charts({
      animation: true,
      canvasId: 'canvas6',
      type: 'radar',
      categories: ['1', '2', '3', '4', '5', '6'],
      series: [{
        name: '成交量1',
        data: [90, 110, 125, 95, 87, 122]
      }, {
        name: '成交量2',
        data: [190, 210, 105, 35, 27, 102]
      }],
      width: 640,
      height: 200,
      extra: {
        radar: {
          max: 200//雷达数值的最大值
        }
      }
    });
但是,每一个插件都不是完美的,wx-charts虽然易上手的很容易的绘制图形,但是无法满足一些复杂的情况,比如highcharts里面的一些散点图啊之类的,x轴无法法定义title,无法实现背景色的改变和手指上移数据的展示,也无法实现多个图形进行结合,如折线图和柱形图进行同时的展示,只适合一些简单的数据和单一图像的展示。

 浙公网安备 33010602011771号