
Qwt、QChart、QCustomPlot使用及对比
https://blog.csdn.net/qq_43627907/article/details/109661525
Qwt、QChart、QCustomPlot使用🕐 🕜 🕙 🕥 🕚 🕦 😄 😆
| 更多精彩内容 |
|---|
| 👉个人内容分类汇总 👈 |
效果图
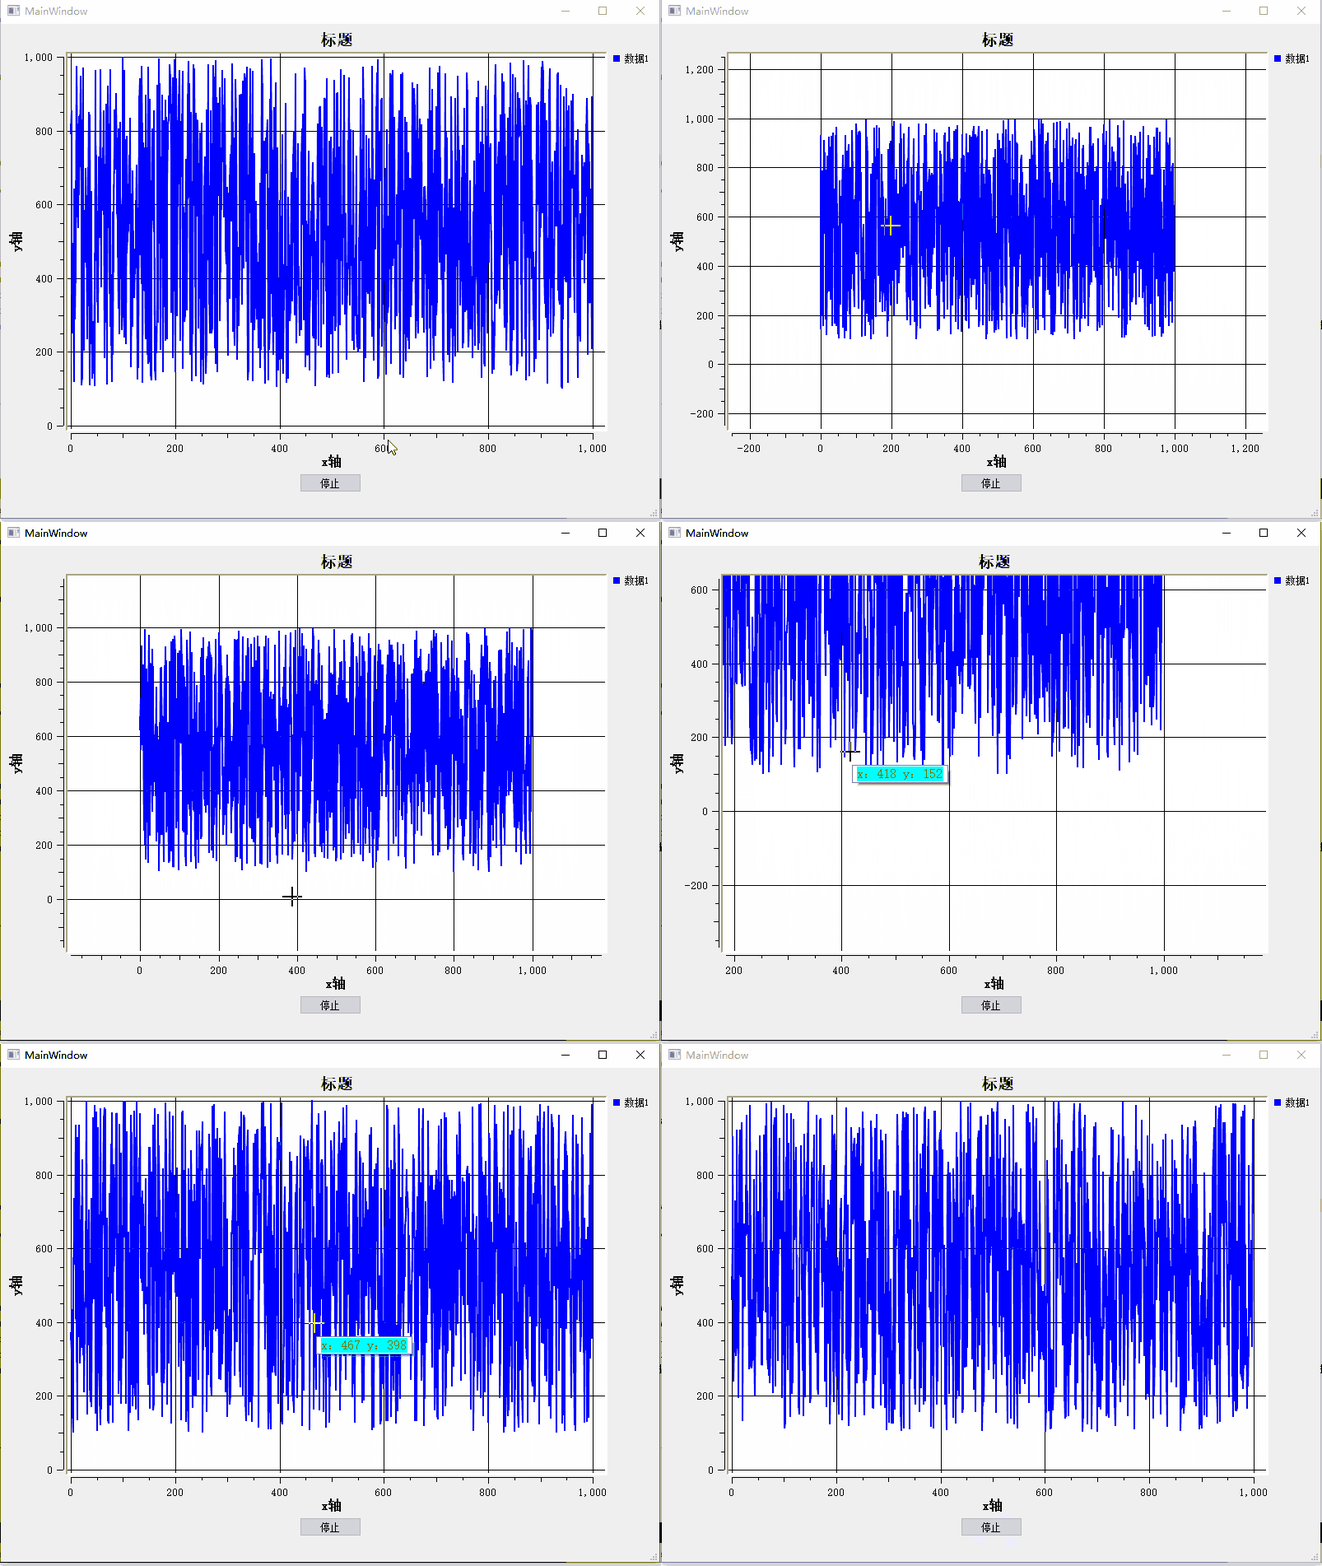
- Qwt
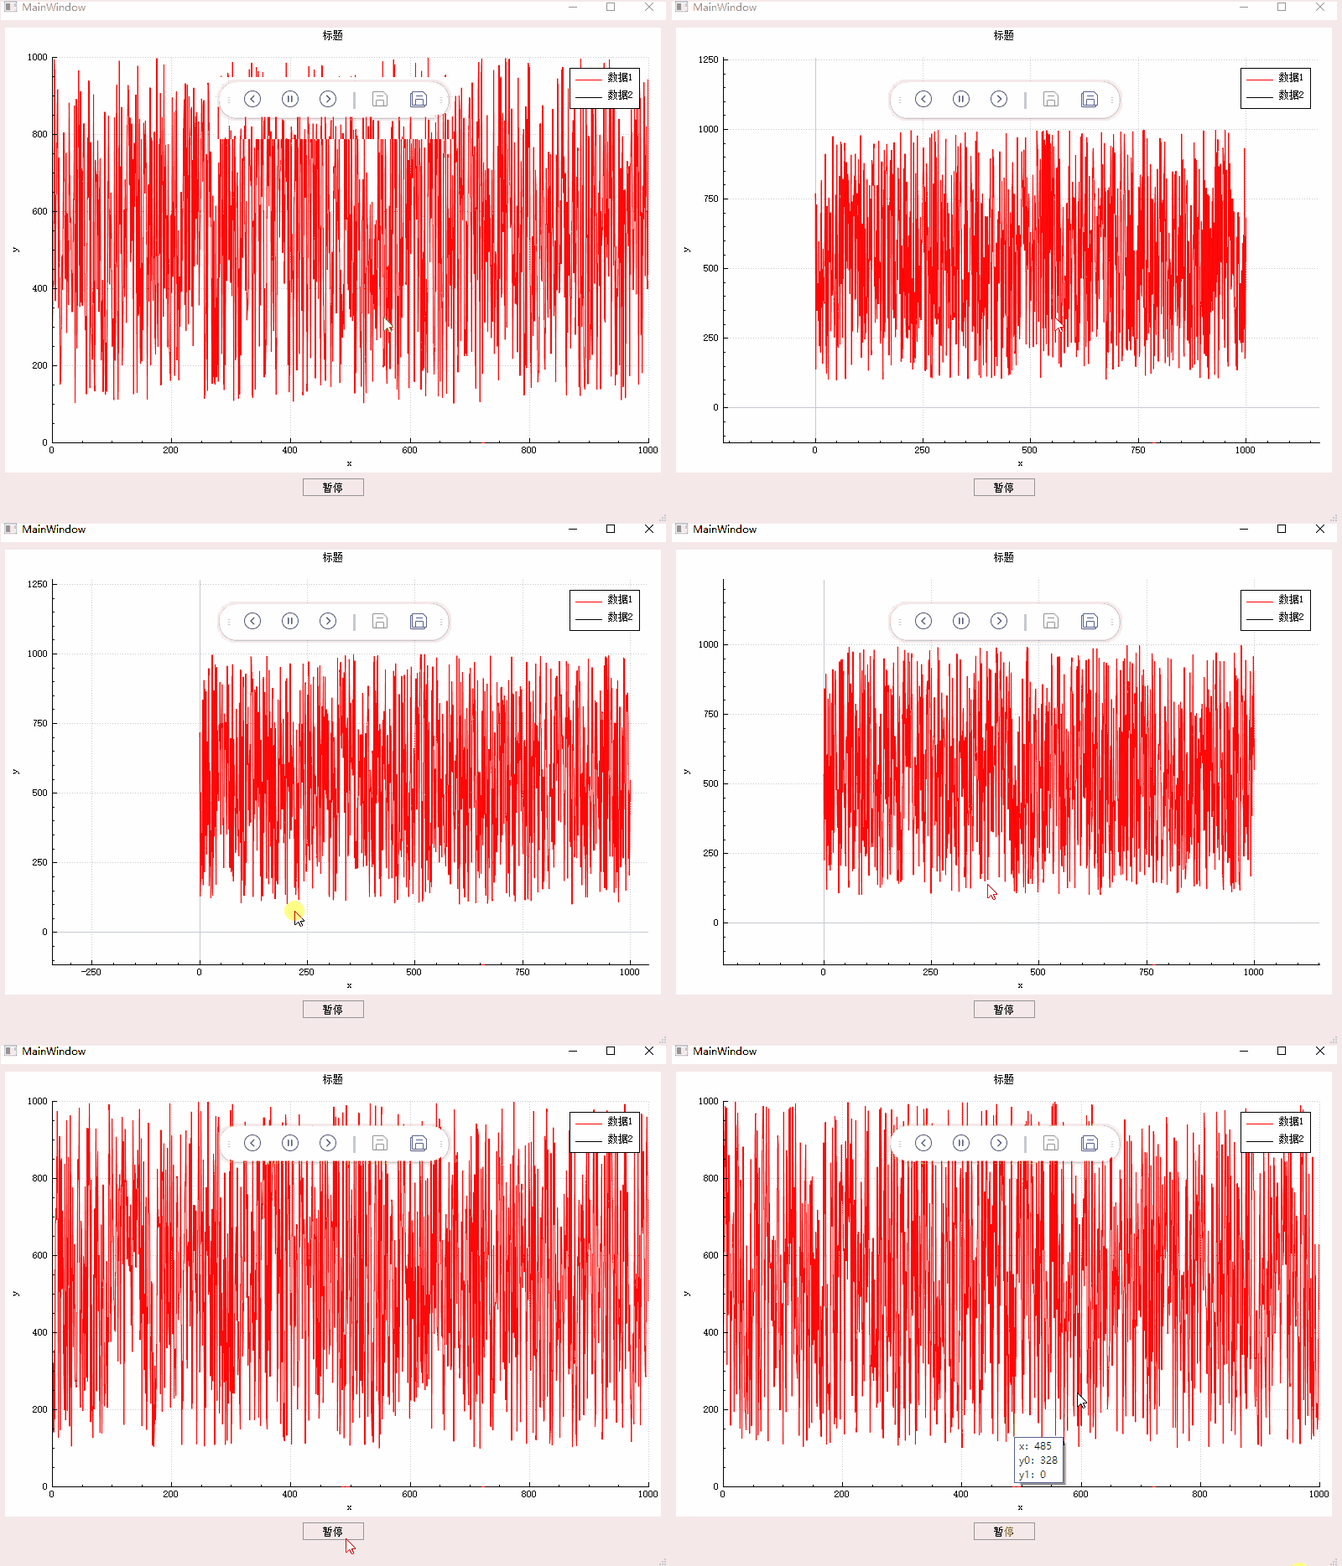
- Qcustomplot
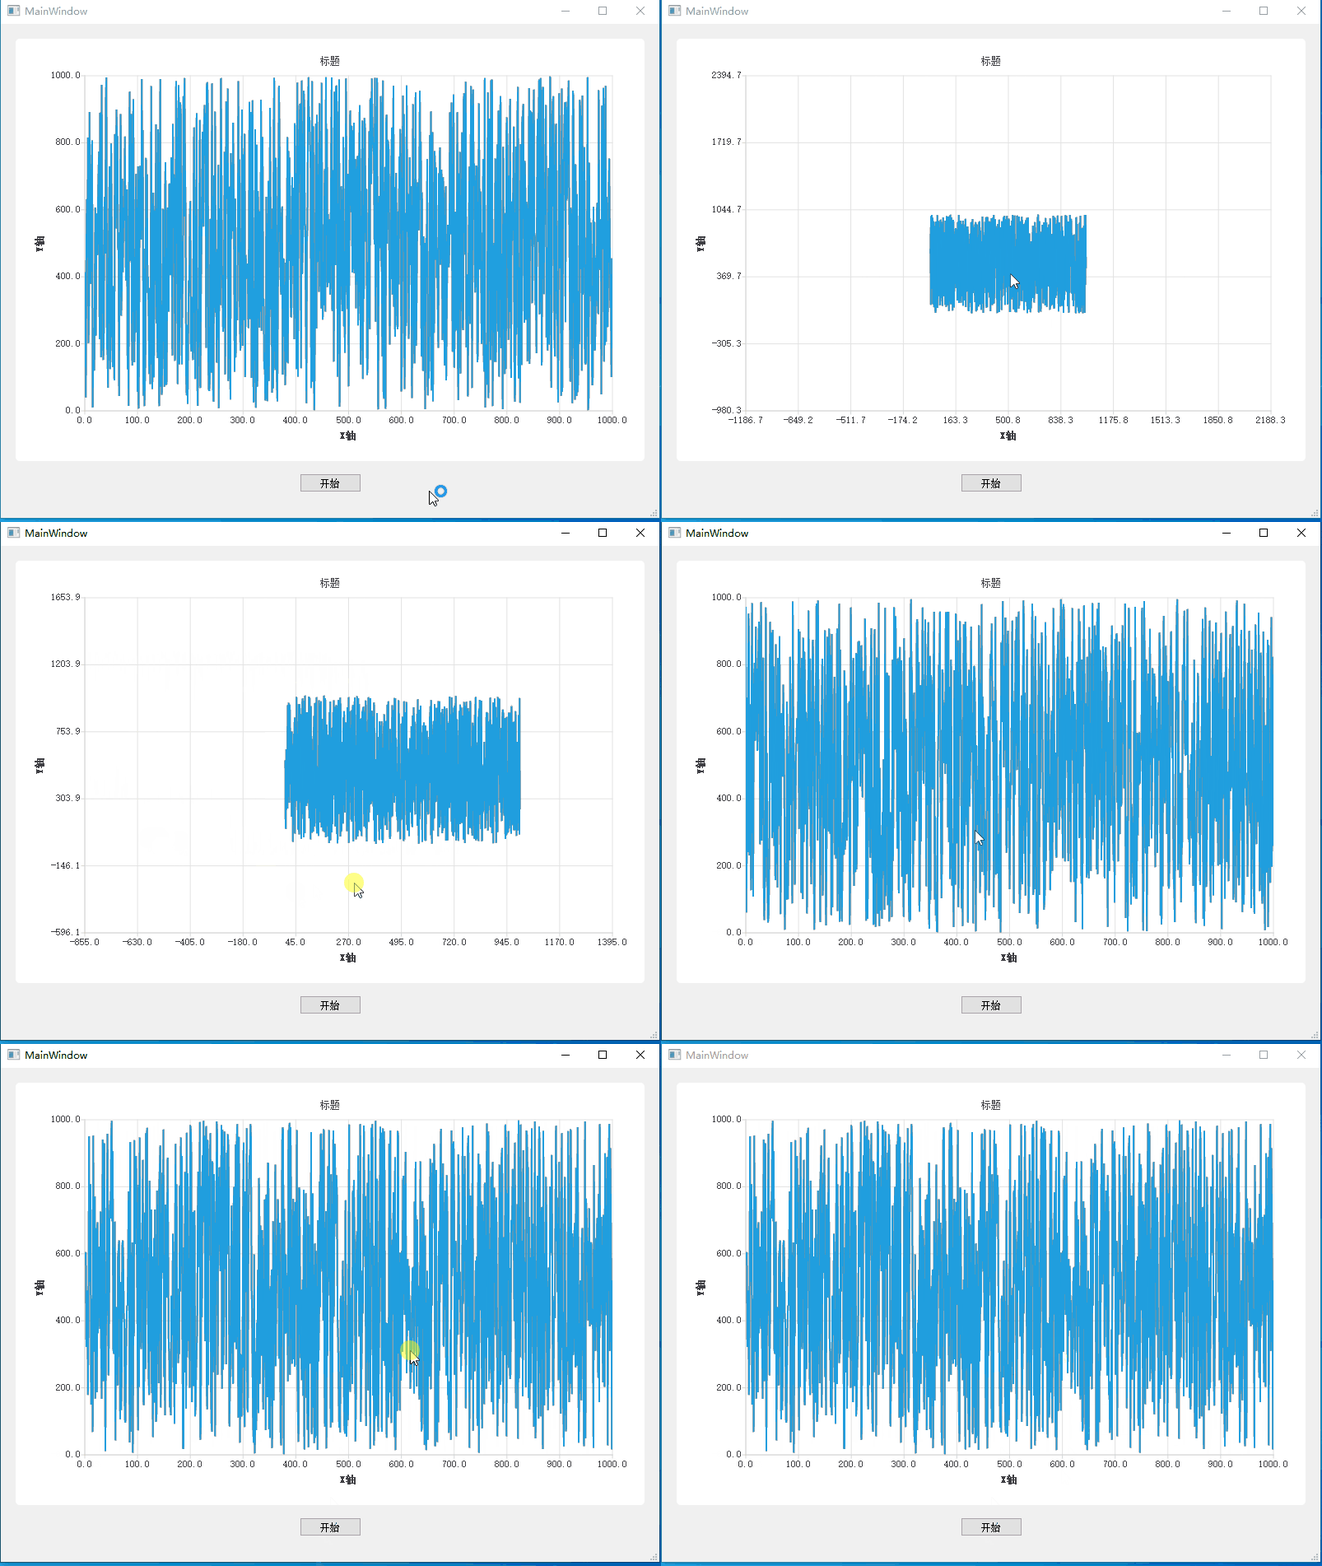
- QChart
比较
-
美观方面:
- Qcustomplot≈Qchart > Qwt
- Qcustomplot界面简洁大方;
- Qchart界面华丽优美,其中QChart中绘制的线条处不能使用鼠标,所以在数据量大的时候会引响鼠标的缩放、移动图表操作;
- Qwt界面老旧,在美观上不如Qcustomplot和Qchart ,并且在使用鼠标移动图表时会产生空白区域。
-
性能方面:
-
绘制数据性能:Qchart>Qcustomplot > Qwt
-
绘制数据数量:Qcustomplot >Qchart> Qwt
-
绘制1000个数据点时,qcustomplot平均耗时 13.6毫秒,Qwt平均耗时40毫秒,QChart平均耗时12.5毫秒;
绘制10000个数据点时,qcustomplot平均耗时 21.6毫秒,Qwt平均耗时78毫秒,QChart平均耗时13.5毫秒;
绘制100000个数据点时,qcustomplot平均耗时22.5毫秒,Qwt平均耗时524毫秒,QChart平均耗时20.7毫秒;
绘制500000个数据点时,qcustomplot平均耗时43.3毫秒,QChart平均耗时194.25毫秒。
-
-
功能方面:
- QChart、Qwt功能比较齐全,并且可绘制图表种类多;
- qcustomplot在图表种类上、常用功能上较少。
-
使用方面:
- QChart无需配置,主要在安装Qt时勾选就可以,在程序编写时上手较慢,许多功能需要重写;
- Qwt安装配置比较复杂;
- QCustomPlot体积小、简单易用,上手快,并且QCustomPlot只有两个源文件,可直接添加进工程,更容易直接修改源码。
Qwt
1、下载源码
- 下载地址
- 选择下载最新版本。

- 进入6.1.5后会有四个文件,前两个是Qwt源码,区别就是压缩格式,后两个为帮助文档。

2、将Qwt编译成共享库
-
将下载的源码解压后使用Qt打开。
![在这里插入图片描述]()
![在这里插入图片描述]()
![在这里插入图片描述]()
-
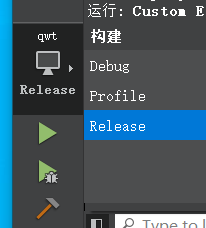
使用Release构建项目。
![在这里插入图片描述]()
![在这里插入图片描述]()
-
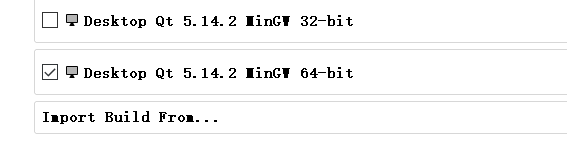
等待一段时间后就可以在qwt-6.1.5同级目录下生成build-qwt-Desktop_Qt_5_14_2_MinGW_64_bit-Release。



3、添加Qwt
-
进入build-qwt-Desktop_Qt_5_14_2_MinGW_64_bit-Release。
![在这里插入图片描述]()
-
进入lib目录,将qwt.dll、qwtd.dll复制到Qt安装目录D:\Qt\Qt5.14.2\5.14.2\mingw73_64\bin,注意之前使用的是MinGW64编译的,就将qwt.dll、qwtd.dll复制到mingw73_64(有的不是73)的bin下。
-
将libqwt.a、libqwtd.a(使用MSVC编译的是libqwt.lib)复制到D:\Qt\Qt5.14.2\5.14.2\mingw73_64\lib目录下
![在这里插入图片描述]()
-
进入build-qwt-Desktop_Qt_5_14_2_MinGW_64_bit-Release**\designer\plugins\designer目录,将libqwt_designer_plugin.a和qwt_designer_plugin.dll复制到Qt安装目录 D:\Qt\Qt5.14.2\5.14.2\mingw73_64\plugins\designer**下。
-
将解压的qwt-6.1.5文件夹下的src文件夹复制到D:\Qt\Qt5.14.2\5.14.2**\mingw73_64\include**目录下,将src重命名为Qwt。


4、使用Qwt
-
打开Qt,新建一个项目,使用MinGw64。
![在这里插入图片描述]()
-
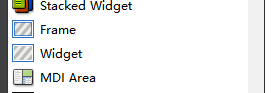
双击进入ui文件,选择Frame控件 –> 右键提升为QwtPlot。
![在这里插入图片描述]()
-
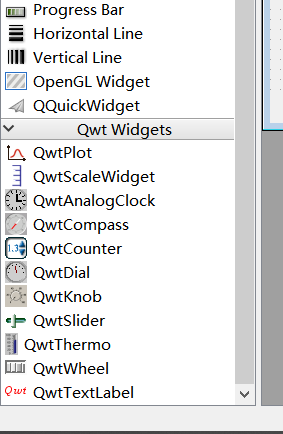
或者右键点击UI文件 –> 用…打开 –> Qt Designer(高版本Qt直接双击打开ui文件是无法加载Qwt的)。
![在这里插入图片描述]()
-
就会出现Qwt控件栏。
![在这里插入图片描述]()
-
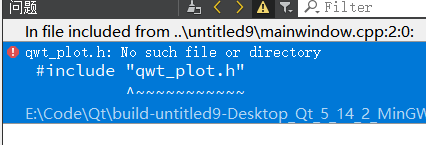
将Qwt控件拖进Winget中,然后保存,这时直接编译会报错。
![在这里插入图片描述]()
-
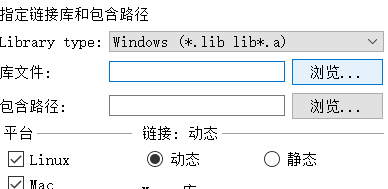
鼠标右键点击工程名,选择添加库。
![在这里插入图片描述]()
![在这里插入图片描述]()
-
点击库文件浏览。
![在这里插入图片描述]()
-
选择之前复制的Qt安装路径D:\Qt\Qt5.14.2\5.14.2**\mingw73_64\lib**下的libqwt.a,点击下一步。
![在这里插入图片描述]()
-
会在 .pro文件中生成。
![在这里插入图片描述]()
-
将INCLUDEPATH和DEPENDPATH改为之前复制的Qwt文件路径,或者在添加头文件时添加
#include <Qwt/qwt_*.h>。![在这里插入图片描述]()
-
然后编译运行就可以成功了。
![在这里插入图片描述]()








5、添加帮助文档
-
打开Qt –> 工具 –> 选项。
![在这里插入图片描述]()
-
选择帮助 –> 添加 –> 找到下载的qwt-6.1.5.qch文件 –> OK。
![在这里插入图片描述]()
![在这里插入图片描述]()
-
通过帮助 –> 索引 就可以找到添加的Qwt文档。
![在这里插入图片描述]()




6、示例
-
进入ui文件,选择Frame控件,提升为QwtPlot,重命名为m_plot,添加控件PushButton。
![在这里插入图片描述]()
-
MainWidget.h文件源码。
public: MainWindow(QWidget *parent = nullptr); ~MainWindow();QTimer m_timer; //定时器
QwtPlotCurve m_curvep; //绘图项-曲线
QwtPlotGrid *m_gridp; //网格部件private slots:
void on_pushButton_clicked(); //暂停定时器
void mouseReleaseEvent(QMouseEvent * event); //鼠标释放事件- 1
- 2
- 3
- 4
- 5
- 6
- 7
- 8
- 9
- 10
- 11
-
MainWidget.cpp文件源码。
#include "mainwindow.h" #include "ui_mainwindow.h" #include <qwt_plot_grid.h> #include <qwt_legend.h> #include <qwt_plot_curve.h> #include <qwt_symbol.h> #include <qwt_plot.h> #include <QVBoxLayout> #include <QPushButton> #include <QTimer> #include <QRandomGenerator> #include <QDateTime> #include <qwt_plot_zoomer.h> #include <qwt_plot_panner.h> #include <qwt_plot_magnifier.h> #include <qwt_plot_canvas.h> #include <QToolTip> #include <qwt_painter.h>MainWindow::MainWindow(QWidget *parent)
: QMainWindow(parent)
, ui(new Ui::MainWindow)
{
ui->setupUi(this);ui->m_plot->setTitle("标题"); //设置图的标题
ui->m_plot->setCanvasBackground(Qt::white); //设置图纸的背景颜色
ui->m_plot->setAxisScale(QwtPlot::yLeft, 0.0, 1000.0); //设置y轴范围
ui->m_plot->setAxisScale(QwtPlot::xBottom,0, 50); //设置x轴范围
ui->m_plot->insertLegend(new QwtLegend()); //创建一个图例
ui->m_plot->setAxisTitle(QwtPlot::xBottom, "x轴"); //设置横坐标标题
ui->m_plot->setAxisTitle(QwtPlot::yLeft, "y轴"); //设置纵坐标标题
//l_plot->setAutoReplot(true); //设置自动重绘,不建议使用m_gridp = new QwtPlotGrid();
m_gridp->attach(ui->m_plot); //添加网格//声明一个曲线,并设置相关属性
m_curvep = new QwtPlotCurve();
m_curvep->setTitle("数据1"); //设置曲线名字,该名字会被作为图例的标识
m_curvep->setPen(Qt::blue, 2); //设置画笔的颜色为blue,线宽为2像素
m_curvep->setRenderHint(QwtPlotItem::RenderAntialiased, true); //渲染抗锯齿
m_curvep->attach(ui->m_plot); //将曲线绘制到画布上//声明并设置一个在画布上的符号`
QwtSymbol *symbol = new QwtSymbol(QwtSymbol::Ellipse,
QBrush(Qt::yellow), QPen(Qt::red, 2), QSize(8, 8)); //在线上绘制端点
// curve->setSymbol( symbol ); //添加到线上QwtPlotZoomer *zoomer = new QwtPlotZoomer(ui->m_plot->canvas()); //鼠标选择图形局部放大
zoomer->setMousePattern( QwtEventPattern::MouseSelect1, Qt::RightButton, Qt::ControlModifier );//ctrl+右键 放大 右键恢复原样QwtPlotMagnifier *magnifier = new QwtPlotMagnifier(ui->m_plot->canvas()); //默认的滑轮及右键缩放功能 图形的整体缩放
magnifier->setMouseButton(Qt::LeftButton); //设置为左键缩放
magnifier->setWheelFactor(1.5); //设置鼠标滚轮缩放系数QwtPlotPanner *panner = new QwtPlotPanner(ui->m_plot->canvas()); //默认的左键移动功能
panner->setMouseButton(Qt::RightButton); //设置为右键移动//鼠标监听
setMouseTracking(true);
ui->centralwidget->setMouseTracking(true);
ui->m_plot->setMouseTracking(true);
ui->m_plot->canvas()->setMouseTracking(true);m_timer = new QTimer(this); //初始化定时器
connect(m_timer, &QTimer::timeout,
[=]()
{
double x[50], y1[50]; //创建绘图所用数组,需要快速读写情况下建议使用数组,不使用QVector<double>
for (int i=0; i<50; ++i)
{
x[i] = i;
y1[i] = QRandomGenerator::global()->bounded(100,1000); //生成随机数
}
m_curvep->setSamples(x, y1, 50); //Info4
ui->m_plot->replot();
});
m_timer->start(1); //开启定时器,每1毫秒显示一帧图像}
MainWindow::~MainWindow()
{
delete ui;
}//鼠标释放事件,显示最近数据点的坐标
void MainWindow::mouseReleaseEvent(QMouseEvent *p_eventP)
{
QPoint l_pointMouse = ui->m_plot->canvas()->mapFromGlobal(QCursor::pos()); //将全局屏幕坐标位置转换为控件坐标。if(l_pointMouse.x() >= 0 && l_pointMouse.x() < ui->m_plot->canvas()->width() //如果鼠标在控件内就显示
&& l_pointMouse.y() >= 0 && l_pointMouse.y() < ui->m_plot->canvas()->height())
{
int l_nX = m_curvep->closestPoint(l_pointMouse); //获取离鼠标最近点横坐标
int l_nY = m_curvep->sample(l_nX).y(); //获取离鼠标最近点纵坐标
QString l_strPos = QString("x:%0 y:%1").arg(l_nX).arg(l_nY);
QString l_stStyle = "<p style="background:#00FFFF; border-radius: 1px 5px;font:12pt '宋体'">%1</p>";
QToolTip::showText(cursor().pos(), l_stStyle.arg(l_strPos), ui->m_plot->canvas(), QRect(0,0,1,1), 10000); //在点击位置显示提示信息
}
}//停止定时器
void MainWindow::on_pushButton_clicked()
{
m_timer->stop();
}- 1
- 2
- 3
- 4
- 5
- 6
- 7
- 8
- 9
- 10
- 11
- 12
- 13
- 14
- 15
- 16
- 17
- 18
- 19
- 20
- 21
- 22
- 23
- 24
- 25
- 26
- 27
- 28
- 29
- 30
- 31
- 32
- 33
- 34
- 35
- 36
- 37
- 38
- 39
- 40
- 41
- 42
- 43
- 44
- 45
- 46
- 47
- 48
- 49
- 50
- 51
- 52
- 53
- 54
- 55
- 56
- 57
- 58
- 59
- 60
- 61
- 62
- 63
- 64
- 65
- 66
- 67
- 68
- 69
- 70
- 71
- 72
- 73
- 74
- 75
- 76
- 77
- 78
- 79
- 80
- 81
- 82
- 83
- 84
- 85
- 86
- 87
- 88
- 89
- 90
- 91
- 92
- 93
- 94
- 95
- 96
- 97
- 98
- 99
- 100
- 101
- 102
- 103
- 104
- 105
- 106
- 107
- 108
- 109
- 110

QCustomPlot
1、下载源码
-
下载QCustomPlot.tar.gz、QCustomPlot-sharedlib.tar.gz两个文件并解压。
![在这里插入图片描述]()

2、使用源码
-
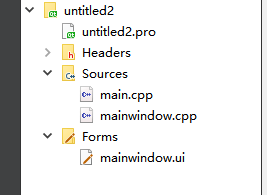
Qt新建一个工程文件,解压QCustomPlot.tar.gz后将qcustomplot.h与qcustomplot.cpp拷贝到工程目录下,右键 -> 添加现有文件…,将这两个文件添加至工程。
![在这里插入图片描述]()
-
在pro中需要添加(由于QCustomPlot中存在导出功能,使用了printsupport模块):
QT += printsupport- 1
-
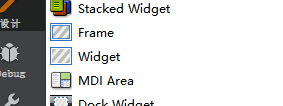
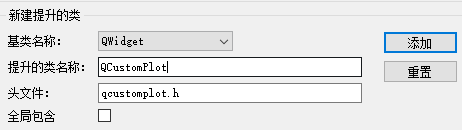
进入.ui文件,选择widget控件,右键提升为QCustomPlot。
![在这里插入图片描述]()
![在这里插入图片描述]()
-
运行程序就可以看见控件效果了,由于直接使用QCustomPlot源码,所以编译运行速度会比较慢。
![在这里插入图片描述]()


3、将QCustomPlot编译成共享库
-
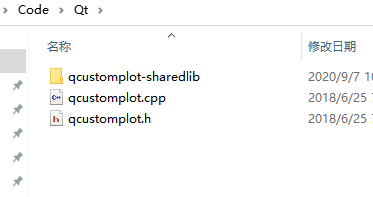
解压QCustomPlot-sharedlib.tar.gz,将QCustomPlot.tar.gz中的qcustomplot.cpp/.h文件复制到和QCustomPlot-sharedlib.tar.gz解压后的文件夹同级目录下。
![在这里插入图片描述]()
-
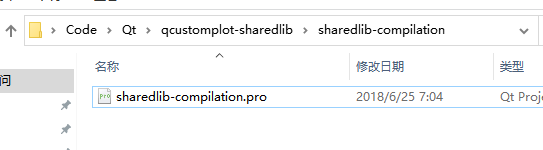
进入qcustomplot-sharedlib/sharedlib-compilation –> 使用Qt打开sharedlib-compilation.pro文件。
![在这里插入图片描述]()
![在这里插入图片描述]()
-
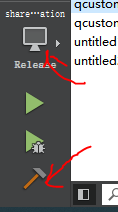
选择Debug或Release任意模式,然后点击构建。
![在这里插入图片描述]()
-
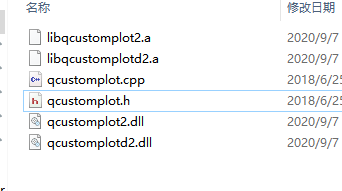
进入build-sharedlib-compilation-Desktop_Qt_5_14_2_MinGW_64_bit-Debug目录,将debug和release目录下的libqcustomplotd2.a、qcustomplotd2.dll、libqcustomplot2.a、qcustomplot2.dll四个文件(代d的为debug版本)复制到新建的qcustomplot目录下,再将qcustomplot.h、cpp两个源码文件也复制到qcustomplot目录下。
![在这里插入图片描述]()
<img src="Qwt%E3%80%81QChart%E3%80%81QCustomPlot%E4%BD%BF%E7%94%A8%E6%96%87%E6%A1%A3.assets/
![在这里插入图片描述]()
-
新建一个Qt工程,在.pro文件添加。
QT += printsupport- 1
-
选中工程名,右键 –> 添加库 –> 静态库 –> 浏览 –> 选择之前编译好的libqcustomplot2.a文件,点击确定,会在.pro文件中生成下列几行代码。
![在这里插入图片描述]()
-
将圈中位置由-lqcustomplot2d改为lqcustomplotd2。
![在这里插入图片描述]()
-
选择widget控件,右键提升为QCustomPlot,编译运行就可以使用QCustomPlot了。



4、示例
-
进入.ui文件,选择widget控件,命名为customPlot,右键提升为QCustomPlot,添加PushButton,命名为pushButton_Stop。
![在这里插入图片描述]()
-
widget.h文件源码

#ifndef WIDGET_H
#define WIDGET_H
#include <QWidget>

#include <qtimer.h>
QT_BEGIN_NAMESPACE

namespace Ui { class Widget; }

QT_END_NAMESPACE
class Widget : public QWidget

{

Q_OBJECT
public:

Widget(QWidget *parent = nullptr);

~Widget();
protected:

void Init();                                  //初始化绘图

void connectSlot();                           // 绑定信号槽
private:
void on_mouseRelease(QMouseEvent event);

void on_mouseDoubleClick(QMouseEvent event);

void updateData();
private:

Ui::Widget *ui;

QTimer m_timer;                               //声明定时器
QVector<double> arrX, arrY1, arrY2;           //创建绘图所用数组

};

#endif // WIDGET_H
- 1
- 2
- 3
- 4
- 5
- 6
- 7
- 8
- 9
- 10
- 11
- 12
- 13
- 14
- 15
- 16
- 17
- 18
- 19
- 20
- 21
- 22
- 23
- 24
- 25
- 26
- 27
- 28
- 29
- 30
- 31
- 32
- 33
- 34
- 35
- widget.cpp文件源码
#include "widget.h"
#include "ui_widget.h"
#include <QCursor>
#define DATA_LEN 1000 // 绘制的数据量
#define X_AXIS_MIN 0 // X轴最小值
#define X_AXIS_MAX 1000 // X轴最大值
#define Y_AXIS_MIN 0
#define Y_AXIS_MAX 1100
Widget::Widget(QWidget *parent)
: QWidget(parent)
, ui(new Ui::Widget)
{
ui->setupUi(this);
Init();
connectSlot();
}
Widget::~Widget()
{
delete ui;
}
void Widget::Init()
{
//设置标题
ui->customPlot->plotLayout()->insertRow(0);
ui->customPlot->plotLayout()->addElement(0, 0, new QCPTextElement(ui->customPlot, "标题"));
// ui->customPlot->setBackground(QColor(0,0,0,255)); //设置背景色
ui->customPlot->xAxis->setRange(X_AXIS_MIN, X_AXIS_MAX); //设置横坐标轴范围
ui->customPlot->yAxis->setRange(Y_AXIS_MIN, Y_AXIS_MAX); //设置纵坐标轴范围
ui->customPlot->setInteractions(QCP::iRangeDrag |QCP::iRangeZoom); //设置鼠标拖动,设置鼠标滚轮缩放
ui->customPlot->setInteraction(QCP::iSelectPlottables, false); //设置是否可选择图表
ui->customPlot->legend->setVisible(true); //设定右上角图形标注可见
ui->customPlot->setSelectionRectMode(QCP::SelectionRectMode::srmZoom); //模式:框选放大
//设置添加的图表
ui->customPlot->addGraph(); //添加图表1
ui->customPlot->addGraph(); //添加图表2
ui->customPlot->graph(0)->setName("数据1"); //设置图表1名称
ui->customPlot->graph(1)->setName("数据2"); //设置图表2名称
ui->customPlot->graph(0)->setPen(QPen(QColor(255, 0, 0, 255))); //设置图表1颜色
ui->customPlot->graph(1)->setPen(QPen(QColor(0, 255, 0, 255))); //设置图表2颜色
ui->customPlot->xAxis->setLabel("x"); //设置横坐标轴标题
ui->customPlot->yAxis->setLabel("y"); //设置纵坐标轴标题
arrX.resize(DATA_LEN);
arrY1.resize(DATA_LEN);
arrY2.resize(DATA_LEN);
m_timer.start(50); //开启定时器,每10毫秒显示一帧图像
}
void Widget::connectSlot()
{
//显示鼠标点击位置的坐标信息,只能用SIGNAL格式
connect(ui->customPlot, &QCustomPlot::mouseRelease, this, &Widget::on_mouseRelease);
connect(ui->customPlot, &QCustomPlot::mouseDoubleClick, this, &Widget::on_mouseDoubleClick);
connect(&m_timer, &QTimer::timeout, this, &Widget::updateData); // 定时器绘制图表
}
/**
-
@brief 鼠标中键点击显示点的信息
-
@param event
/
void Widget::on_mouseRelease(QMouseEvent event)
{
if(event->button() == Qt::MiddleButton)
{
//获取点击的下标
int l_nX = qRound(ui->customPlot->xAxis->pixelToCoord(event->x())); //将鼠标点击处QCustomPlot小部件的像素坐标中的值转换为轴坐标,取四舍五入值
QString l_strToolTip = QString("x:%0").arg(l_nX); //添加提示信息
if(l_nX >= 0) //如果鼠标点击位置为负则不显示
{
for (int i = 0;i < ui->customPlot->xAxis->graphs().count();i++) //判断共有多少路数据
{
int l_nY = ui->customPlot->graph(i)->data()->at(l_nX)->value; //获得x轴坐标位置对应的曲线上y的值
l_strToolTip += QString("\ny%0:%1").arg(i).arg(l_nY);
}
QToolTip::showText(cursor().pos(), l_strToolTip, ui->customPlot, QRect(0,0,1,1), 10000); //在点击位置显示提示信息
}
}
}
/**
- @brief 鼠标右键双击还原图表大小(坐标轴刻度)
- @param event
/
void Widget::on_mouseDoubleClick(QMouseEvent event)
{
if(event->button() == Qt::RightButton)
{
ui->customPlot->xAxis->setRange(X_AXIS_MIN, X_AXIS_MAX); //设置横坐标轴范围
ui->customPlot->yAxis->setRange(Y_AXIS_MIN, Y_AXIS_MAX); //设置纵坐标轴范围
ui->customPlot->replot(); //更新图表
}
}
/**
- @brief 生成随机数并绘制图表
*/
void Widget::updateData()
{
for (int i=0; i< DATA_LEN; ++i)
{
arrX[i] = i;
arrY1[i] = QRandomGenerator::global()->bounded(500, 1000); //生成随机数
arrY2[i] = QRandomGenerator::global()->bounded(10, 500);
}
ui->customPlot->graph(0)->setData(arrX, arrY1); //添加数据
ui->customPlot->graph(1)->setData(arrX, arrY2); //添加数据
ui->customPlot->replot(); //更新图表
}
- 1
- 2
- 3
- 4
- 5
- 6
- 7
- 8
- 9
- 10
- 11
- 12
- 13
- 14
- 15
- 16
- 17
- 18
- 19
- 20
- 21
- 22
- 23
- 24
- 25
- 26
- 27
- 28
- 29
- 30
- 31
- 32
- 33
- 34
- 35
- 36
- 37
- 38
- 39
- 40
- 41
- 42
- 43
- 44
- 45
- 46
- 47
- 48
- 49
- 50
- 51
- 52
- 53
- 54
- 55
- 56
- 57
- 58
- 59
- 60
- 61
- 62
- 63
- 64
- 65
- 66
- 67
- 68
- 69
- 70
- 71
- 72
- 73
- 74
- 75
- 76
- 77
- 78
- 79
- 80
- 81
- 82
- 83
- 84
- 85
- 86
- 87
- 88
- 89
- 90
- 91
- 92
- 93
- 94
- 95
- 96
- 97
- 98
- 99
- 100
- 101
- 102
- 103
- 104
- 105
- 106
- 107
- 108
- 109
- 110
- 111
- 112
- 113
- 114
- 115
- 116
- 117
- 118
- 119
- 120
- 121
- 122
-
QCPGraph::setData第三参数对性能的引响:
- 1000数据:alreadySorted设为true时需要16.8毫秒,设为false时需要13.6毫秒;
- 10000数据:alreadySorted设为true时需要21.6毫秒,设为false时需要22.6毫秒;
- 100000数据:alreadySorted设为true时需要22.5毫秒,设为false时需要43.7毫秒;
- 500000数据:alreadySorted设为true时需要43.3毫秒,设为false时需要197.2毫秒;
- 在数据量小于10000时alreadySorted为false和true性能相差不大,数据量为100000时alreadySorted为true性能为false的2倍左右,数据量为500000时alreadySorted为true的性能是false的4.5倍左右,所以如果可以保证通过键对传递的数据点进行升序排序,则可以将alreadySorted设置为true,以通过保存排序运行来提高性能。
void QCPGraph::setData (const QVector< double > & keys, const QVector< double > & values, bool alreadySorted = false )- 1
- 2
- 3
QChart
1、安装
- 如果需要在QT中使用QChart类,需要在安装Qt的时候勾选QChart选项,在工程的 .pro 文件里面添加 QT += charts 语句,包含 QChart 头文件就行了。
2、示例
-
在程序中创建ChartView类,继承与QChartView,实现绘制图表的缩放、还原、移动和鼠标点击显示最近点信息功能;
-
MainWidget.h文件源码。
#ifndef MAINWINDOW_H #define MAINWINDOW_H#include <QMainWindow>
#include <QtCharts/QLineSeries>
#include <QtCharts/QChart>
#include <QtCharts/QValueAxis>
#include <QtCharts/QChartView>
#include "chartview.h"QT_CHARTS_USE_NAMESPACE
QT_BEGIN_NAMESPACE
namespace Ui { class MainWindow; }
QT_END_NAMESPACEclass MainWindow : public QMainWindow
{
Q_OBJECTpublic:
MainWindow(QWidget *parent = nullptr);
~MainWindow();QTimer m_timer; //定时器
QLineSeries series; //折线数据序列
QChart *chart; //图表private slots:
void on_pushButton_clicked();private:
Ui::MainWindow *ui;
};
#endif // MAINWINDOW_H- 1
- 2
- 3
- 4
- 5
- 6
- 7
- 8
- 9
- 10
- 11
- 12
- 13
- 14
- 15
- 16
- 17
- 18
- 19
- 20
- 21
- 22
- 23
- 24
- 25
- 26
- 27
- 28
- 29
- 30
- 31
- 32
- 33
- 34
- 35
-
MainWidget.cpp文件源码
#include "mainwindow.h" #include "ui_mainwindow.h" #include <QDebug> #include <QRandomGenerator> #include <QTimer>#define DATA_SIZE 10 //绘制数据点数
MainWindow::MainWindow(QWidget *parent)
: QMainWindow(parent)
, ui(new Ui::MainWindow)
{
ui->setupUi(this);series = new QLineSeries(); //创建折线图数据序列
series->setUseOpenGL(true); //openGl 加速chart = new QChart(); //创建图表
chart->legend()->hide(); //隐藏图例
chart->addSeries(series); //添加数据序列
chart->createDefaultAxes(); //基于已添加到图表中的系列为图表创建轴,必须在将所有系列添加到图表后调用此函数
chart->setTitle("标题"); //设置图表标题QValueAxis m_axisX = (QValueAxis)chart->axes(Qt::Horizontal, series).at(0);//获取图表中的横坐标轴
QValueAxis m_axisY = (QValueAxis)chart->axes(Qt::Vertical, series).at(0); //获取图表中的纵坐标轴
m_axisX->setRange(0,DATA_SIZE); //设置坐标轴范围
m_axisX->setGridLineVisible(true); //设置网格线可见
m_axisX->setTickCount(11); //设置一级刻度分为几个
m_axisX->setMinorTickCount(0); //设置二级刻度分为几个
m_axisX->setTitleText("X轴"); //设置横轴标题
m_axisY->setRange(0,1000);
m_axisY->setGridLineVisible(true);
m_axisY->setTickCount(6);
m_axisY->setMinorTickCount(0);
m_axisY->setTitleText("Y轴");ChartView *l_view = new ChartView(chart); //使用自定义类
l_view->setChart(chart); //添加图表
l_view->setRenderHint(QPainter::Antialiasing); //设置渲染器,优化图像质量
//ui->chartView->setRubberBand(QChartView::RectangleRubberBand); //鼠标左键选框放大,右键点击缩小,但左键如果点在绘制的线上时无法拉取选框ui->gridLayout_2->addWidget(l_view);
//使用定时器更新数据
m_timer = new QTimer(this); //初始化定时器
connect(m_timer, &QTimer::timeout,
[&]()
{
QVector<QPointF> point(DATA_SIZE + 1);
for(int i = 0; i < DATA_SIZE + 1; i++)
{
point[i].setX(i);
point[i].setY((int)QRandomGenerator::global()->bounded(1,1000));
}
series->replace(point); //更新数据
});
m_timer->start(1); //开启定时器,每1毫秒显示一帧图像}
MainWindow::~MainWindow()
{
delete ui;
}//暂停定时器
void MainWindow::on_pushButton_clicked()
{
m_timer->stop();
}- 1
- 2
- 3
- 4
- 5
- 6
- 7
- 8
- 9
- 10
- 11
- 12
- 13
- 14
- 15
- 16
- 17
- 18
- 19
- 20
- 21
- 22
- 23
- 24
- 25
- 26
- 27
- 28
- 29
- 30
- 31
- 32
- 33
- 34
- 35
- 36
- 37
- 38
- 39
- 40
- 41
- 42
- 43
- 44
- 45
- 46
- 47
- 48
- 49
- 50
- 51
- 52
- 53
- 54
- 55
- 56
- 57
- 58
- 59
- 60
- 61
- 62
- 63
- 64
- 65
- 66
- 67
- 68
- 69
- 70
- 71
- 72
-
ChartView.h文件源码。
#ifndef CHARTVIEW_H #define CHARTVIEW_H#include <QChartView>
#include <QMouseEvent>
#include <QGraphicsSimpleTextItem>QT_CHARTS_USE_NAMESPACE
class ChartView : public QChartView
{
Q_OBJECTpublic:
ChartView(QChart chart, QWidget parent = nullptr);
~ChartView();protected:
void mouseDoubleClickEvent(QMouseEvent event);
void mousePressEvent(QMouseEvent event);
void mouseMoveEvent(QMouseEvent event);
void mouseReleaseEvent(QMouseEvent event);
void wheelEvent(QWheelEvent *event);private:
QPoint m_pointUsed; //保存旧坐标
bool m_isPress; //是否按下鼠标
double m_dMinX, m_dMaxX, m_dMinY, m_dMaxY; //保存图表轴初始大小
};#endif // CHARTVIEW_H
- 1
- 2
- 3
- 4
- 5
- 6
- 7
- 8
- 9
- 10
- 11
- 12
- 13
- 14
- 15
- 16
- 17
- 18
- 19
- 20
- 21
- 22
- 23
- 24
- 25
- 26
- 27
- 28
- 29
- 30
- 31
- 32
- 33
-
ChartView.cpp文件源码。
#include "chartview.h" #include <QValueAxis> #include <QWidget> #include <QDebug> #include <QLineSeries> #include <math.h> #include <QToolTip>ChartView::ChartView(QChart chart, QWidget parent):QChartView(chart)
{
//保存图表初始大小
QValueAxis l_axisX = (QValueAxis)this->chart()->axes(Qt::Horizontal).at(0);
m_dMinX = l_axisX->min();
m_dMaxX = l_axisX->max();
QValueAxis l_axisY = (QValueAxis)this->chart()->axes(Qt::Vertical).at(0);
m_dMinY = l_axisY->min();
m_dMaxY = l_axisY->max();
}ChartView::~ChartView()
{}
//鼠标按下
void ChartView::mousePressEvent(QMouseEvent *event)
{if (event->button() Qt::LeftButton) //鼠标左键按下
{
m_pointUsed = event->pos(); //保存当前坐标
m_isPress = true;
}
else if(event->button() Qt::MidButton) //鼠标中键按下
{
QLineSeries l_series = (QLineSeries)this->chart()->series().at(0); //获取序列中的值
QVector<QPointF> l_vpointF = l_series->pointsVector();
QPointF l_curVal = this->chart()->mapToValue(event->pos()); //返回鼠标处的值
QPointF l_pointF = l_vpointF.at(qRound(l_curVal.x())); //获取离鼠标的横坐标最近的点QString l_strPos = QString("x:%0 y:%1").arg(l_pointF.x()).arg(l_pointF.y());
QString l_stStyle = "<p style="background:#00FFFF; border-radius: 1px 5px;font:12pt '宋体'">%1</p>";
QToolTip::showText(cursor().pos(), l_stStyle.arg(l_strPos), this, QRect(0,0,1,1), 10000); //在点击位置显示提示信息
}
}//鼠标双击
void ChartView::mouseDoubleClickEvent(QMouseEvent *event)
{
if (event->button() == Qt::RightButton) //鼠标右键双击恢复最初大小
{
this->chart()->axes(Qt::Horizontal).at(0)->setRange(m_dMinX, m_dMaxX);
this->chart()->axes(Qt::Vertical).at(0)->setRange(m_dMinY, m_dMaxY);
}
}//鼠标移动
void ChartView::mouseMoveEvent(QMouseEvent *event)
{
if(m_isPress)
{
QPoint l_pointDiff = event->pos() - m_pointUsed; //当前坐标与按下鼠标处的坐标差
this->chart()->scroll(-l_pointDiff.x(), l_pointDiff.y()); //移动图表
}
m_pointUsed = event->pos(); //保存当前坐标
}//鼠标释放
void ChartView::mouseReleaseEvent(QMouseEvent *event)
{
m_isPress = false;
}//鼠标滚轮缩放
void ChartView::wheelEvent(QWheelEvent *event)
{
QPointF l_curVal = this->chart()->mapToValue(event->pos()); //返回鼠标处的值QValueAxis l_axisX = (QValueAxis)this->chart()->axes(Qt::Horizontal).at(0);
double l_fMinX = l_axisX->min();
double l_fMaxX = l_axisX->max();
QValueAxis l_axisY = (QValueAxis)this->chart()->axes(Qt::Vertical).at(0);
double l_fMinY = l_axisY->min();
double l_fMaxY = l_axisY->max();double l_fZoomMinX,l_fZoomMaxX,l_fZoomMinY,l_fZoomMaxY;
if(event->delta() > 0) //获取放大值
{
l_fZoomMinX = l_curVal.x() - (l_curVal.x() - l_fMinX) / 1.5;
l_fZoomMaxX = l_curVal.x() + (l_fMaxX - l_curVal.x()) / 1.5;
l_fZoomMinY = l_curVal.y() - (l_curVal.y() - l_fMinY) / 1.5;
l_fZoomMaxY = l_curVal.y() + (l_fMaxY - l_curVal.y()) / 1.5;
}
else //获取缩小值
{
l_fZoomMinX = l_curVal.x() - (l_curVal.x() - l_fMinX) 1.5;
l_fZoomMaxX = l_curVal.x() + (l_fMaxX - l_curVal.x()) 1.5;
l_fZoomMinY = l_curVal.y() - (l_curVal.y() - l_fMinY) 1.5;
l_fZoomMaxY = l_curVal.y() + (l_fMaxY - l_curVal.y()) 1.5;
}
this->chart()->axes(Qt::Vertical).at(0)->setRange(l_fZoomMinY, l_fZoomMaxY); //设置轴范围
this->chart()->axes(Qt::Horizontal).at(0)->setRange(l_fZoomMinX, l_fZoomMaxX);
}- 1
- 2
- 3
- 4
- 5
- 6
- 7
- 8
- 9
- 10
- 11
- 12
- 13
- 14
- 15
- 16
- 17
- 18
- 19
- 20
- 21
- 22
- 23
- 24
- 25
- 26
- 27
- 28
- 29
- 30
- 31
- 32
- 33
- 34
- 35
- 36
- 37
- 38
- 39
- 40
- 41
- 42
- 43
- 44
- 45
- 46
- 47
- 48
- 49
- 50
- 51
- 52
- 53
- 54
- 55
- 56
- 57
- 58
- 59
- 60
- 61
- 62
- 63
- 64
- 65
- 66
- 67
- 68
- 69
- 70
- 71
- 72
- 73
- 74
- 75
- 76
- 77
- 78
- 79
- 80
- 81
- 82
- 83
- 84
- 85
- 86
- 87
- 88
- 89
- 90
- 91
- 92
- 93
- 94
- 95
- 96
- 97
- 98
- 99
- 100
- 101
- 102
- 103
- 104
-
setUseOpenGL对性能的引响:
- 1000数据:setUseOpenGL设为true时需要12.5毫秒,设为false时需要14毫秒;
- 10000数据:setUseOpenGL设为true时需要13.5毫秒,设为false时需要56.8毫秒;
- 100000数据:setUseOpenGL设为true时需要20.7毫秒,设为false时需要507.4毫秒;
- 500000数据:setUseOpenGL设为true时需要194.25毫秒,设为false时需要507.4毫秒;

 浙公网安备 33010602011771号