
ELK之使用metricbeat收集系统数据及其他程序并生成可视化图表
将 Metricbeat 部署到您所有的 Linux、Windows 和 Mac 主机,并将它连接到 Elasticsearch 就大功告成啦:您可以获取系统级的 CPU 使用率、内存、文件系统、磁盘 IO 和网络 IO 统计数据,以及获得如同系统上 top 命令类似的各个进程的统计数据
1,安装metricbeat
官网下载rpm包安装
rpm -ivh /nas/nas/softs/elk/6.5.4/metricbeat-6.5.4-x86_64.rpm
默认开启了system模块使用命令查看模块
metricbeat modules list

Enabled:
system

Disabled:
aerospike
apache
ceph
couchbase
docker
dropwizard
elasticsearch
envoyproxy
etcd
golang
graphite
haproxy
http
jolokia
kafka
kibana
kubernetes
kvm
logstash
memcached
mongodb
munin
mysql
nginx
php_fpm
postgresql
prometheus
rabbitmq
redis
traefik
uwsgi
vsphere
windows
zookeeper
PS:Enabled模块为启用模块 Disabled模块为未启用模块
启用新模块命令,例如启用nginx模块
metricbeat modules enable nginx
修改配置文件监控系统CPU,内存等信息
#包含其他模块的配置文件
metricbeat.config.modules:
  path: ${path.config}/modules.d/*.yml
  reload.enabled: false
setup.template.settings:
  index.number_of_shards: 1
  index.codec: best_compression
#开启dashboards
setup.dashboards.enabled: true
#输出至kibana
setup.kibana:
  host: "172.16.90.24:5601"
#输出至elssticsearch
output.elasticsearch:
  hosts: ["172.16.90.24:9200"]
processors:
  - add_host_metadata: ~
  - add_cloud_metadata: ~
启动metricbeat
systemctl start metricbeat
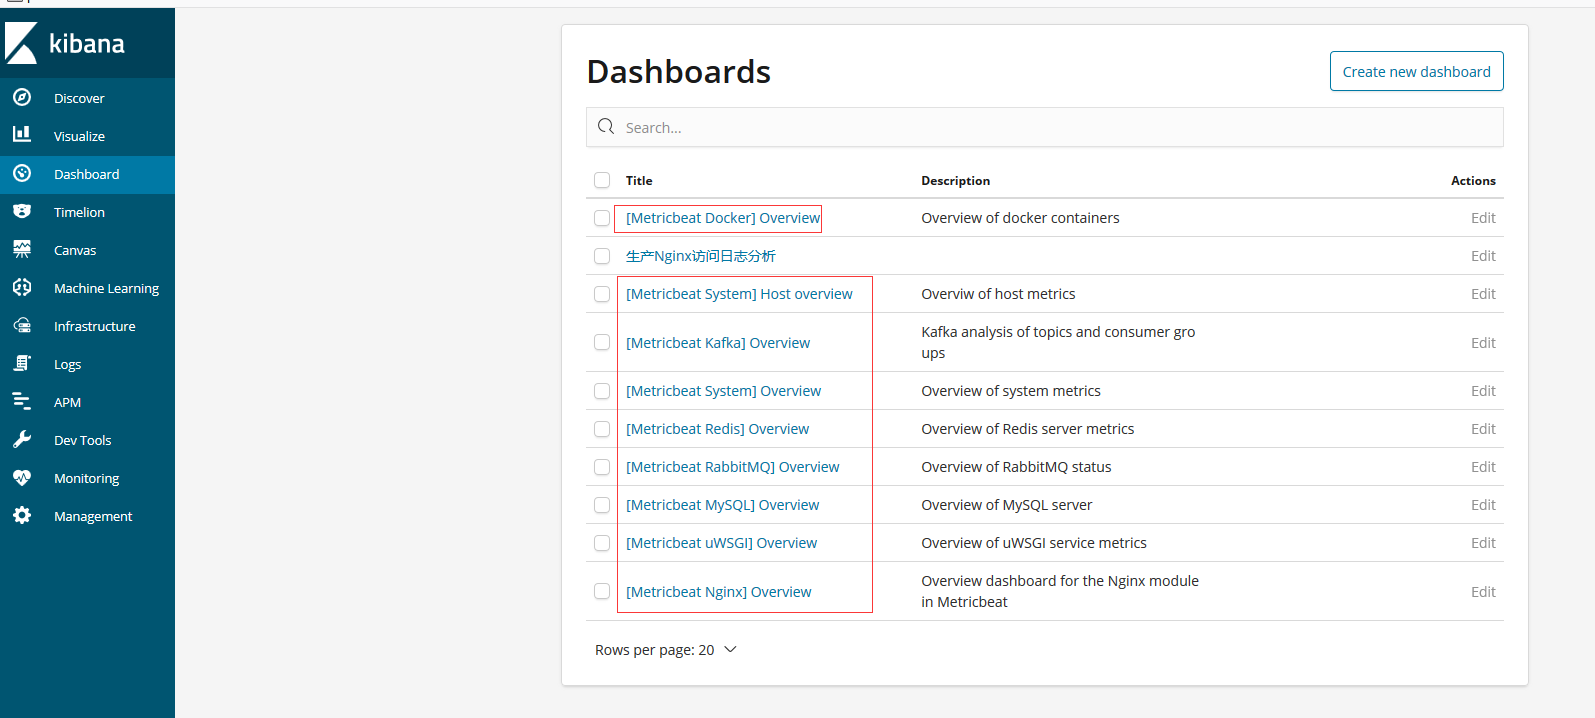
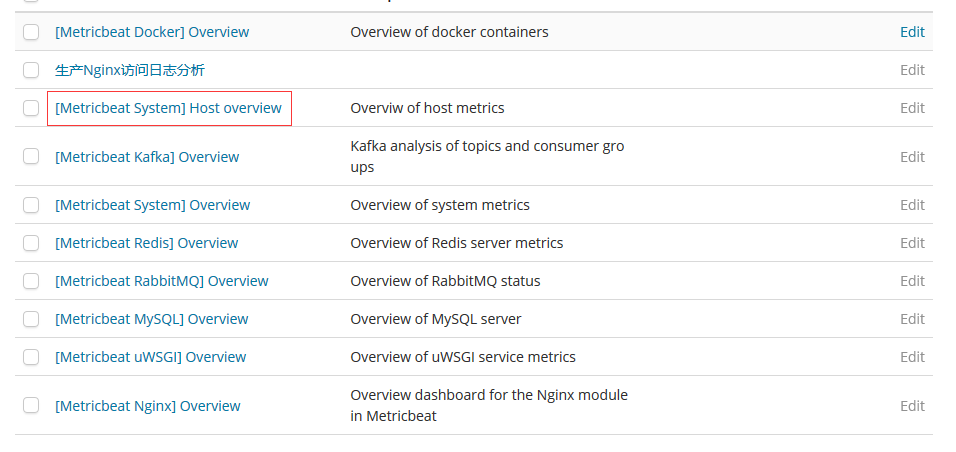
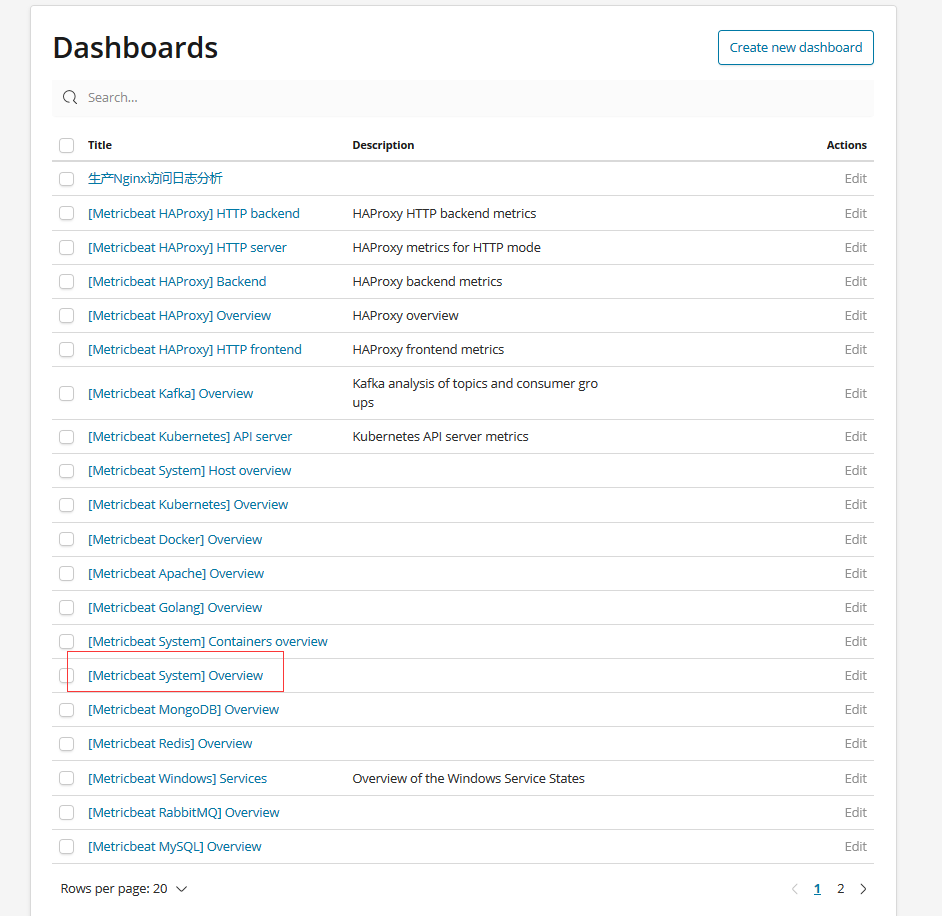
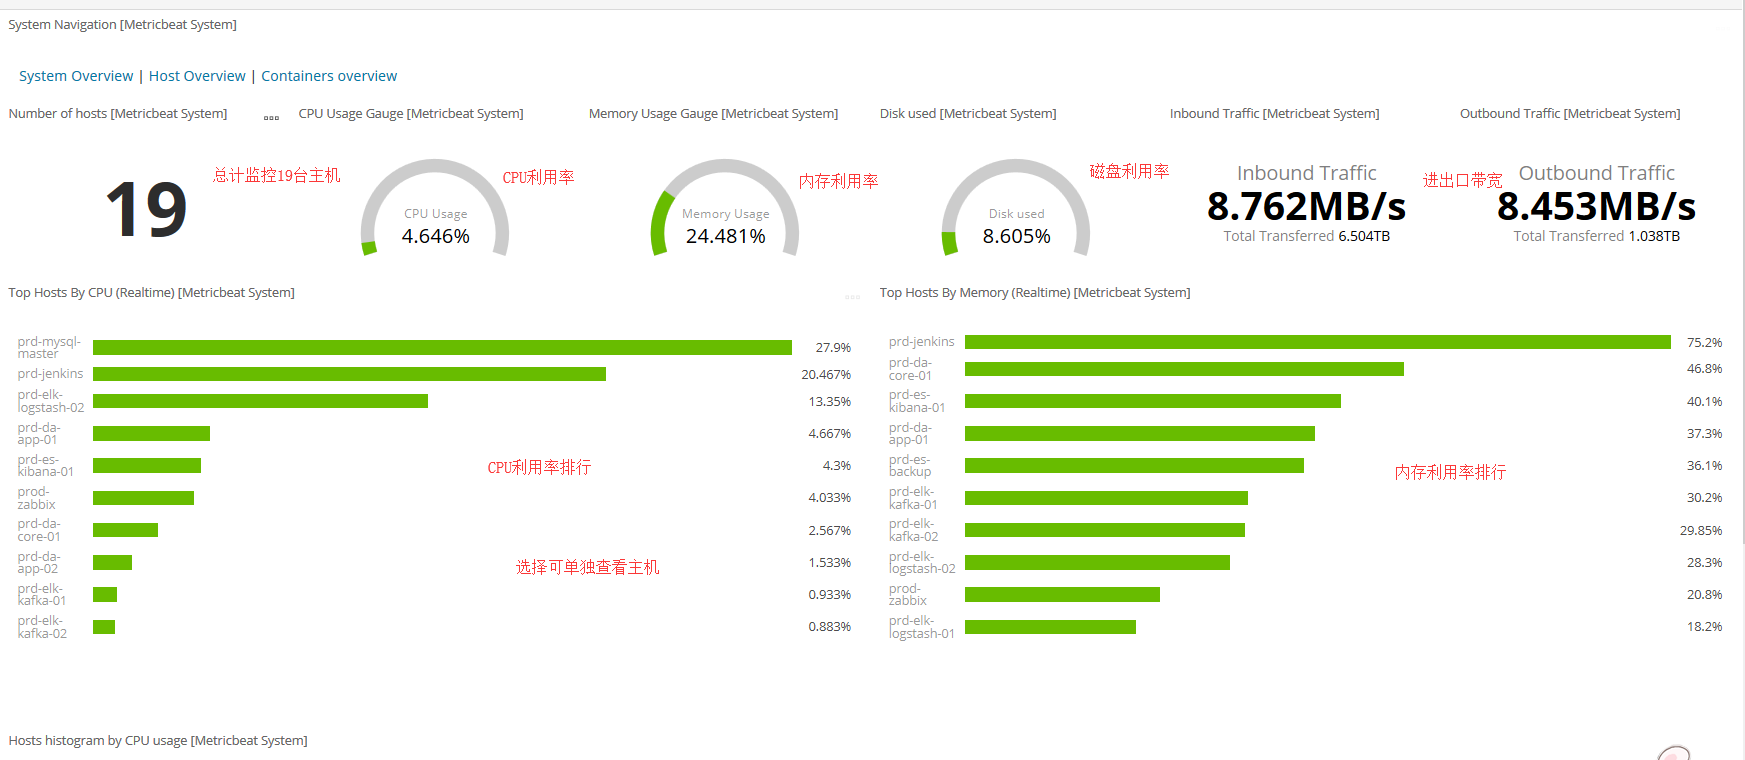
打开kibana页面查看自动生成了一些图表
查看hostview
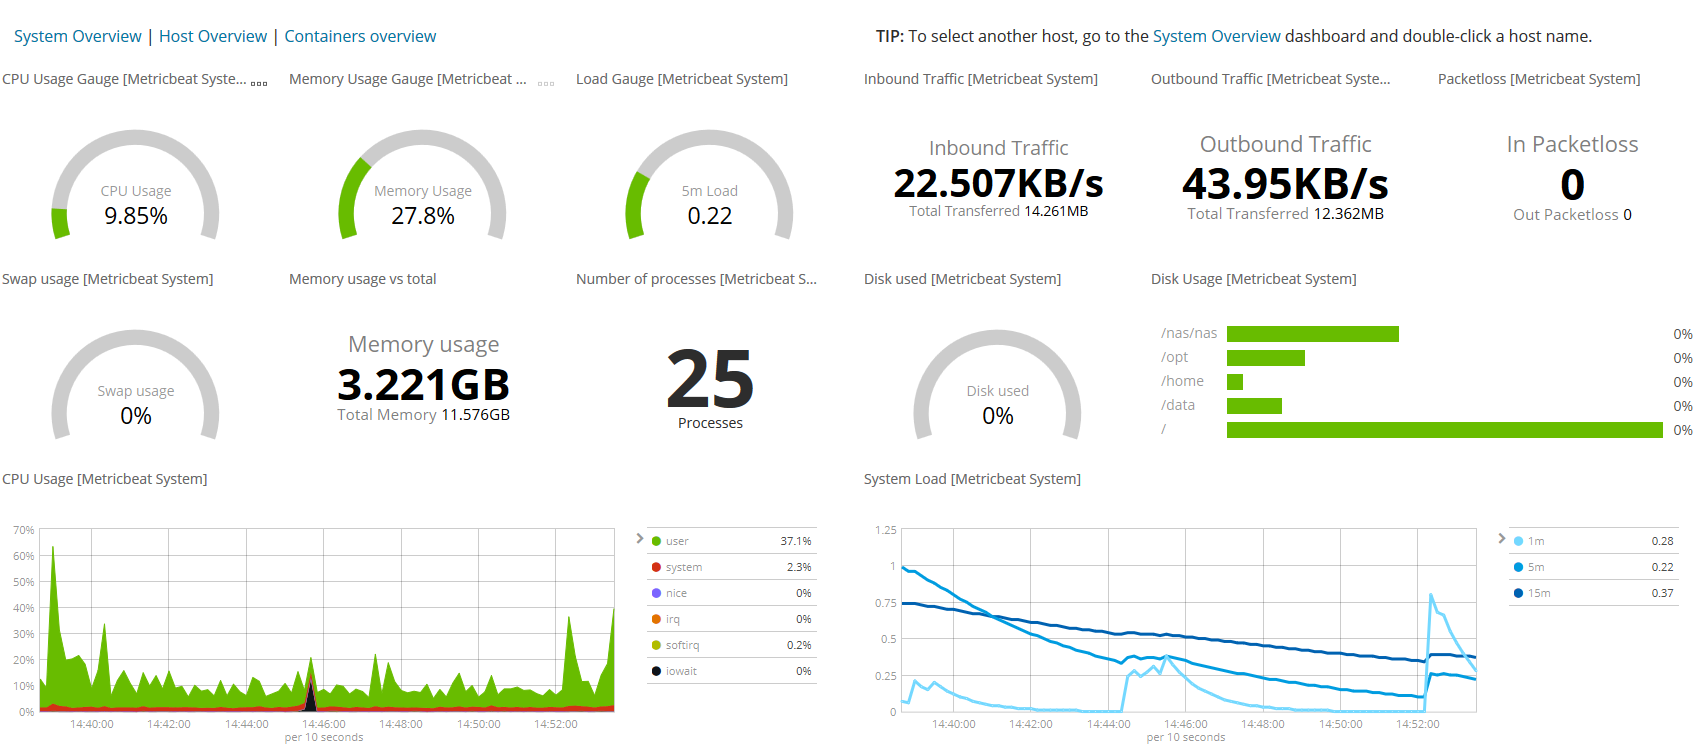
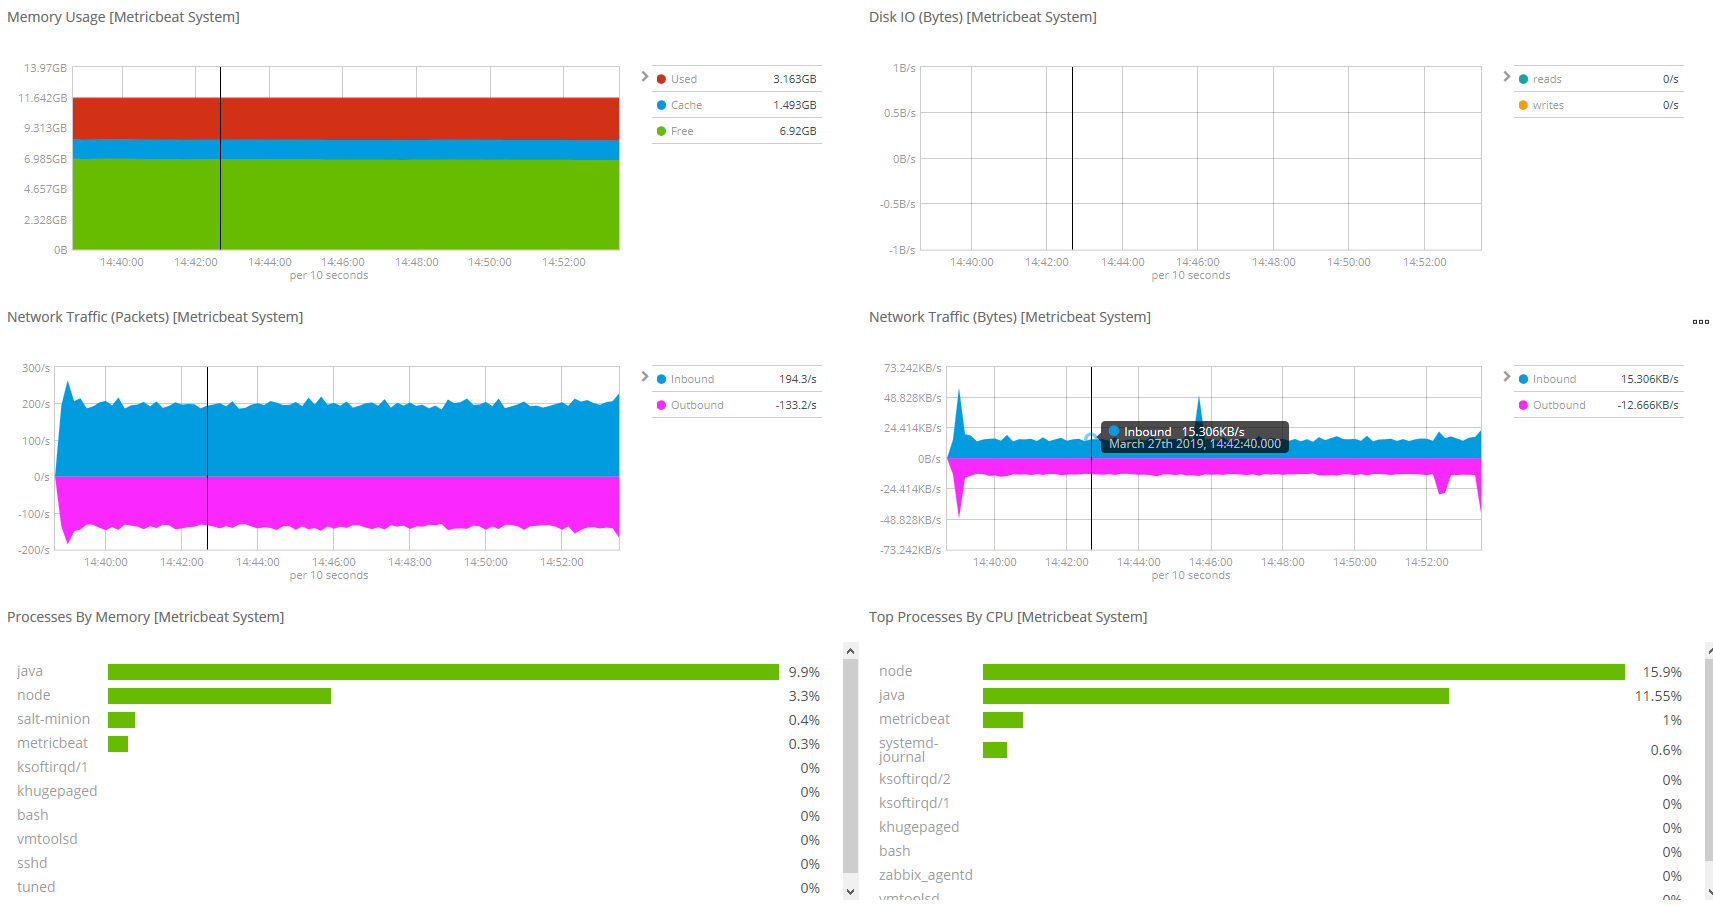
如果多个主机需要监控系统性能查看
2,设置监控nginx性能
开启nginx模块
metricbeat modules enable nginx
修改metricbeat配置文件/etc/metricbeat/modules.d/nginx.yml
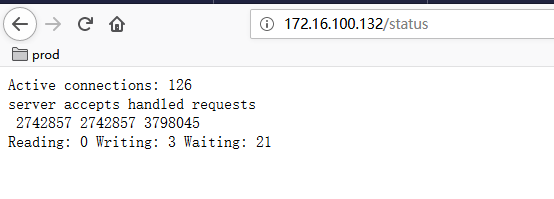
- module: nginx
  metricsets: ["stubstatus"]
  hosts: ["http://172.16.100.132"]
  #username: "user"
  #password: "secret"
  server_status_path: "status"
PS:监控nginx前提需要开启nginx状态模块并在nginx配置下添加以下配置
server{
    listen 80;
    server_name 172.16.100.132;
    location /status
    {
        stub_status;
        access_log off;
    }
}
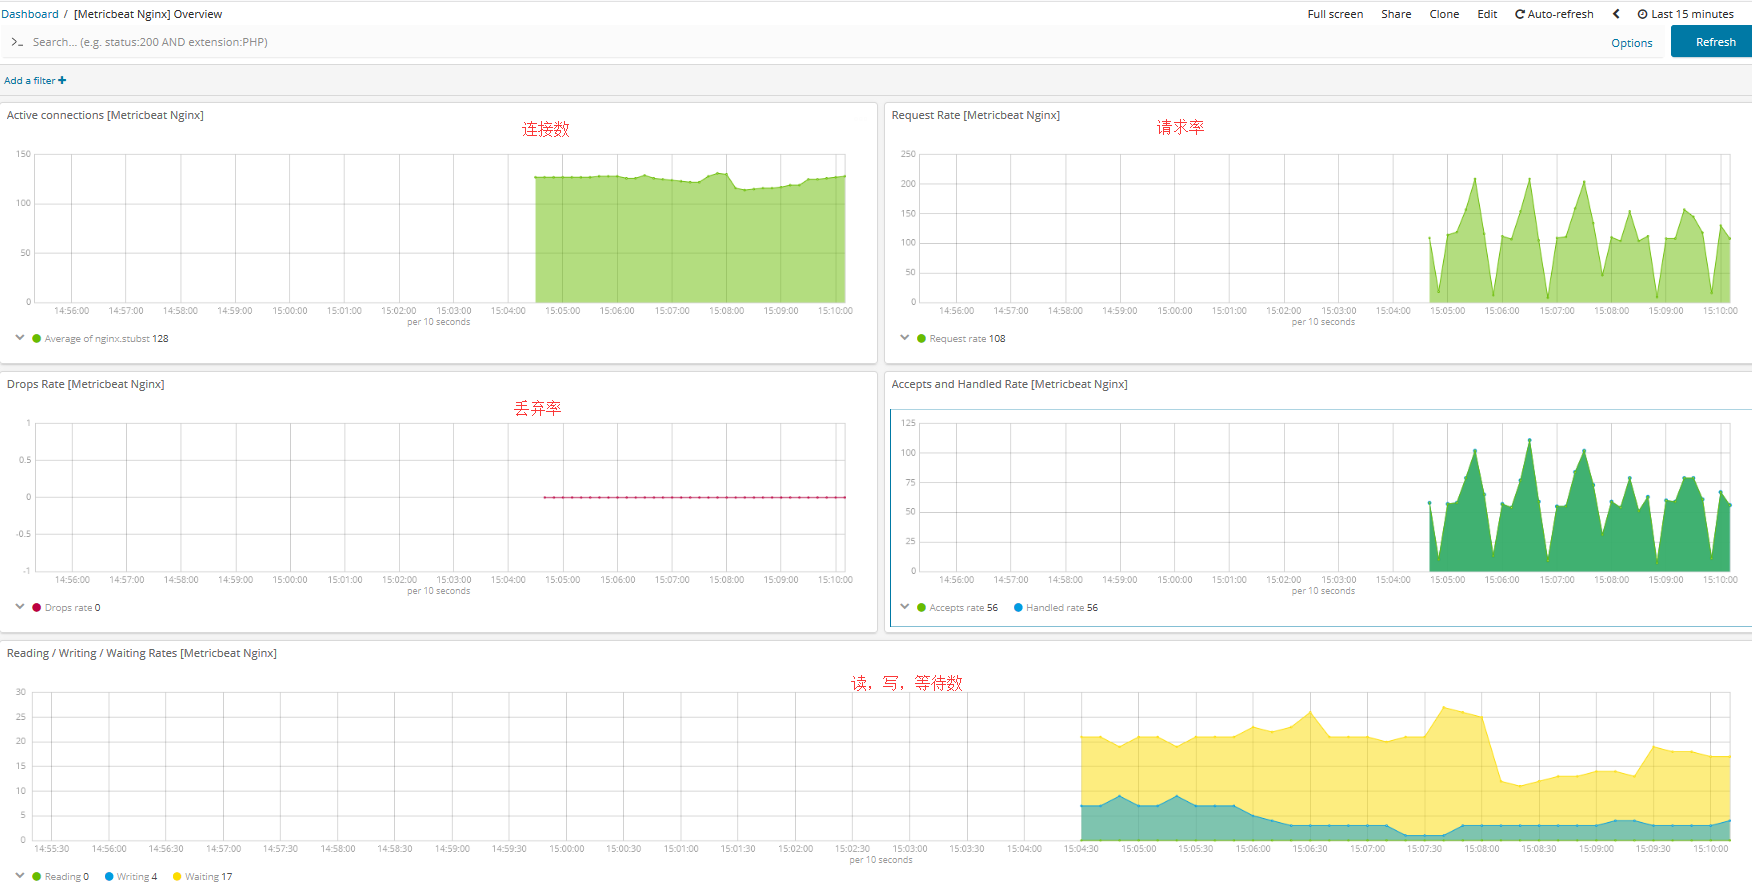
配置成功在web页面可以查看到以下信息
重启metricbeat查看
3,设置监控MySQL
开启MySQL模块
metricbeat modules enable mysql
修改配置文件
/etc/metricbeat/modules.d/mysql.yml
- module: mysql
  metricsets:
    - status
  #  - galera_status
  period: 10s

  # Host DSN should be defined as "user:pass@tcp(127.0.0.1:3306)/"
  # The username and password can either be set in the DSN or using the username
  # and password config options. Those specified in the DSN take precedence.
  hosts: ["tcp(172.16.90.180:3306)/"]

  # Username of hosts. Empty by default.
  username: root

  # Password of hosts. Empty by default.
  password: secret
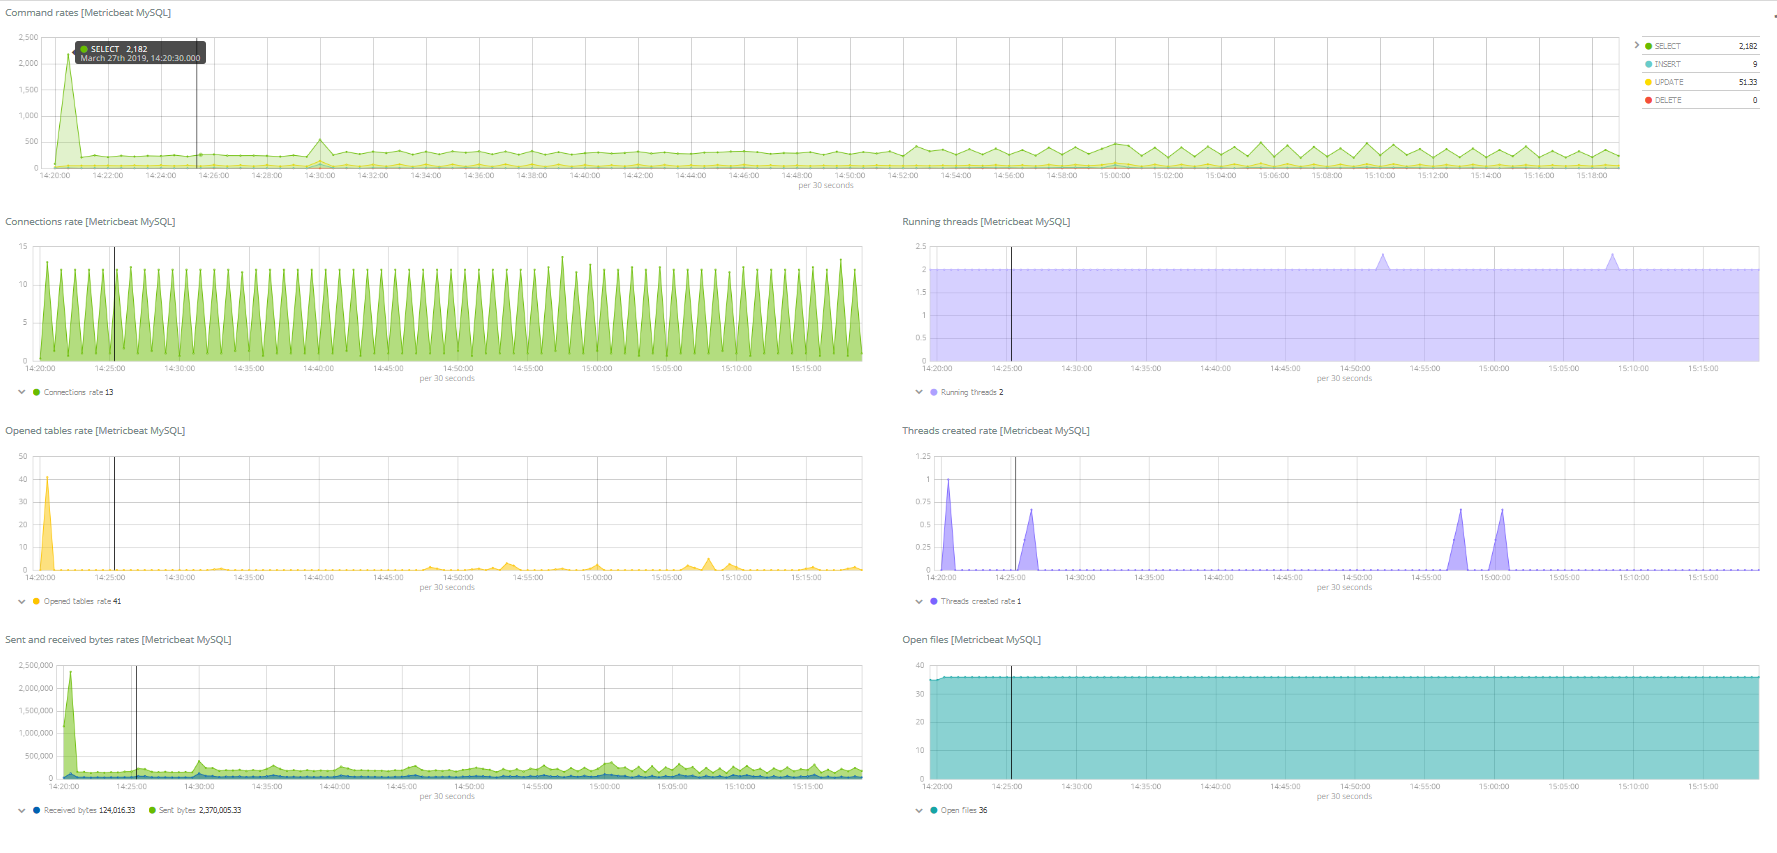
kibana页面查看
4,设置监控redis
开启redis模块
metricbeat modules enable redis
修改配置文件
/etc/metricbeat/modules.d/redis.yml
- module: redis
  hosts: ["172.16.90.181:6379"]
  metricsets: ["info","keyspace"]
  enables: true
  period: 10s
  password: password
PS:如果redis没有设置认证则密码不配置
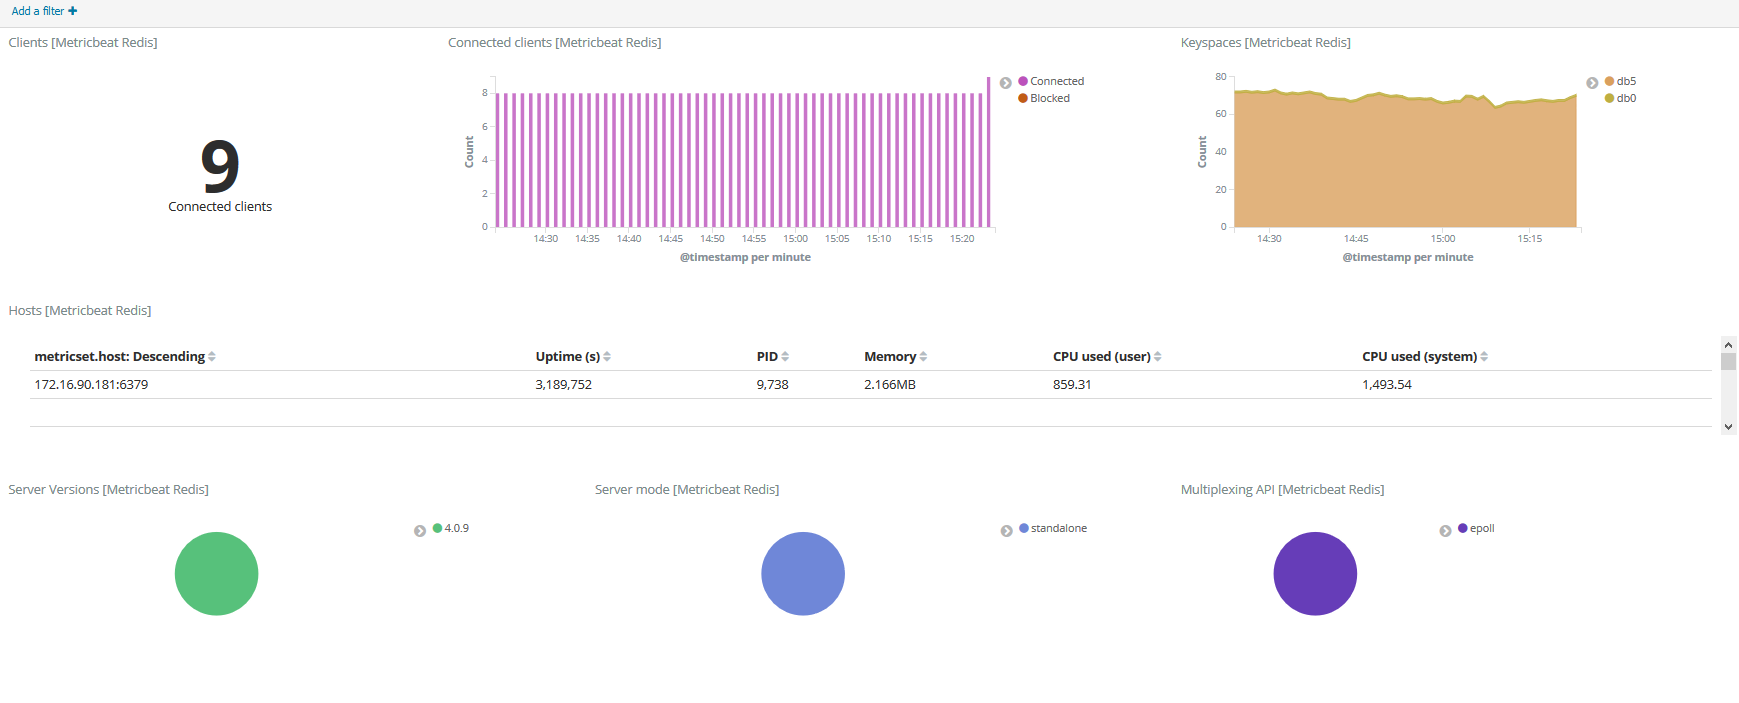
kibana查看
5,设置监控rabbitmq
开启rabbitmq模块
metricbeat modules enable rabbitmq
修改配置文件
/etc/metricbeat/modules.d/rabbitmq.yml
- module: rabbitmq
  metricsets: ["node", "queue", "connection"]
  enabled: true
  period: 10s
  hosts: ["172.16.90.46:15672"]
  username: admin
  password: password
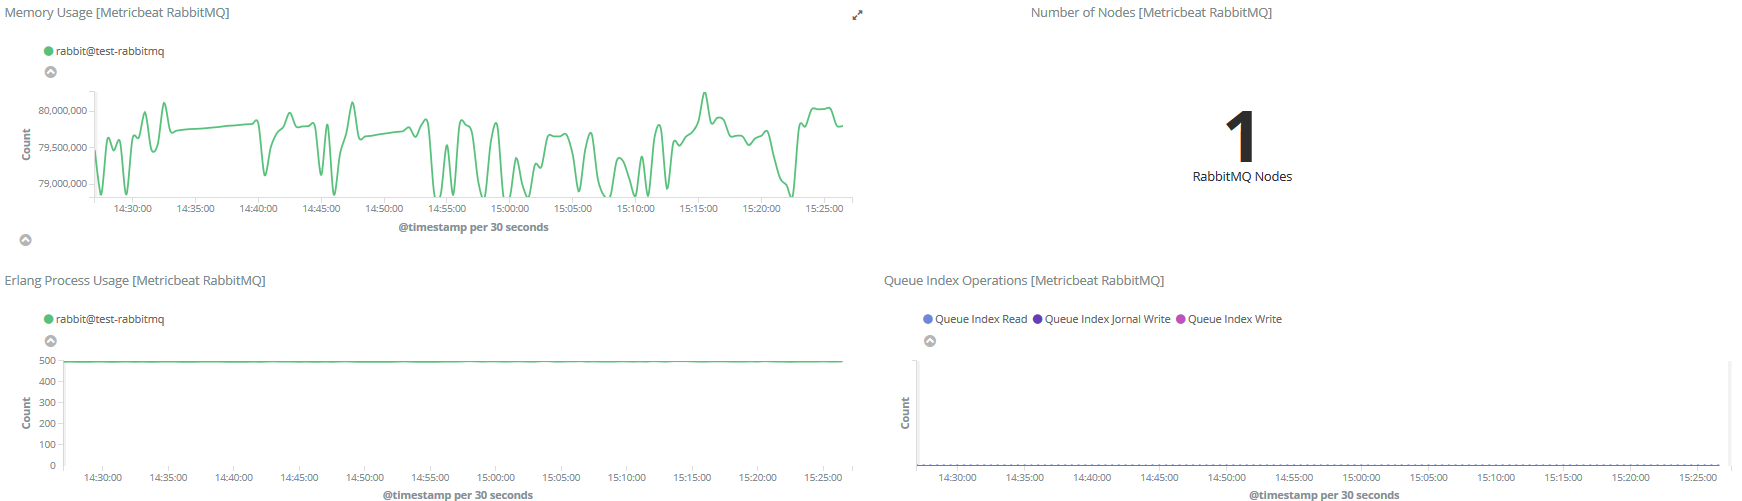
kibana页面查看
6,设置监控kafka
开启kafka监控模块
metricbeat modules enable kafka
修改配置文件
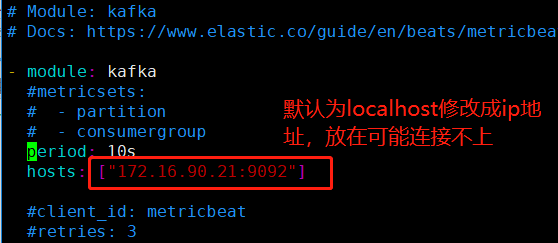
/etc/metricbeat/modules.d/kafka.yml
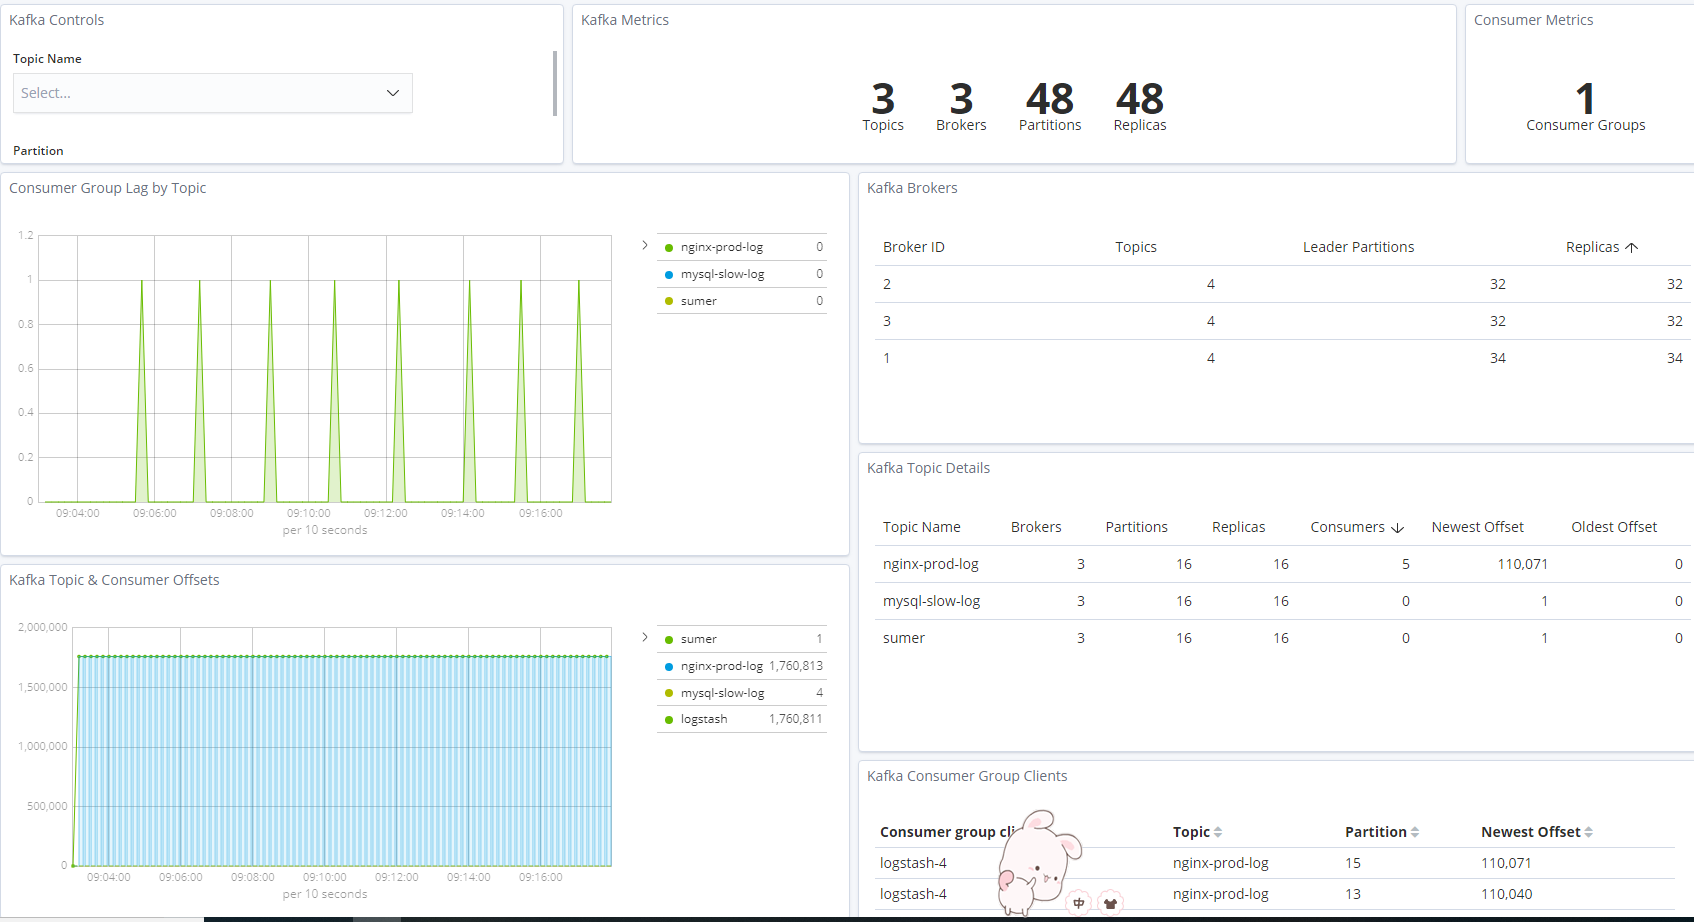
kibana页面查看
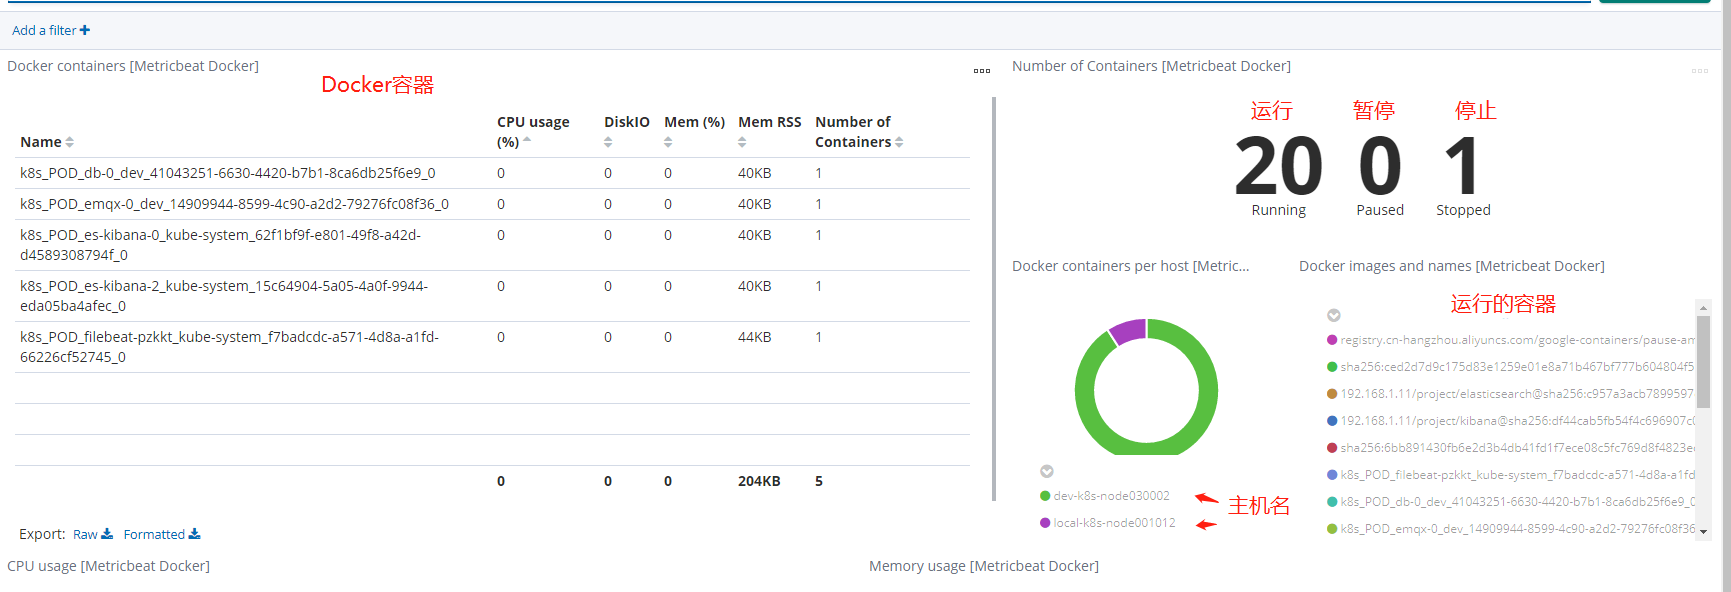
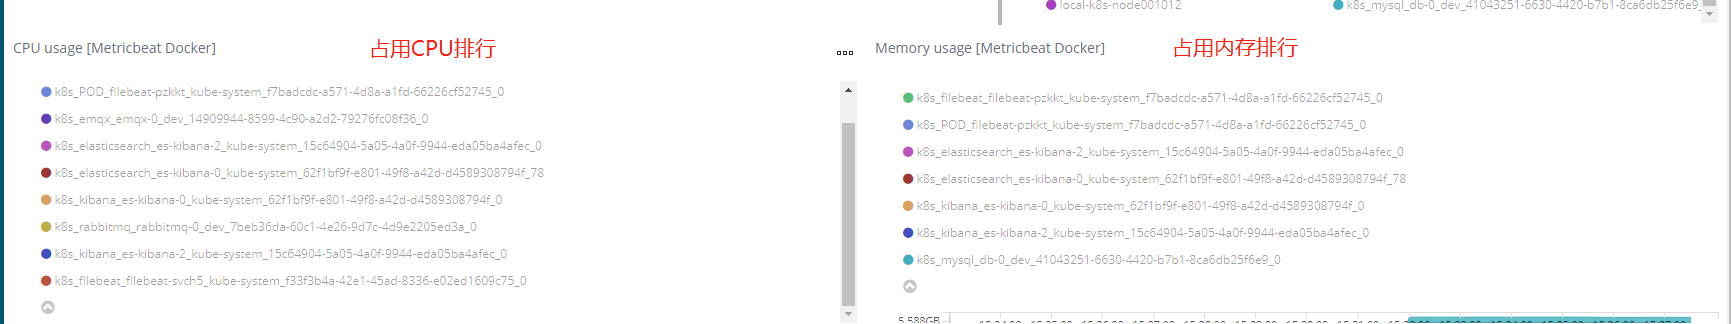
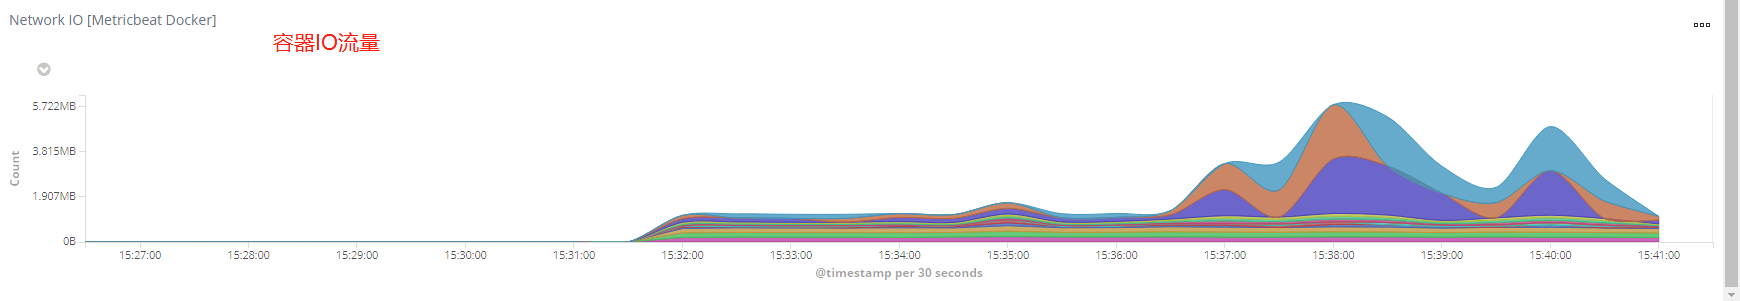
7,设置监控docker
开启docker监控模块
metricbeat modules enable docker
设置生效
metricbeat setup
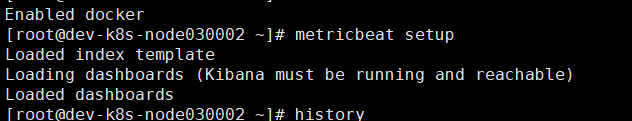
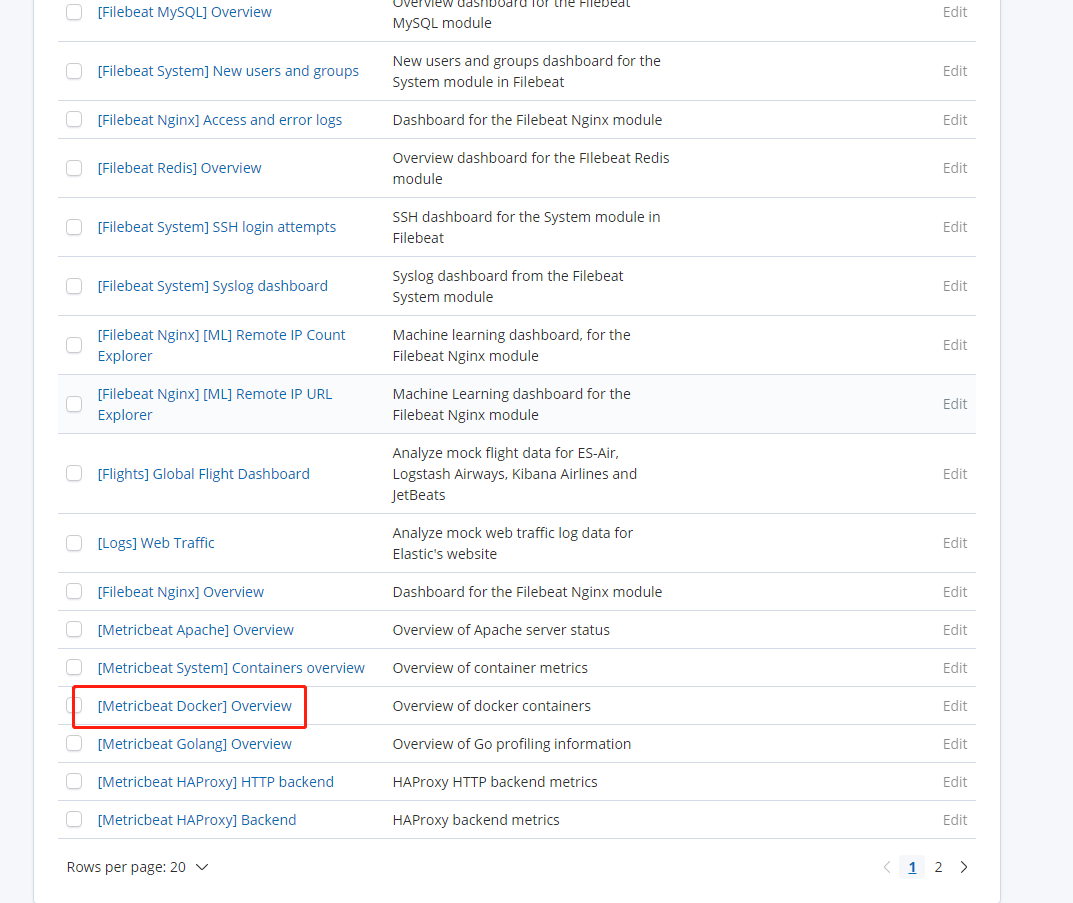
登录kibana查看
其他程序监控可参考官方文档 https://www.elastic.co/guide/en/beats/metricbeat/current/metricbeat-modules.html

 浙公网安备 33010602011771号