Java内存区域与内存溢出异常
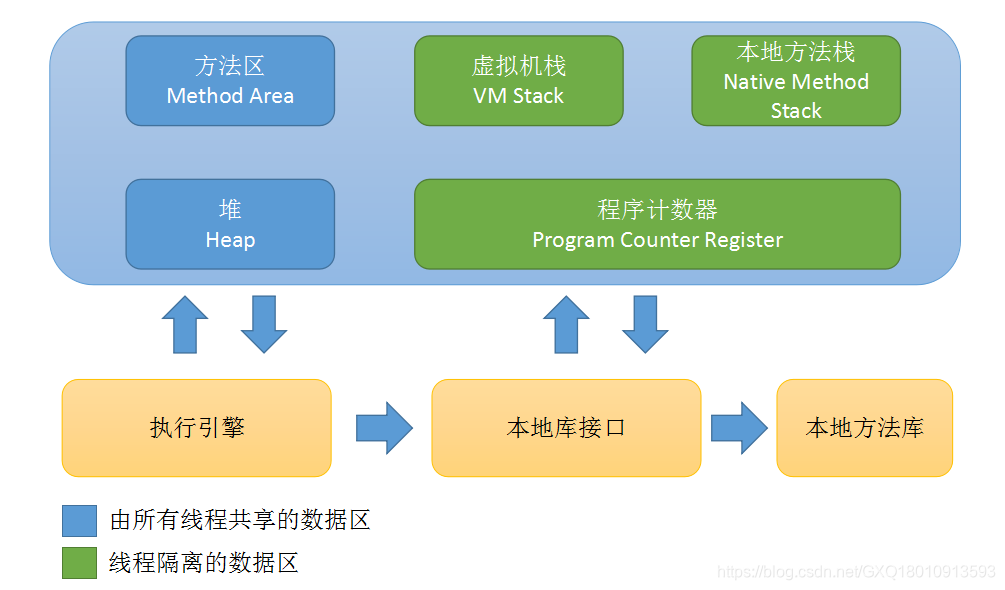
程序计数器(Program Counter Register)
当前线程所执行的字节码的行号指示器,每个线程都有独立的程序计数器,互不影响,独立存储,这类内存区域为“线程私有”的内存。
native方法:值为空(undefined)。
唯一一个没有规定任何OutOfMemoryError情况的区域。
Java虚拟机栈(Java Virtual Machine Stack)
线程私有,生命周期与线程相同。描述的是Java方法执行的线程内存模型:每个方法被执行的时候,Java虚拟机都会同步创建一个栈帧(Stack Frame)用于存储局部变量表、操作数栈、动态连接、方法出口等信息。每一个方法被调用直至执行完毕的过程,就对应着一个栈帧在虚拟机栈中从入栈到出栈的过程。
局部变量表:基本数据类型(boolean、byte、char、short、int、float、long、double)、对象引用(reference类型)和returnAddress类型(指向一条字节码指令的地址)。存储空间用局部变量槽(Slot)表示,long和double占两个变量槽。
异常状况:
1、线程请求的栈深度大于虚拟机所允许的深度,StackOverflowError;
2、如果Java虚拟机栈容量可以动态扩展,当栈扩展是无法申请到足够的内存会抛出OutOfMemoryError异常。
本地方法栈(Native Method Stacks)
与虚拟机栈作用相似,虚拟机栈:Java方法,本地方法栈:Native方法;
有些Java虚拟机会把两种栈合二为一。
异常状况同上。
Java 堆(Java Heap)
内存最大,被所有线程共享,虚拟机启动时创建。
只存放对象实例,“几乎”所有对象实例在这里分配内存。
是垃圾收集器管理的内存,也被叫做GC堆(Garbage Collected Heap)。
可以划分出多个线程私有的分配缓冲区(Thread Local Allocation Buffer,TLAB),以提升对象分配时的效率。
可以处于物理上不连续的内存空间中,在逻辑上视为连续。
可固定大小,也可扩展,取决于实现方式,通过参数-Xmx和-Xms设定。
如果没有内存为对象实例分配,并且堆无法再扩展,OutOfMemoryError。
方法区(Method Area)
线程共享,存储被虚拟机加载的类型信息、常量、静态变量、即时编译器编译后的代码缓存等数据。
内存回收目标主要是针对常量池的回收核对类型的卸载。
如果方法区无法满足新的内存分配需求时,OutOfMemoryError。
运行时常量池(Runtime Constant Pool)
是方法区的一部分。
class文件的常量池表(Constant Pool Table),存放编译期生成的各种字面量与符号引用,在类加载后存放到方法区的运行时常量池中。
异常同上。
直接内存(Direct Memory)
不属于运行时数据区。
JDK 1.4: NIO(New Input/Output)类,基于通道(channel)和缓冲区(Buffer)的I/O方式。利用Native函数库直接分配堆外内存,通过一个存储在Java堆里面的DirectByteBuffer对象来做欸这块内存的引用。避免在Java堆和Native堆中来回复制数据。
可能会在配置虚拟机参数时,根据实际内存去设置-Xmx等参数信息,但经常忽略直接内存,导致各个内存区域总和大于物理内存限制。从而导致动态扩展时出现OutOfMemoryError异常。
HotSpot虚拟机对象
Java堆中对象分配、布局和访问的全过程
对象的创建
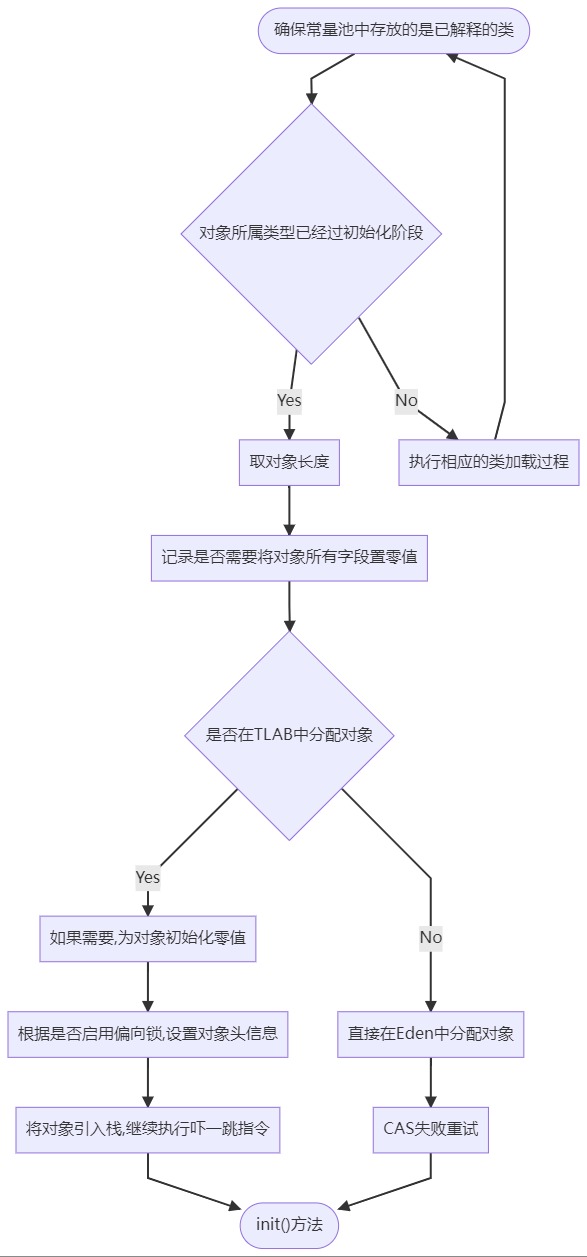
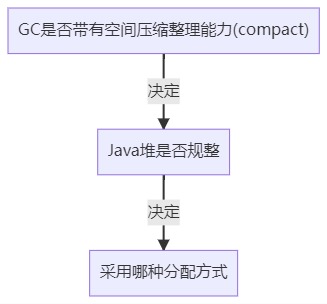
Java堆中分配内存的方法:
指针碰撞(Bump The Pointer):绝对规整
空闲列表(Free List):并不规整
分配空间时的线程安全问题解决方法:
1、CAS配上失败重试
2、TLAB,-XX:+/-UseTLAB
对象的内存布局
对象头(Header)、实例数据(Instance Data)、对齐方式(Padding)
对象头包含两类信息:
1、对象自身的运行时数据,Mark Word
2、类型指针,指向它的类型元数据的指针(确定该对象是哪个类的实例)
实例数据注意数据存储顺序,-XX:FieldsAllocationStyle +XX:CompactFields
对齐方式无意义,凑8字节的整数倍
对象的访问定位
通过栈上的reference数据操作堆上的具体对象
对象访问方式:
1、使用句柄
2、使用直接指针
OOM exception and solution(手痒练练英文水平,可以在翻译软件翻译一下,词达意,句能懂:))
Java Heap OOM
java.lang.OutOfMemoryError: Java Heap space
Conventional processing method: Memory image analysis tool (such as Eclipse Memory Analyzer), analyse the heap transfer snapshots from dump.
PS : How to install Eclipse Memory Analyzer(mat)
first, you need to install the latest eclipse, and then, open the marketplace(help->Eclipse Marketplace)and search memory.
the location of plugin has changed, whose address is C:\Users\username\.p2\pool.
However,I suggest to download the mat from this website(https://www.eclipse.org/mat/downloads.php). After all, I found that we need to change the runtime memory size(you can check the mentioned blog at the end of the text), otherwise itself will occur Java heap overflow when it opens a dump file to find out which part cause the Java leap overflow. It just like a doctor intend to treat a psychotic patient, however, the doctor becomes a psychotic patient when the doctor enter the door of ward.
First step: Confirm whether the object which result in OOM exception is necessary, and it means that identify it is Memory Leak or Memory Overflow in the end.
if this situation belongs to Memory Leak, you can use the tools to check reference chain from leaked object to GC Roots. According to related information, you can relatively accurately locate creation locations of these object.
if not belongs, checking the arguments(-Xmx and -Xms) and comparing with machine memory to see whether have spare space can upward adjustment. And check in the code whether some objects' lifetime too long, holding status' time too long or storage structure's design is not reasonable and other situations to reduce program runtime's memory consuming.
virtual machine stack and native method stacks overflow
stack capacity only can be set by the arguments(-Xss).
It has two kinds of exception:
-
stack depth, StackOverflowError
-
dynamic expansion, OutOfMemoryError
Method Area and Runtime Constant Poll overflow
Constant Pool belongs to Method Area.
Method Area belongs to permanent generation in JDK 6 or earlier, but the permanent generation had been totally substituted by Meta Space in JDK 8. And Meta Space's position in the Java heap.
This chapter use String::intern() as a example, you can know about this native function through the mentioned blog at the end of text.
Nowadays, Method Area hardly occurs overflow. Beacuse the operate system only allocate 2GB memory to each process, Constant Pool's size is big enough to hold the constant and GC can also collect constant which hasn't been referenced. Java heap's memory capacity must less than 2GB, and I just find a funny thing, the size of dump file mentioned above is 2GB.
Direct Memory overflow
Direct Memory has the same memory capacity with Java heap with default, you can use -XX:MaxDirectMemorySize to allocate space for Direct Memory.
The memory overflow caused by Direct Memory has a obviously feature that there are no exception in Heap Dump file. If you find the Heap file is very small, and your program directly or indirectly use Direct Memory (a tyoical use is NIO), you need focus on inspection the reasons for aspect of Direct Memory.
写的比较好的文章:
运行时数据区:https://www.cnblogs.com/huangdh/p/15664790.html
OOM :https://blog.csdn.net/qq_37933128/article/details/126969220
GC Roots: https://blog.csdn.net/suming97/article/details/126359521
Eclipse-MAT的插件介绍使用:https://blog.csdn.net/qq_41489540/article/details/126334339
jmap以及生成dump文件:https://blog.csdn.net/zyc1234576/article/details/120349206
String::intern():

 浙公网安备 33010602011771号