
MpAndroidChart的样式学习
本例程全部参考至油管视频https://www.youtube.com/playlist?list=PLFh8wpMiEi89LcBupeftmAcgDKCeC24bJ。colorArray数组用了res资源文件中的color.xml,在这个文件定义几个颜色就ok了。
  1 package com.example.helloworld.learnmpchart;
  2
  3 import androidx.appcompat.app.AppCompatActivity;
  4
  5 import android.graphics.Color;
  6 import android.os.Bundle;
  7
  8 import com.example.helloworld.R;
  9 import com.github.mikephil.charting.charts.LineChart;
 10 import com.github.mikephil.charting.components.AxisBase;
 11 import com.github.mikephil.charting.components.Description;
 12 import com.github.mikephil.charting.components.Legend;
 13 import com.github.mikephil.charting.components.LegendEntry;
 14 import com.github.mikephil.charting.components.XAxis;
 15 import com.github.mikephil.charting.components.YAxis;
 16 import com.github.mikephil.charting.data.BarEntry;
 17 import com.github.mikephil.charting.data.Entry;
 18 import com.github.mikephil.charting.data.LineData;
 19 import com.github.mikephil.charting.data.LineDataSet;
 20 import com.github.mikephil.charting.formatter.IValueFormatter;
 21 import com.github.mikephil.charting.formatter.ValueFormatter;
 22 import com.github.mikephil.charting.interfaces.datasets.ILineDataSet;
 23 import com.github.mikephil.charting.utils.ViewPortHandler;
 24
 25 import java.util.ArrayList;
 26
 27 public class LearnFromYoutube extends AppCompatActivity {
 28
 29     LineChart mpLineChart;
 30     int colorArray[] = {R.color.color1,R.color.color2,R.color.color3,R.color.color4};
 31     int[] colorClassArray = new int[] {Color.BLUE,Color.CYAN,Color.GREEN,Color.MAGENTA};
 32     String[] legendName = {"Cow","Dog","Cat","Rat"};
 33     LineDataSet lineDataSet1 = new LineDataSet(dataValues1(),"Data Set 1");//要给其它类用,放在外边
 34
 35     @Override
 36     protected void onCreate(Bundle savedInstanceState) {
 37         super.onCreate(savedInstanceState);
 38         setContentView(R.layout.activity_learn_from_youtube);
 39         setTitle("学习折线图");
 40
 41         mpLineChart = findViewById(R.id.line_chart);//找到折线图控件
 42         LineDataSet lineDataSet2 = new LineDataSet(dataValues2(),"Data Set 2");
 43         ArrayList<ILineDataSet> dataSets = new ArrayList<>();
 44         dataSets.add(lineDataSet1);
 45         dataSets.add(lineDataSet2);
 46
 47         lineChartStyle();//表格的样式
 48         legendStyleSetting();//设置Lengend
 49         lineStyleSetting();//设置线的样式
 50
 51         LineData data = new LineData(dataSets);
 52 //        data.setValueFormatter(new MyValueFormatter());//全部线 在原有数值后面加$
 53         lineDataSet1.setValueFormatter(new MyValueFormatter());//只设置一条线 在原有数值后面加$
 54         XAxis xAxis = mpLineChart.getXAxis();
 55         YAxis yAxisLeft = mpLineChart.getAxisLeft();
 56         YAxis yAxisRight = mpLineChart.getAxisRight();
 57
 58         xAxis.setValueFormatter(new MyAxisValueFormatter());
 59         yAxisLeft.setValueFormatter(new MyAxisValueFormatter());
 60         yAxisRight.setValueFormatter(new OfficalAxisValueFormatter());
 61
 62         mpLineChart.setData(data);
 63         mpLineChart.invalidate();
 64     }
 65
 66     /**
 67      *设置表格的样式
 68      *@author home
 69      *@time 2021/2/25 11:27
 70     */
 71     private void lineChartStyle() {
 72         //mpLineChart.setBackgroundColor(Color.GREEN);//设置背景颜色
 73         mpLineChart.setNoDataText("No Data");//设置无数据(无图表)时显示的文本
 74         mpLineChart.setNoDataTextColor(Color.BLUE);//设置无数据文本的颜色
 75
 76         mpLineChart.setDrawGridBackground(true);//设置网格背景
 77         mpLineChart.setDrawBorders(true);//设置边框
 78         mpLineChart.setBorderColor(Color.RED);//边框颜色
 79         mpLineChart.setBorderWidth(5);//边框宽度
 80
 81         Description description = new Description();//放置描述
 82         description.setText("这是描述");
 83         description.setTextColor(Color.BLACK);
 84         description.setTextSize(20);
 85         mpLineChart.setDescription(description);
 86     }
 87
 88     /**
 89      *设置Legend的样式,就是上面label部分
 90      *@author home
 91      *@time 2021/2/25 11:58
 92     */
 93     private void legendStyleSetting() {
 94         Legend legend = mpLineChart.getLegend();
 95
 96         legend.setEnabled(true);
 97         legend.setTextColor(Color.RED);//label文本的颜色
 98         legend.setTextSize(15);//label文本的大小
 99         legend.setForm(Legend.LegendForm.LINE);//label一旁图标的形状,现设置线
100         legend.setFormSize(20);//形状大小
101         legend.setXEntrySpace(15);//两个label间的距离
102         legend.setFormToTextSpace(10);//图标与 字的间距
103
104         LegendEntry[] legendEntries = new LegendEntry[4];
105
106         for (int i = 0; i < legendEntries.length; i++) {//设置颜色与名称
107             LegendEntry entry = new LegendEntry();
108             entry.formColor = colorClassArray[i];
109             entry.label = String.valueOf(legendName[i]);
110             legendEntries[i] = entry;
111         }
112         legend.setCustom(legendEntries);
113     }
114
115     /**
116      *表中线的样式
117      *@author home
118      *@time 2021/2/27 21:53
119     */
120     private void lineStyleSetting() {
121         lineDataSet1.setLineWidth(4);//线宽度
122         lineDataSet1.setColor(Color.RED);//线颜色
123         lineDataSet1.setDrawCircles(true);//每个数值点是否画圆圈
124         lineDataSet1.setDrawCircleHole(true);//圆圈里是否画洞
125         lineDataSet1.setCircleRadius(10);//画圆圈的辐射
126         lineDataSet1.setCircleHoleRadius(5);//画洞的辐射
127         lineDataSet1.setValueTextSize(10);//数值点显示文字的大小
128         lineDataSet1.setValueTextColor(Color.BLUE);//数值点文字颜色
129         lineDataSet1.enableDashedLine(5,10,0);//虚线
130         lineDataSet1.setColors(colorArray,LearnFromYoutube.this);//设置颜色
131     }
132
133     private ArrayList<Entry> dataValues1() {
134         ArrayList<Entry> dataVals = new ArrayList<Entry>();
135         dataVals.add(new Entry(0,20));
136         dataVals.add(new Entry(1,24));
137         dataVals.add(new Entry(2,2));
138         dataVals.add(new Entry(3,10));
139         dataVals.add(new Entry(4,28));
140
141         return dataVals;
142     }
143
144     private ArrayList<Entry> dataValues2() {
145         ArrayList<Entry> dataVals = new ArrayList();
146         dataVals.add(new Entry(0,12));
147         dataVals.add(new Entry(2,16));
148         dataVals.add(new Entry(3,23));
149         dataVals.add(new Entry(5,1));
150         dataVals.add(new Entry(7,18));
151         return  dataVals;
152     }
153
154     /**
155      *将数据加上符号,感觉是为不同传感器加上符号的类
156      *@author home
157      *@time 2021/2/27 22:15
158     */
159     private class MyValueFormatter extends ValueFormatter {
160
161         @Override
162         public String getFormattedValue(float value) {
163             return value + " $";//在原有数值后面加$
164         }
165     }
166
167     /**
168      *自定义坐标轴
169      *@author home
170      *@time 2021/2/27 22:51
171     */
172     private class MyAxisValueFormatter extends ValueFormatter {
173
174         @Override
175         public String getAxisLabel(float value, AxisBase axis) {
176             axis.setLabelCount(3,true);
177             return "days" + value ;
178         }
179     }
180
181     /**
182      *官方文档文档设置方法 怎么设置呢?
183      *@author home
184      *@time 2021/2/27 23:09
185     */
186     private class OfficalAxisValueFormatter extends ValueFormatter {
187         String[]  days = new String[] {"Mo", "Tu", "Wed", "Th", "Fr", "Sa", "Su"};
188
189         @Override
190         public String getAxisLabel(float value, AxisBase axis) {
191             return days.toString() + value;
192         }
193     }
194 }
 1 <?xml version="1.0" encoding="utf-8"?>
 2 <RelativeLayout xmlns:android="http://schemas.android.com/apk/res/android"
 3     android:layout_width="match_parent"
 4     android:layout_height="match_parent">
 5
 6     <com.github.mikephil.charting.charts.LineChart
 7         android:id="@+id/line_chart"
 8         android:layout_width="match_parent"
 9         android:layout_height="match_parent"/>
10
11 </RelativeLayout>
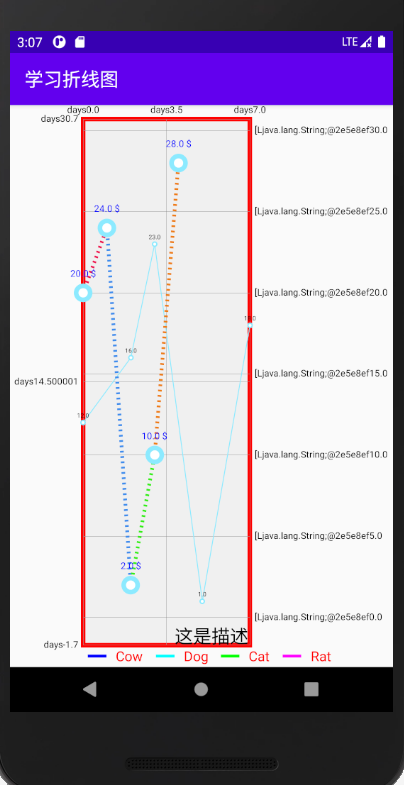 (有够难看的效果图)


 浙公网安备 33010602011771号