vue项目中Echarts中的水位图(水波图、水球图、水半球)实现的详细步骤🥏🧿✓✓✓(echarts-liquidfill插件的使用~✓)
Vue结合echarts实现水滴图🥏🧿✓✓✓(echarts-liquidfill插件的使用~✓)
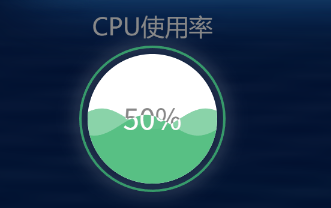
1,单水滴图表~动态展示
1,安装echarts-liquidfill
npm install echarts-liquidfill
2,代码实现~
<template>
<div id="cpu" style="width: 270px;height: 200px;"></div>
</template>
<script>
import * as echarts from 'echarts';
export default {
name: "show",
methods:{
aucDrawLine() {
// 基于准备好的dom,初始化echarts实例,所以只能在mounted中调用
// 这里'auc'是自己取的名字,跟div标签属性的id后面的值是一一对应的
let myChart = echarts.init(document.getElementById('cpu'));
// 绘制图表
myChart.setOption( {
title: {
text: 'CPU使用率', // 标题名
// 标题的样式
textStyle: {
color: '#888', // 字体颜色
fontFamily: 'Microsoft YaHei', // 字体
fontSize: 20,
fontWeight: '400',
align: 'center', // 文字的水平方式
},
left: 'center', // 定位
top: '5%'
},
series: [{
type: 'liquidFill',
radius: '60%',
waveAnimation: true,
data: [{
value: 0.5,
direction: 'left',
itemStyle: {
normal: {
color: '#7DCEA0'
}
}
},
{
value: 0.45,
direction: 'right',
itemStyle: {
normal: {
color: '#52BE80 '
}
}
},
],
outline: {
show: true,
borderDistance: 5, // 边框线与图表的距离 数字
itemStyle: {
opacity: 0.9, // 边框的透明度 默认为 1
borderWidth: 2, // 边框的宽度
shadowBlur: 14, // 边框的阴影范围 一旦设置了内外都有阴影
shadowColor: "#fff", // 边框的阴影颜色,
borderColor:'#3AA66E' // 边框颜色
}
},
itemStyle: {
opacity: 0.9, // 波浪的透明度
shadowBlur: 0 // 波浪的阴影范围
},
backgroundStyle: {
color: '#fff' // 图表的背景颜色
},
label: { // 数据展示样式
show: true,
color: '#888',
insideColor: '#fff',
fontSize: 24,
fontWeight: 400,
},
}]
})
},
},
mounted() {
this.aucDrawLine();
},
}
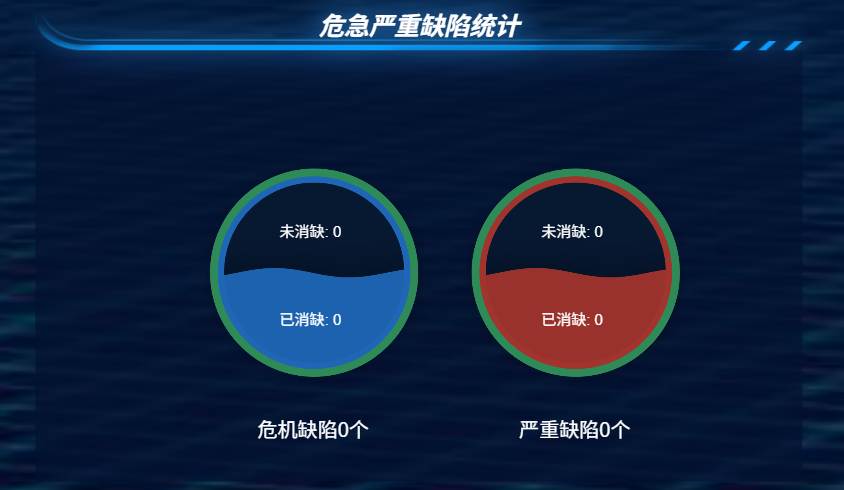
</script>2,水滴图表~动态展示
<template>
  <div class="containerline">
    <div class="waterball-chart left">
      <div ref="leftChart" :style="{ width: size + 'px', height: size + 'px' }"></div>
      <!-- 分别添加上下 未消缺 和 已消缺 的数量 -->
      <div class="con-text">
        <div class="num">
          未消缺:
          <span>{{ dataInfo1.wxqDefect || 0 }}</span>
        </div>
        <div class="num">
          已消缺:
          <span>{{ dataInfo1.yxqDefect || 0 }}</span>
        </div>
      </div>
      <div class="label">危机缺陷0个</div>
    </div>
    <div class="waterball-chart right">
      <div ref="rightChart" :style="{ width: size + 'px', height: size + 'px' }"></div>
      <!-- 分别添加上下 未消缺 和 已消缺 的数量 -->
      <div class="con-text">
        <div class="num">
          未消缺:
          <span>{{ dataInfo2.wxqDefect || 0 }}</span>
        </div>
        <div class="num">
          已消缺:
          <span>{{ dataInfo2.yxqDefect || 0 }}</span>
        </div>
      </div>
      <div class="label">严重缺陷0个</div>
    </div>
  </div>
</template>

<script>
import * as echarts from 'echarts';
import {
  getDefectCountCritical,
  getDefectCountSerious,
} from "@/api/VisualSystem/quJuZongLan";

export default {
  props: {
    size: {
      type: Number,
      default: 280
    },
    leftPercentage: {
      type: Number,
      required: true,
      default: 50
    },
    rightPercentage: {
      type: Number,
      required: true,
      default: 50
    }
  },
  data() {
    return {
      leftChart: null,
      rightChart: null,
      dataInfo1: {},
      dataInfo2: {},
      dataObj: {}
    };
  },
  mounted() {
    this.initCharts();
    this.getData();
    this.$bus.$on("cityChange", (val) => {
      this.dataObj.city = val;
      this.getData();
    });
  },
  watch: {
    leftPercentage(newVal) {
      this.updateChart(this.leftChart, newVal, '#1f66b6'); // 蓝色
    },
    rightPercentage(newVal) {
      this.updateChart(this.rightChart, newVal, '#a1342c'); // 红色
    }
  },
  methods: {
    getData() {
      getDefectCountCritical(this.dataObj).then((res) => {
        this.dataInfo1 = res.resultValue[0];
      });
      getDefectCountSerious(this.dataObj).then((res) => {
        this.dataInfo2 = res.resultValue[0];
      });
    },
    initCharts() {
      this.leftChart = echarts.init(this.$refs.leftChart);
      this.rightChart = echarts.init(this.$refs.rightChart);
      this.updateChart(this.leftChart, this.leftPercentage, '#1f66b6'); // 蓝色
      this.updateChart(this.rightChart, this.rightPercentage, '#a1342c'); // 红色
    },
    updateChart(chart, percentage, color) {
      const option = {
        series: [
          {
            // 设置图表类型为liquidFill
            type: 'liquidFill',
            // 设置数据,这里是百分比
            data: [percentage / 100],
            // 设置半径
            radius: '90%',
            // 设置轮廓
            outline: {
              show: true, // 显示轮廓
              borderDistance: 0, // 边框与图表的距离
              itemStyle: {
                borderWidth: 14, // 边框粗细
                borderColor: '#2E8B57', // 边框颜色
              }
            },
            // 设置背景样式
            backgroundStyle: {
              color: '#071831',
              borderWidth: 8, // 增加边框粗细
              borderColor: color
            },
            // 设置颜色
            color: [color],
            // 设置标签
            label: {
              // formatter: (percentage * 1).toFixed(0) + '%', // 标签格式 % 显示
              formatter: '',
              fontSize: 24,

              color: color,
              insideColor: '#fff'
            },
            // 设置振幅
            amplitude: 6,
            // 设置波浪动画
            waveAnimation: true,
            // 设置动画持续时间
            animationDuration: 2000,
            // 设置动画缓动效果
            animationEasing: 'linear'
          }
        ]
      };
      chart.setOption(option);
    }
  },
  beforeDestroy() {
    if (this.leftChart) {
      this.leftChart.dispose();
    }
    if (this.rightChart) {
      this.rightChart.dispose();
    }
    this.$bus.$off("cityChange");
  }
};
</script>

<style lang="scss" scoped>
.containerline {
  display: flex;
  justify-content: center; // 修改为居中对齐
  align-items: center;
  padding-top: 9rem;
}

.waterball-chart {
  display: inline-block;
  position: relative;
  width: 214px;
  height: 214px;

  &.left {
    margin-right: 60px; // 减少右侧外边距
  }

  &.right {
    margin-left: 60px; // 减少左侧外边距
  }

  .label {
    text-align: center;
    // margin-top: 1.625rem;
    padding-left: 4rem;
    padding-top: 3rem;
    font-size: 1.6rem;
    color: #fff; // 根据需要调整颜色
  }

  // ----添加上下缺陷数量
  .con-text {
    position: absolute;
    line-height: 7rem;
    top: 2rem;
    left: 6rem;
    color: #fff;
    font-size: 1.2rem;
  }
}
</style>
3, 完整的Echarts中的水位图(水波图、水球图、水半球)实现的详细步骤
1. 安装ECharts和Liquid Fill插件:
npm install echarts echarts-liquidfill
2.在创建的vue中引入ECharts和Liquid Fill插件:
import echarts from 'echarts';
import 'echarts-liquidfill';3.在组件中初始化ECharts和Liquid Fill插件:
<script>
import * as echarts from 'echarts';
import 'echarts-liquidfill'; // 引入液体填充插件

export default {
  name: 'WaterBallChart',
  mounted() {
    this.initChart();
  },
  methods: {
    initChart() {
      const myChart = echarts.init(this.$refs.chart);

      // 配置项
      const option = {
        series: [{
          type: 'liquidFill',//设置图表类型
          data: [0.6], // 设置水位,值为0到1之间
          radius: '80%', // 设置图的大小
          outline: {
            borderDistance: 4, // 外边框距离
            itemStyle: {
              borderWidth: 2, // 外边框宽度
              borderColor: '#156ACF' // 外边框颜色
            }
          },
          backgroundStyle: {
            color: '#E3F7FF' // 背景色
          },
          label: {
            normal: {
              textStyle: {
                color: '#156ACF',//标签文本颜色
                insideColor: '#fff',
                fontSize: 40
              }
            }
          }
        }]
      };

      // 使用配置项设置图表
      myChart.setOption(option);
    }
  }
};
</script>
完整的代码 :一些比较细节常用的配置属性
const option = {
        series: [
          {
            type: "liquidFill", //设置图表类型
            // data: [0.6], // 设置水位,值为0到1之间
            data:[0.5,0.2], //设置水位,可以写多个值,用来设置多个水位
            // data: [
            //   0.2,
            //   {
            //     value: 0.3, // 图形数据写法二
            //     direction: "left", // 水波运动方向
            //     itemStyle: {
            //       color: "blue", // 水波颜色
            //       opacity: 0.8, // 透明度
            //     },
            //     emphasis: {
            //       itemStyle: {
            //         color: "lightblue", // 鼠标移入时的水波颜色
            //         opacity: 1, // 鼠标移入时的透明度
            //       },
            //     },
            //   },
            // ],
            waveAnimation:true,//是否开启水波动画,
            amplitude: 20, // 设置振幅,值越大波形越尖
            waveLength:200,//水波的长度,值越大水波越长
            shape: "circle", //设置形状,可选为'circle', 'rect', 'roundRect', 'triangle', 'diamond', 'pin', 'arrow'
            direction: "right", //设置方向,可选为'left', 'right', 'top', 'bottom',
            radius: "80%", // 设置图的大小  默认为50%
            color:['#8f7cc6','#fff','red'] ,// 设置颜色,可以设置多个值,用来设置多个水位
            center:['30%','50%'],//中心点的位置
            animationEasing:'linear',
            outline: {
              borderDistance: 4, // 外边框距离
              itemStyle: {
                borderWidth: 2, // 外边框宽度
                borderColor: "#156ACF", // 外边框颜色
              },
            },
            //  // 水波样式
            //  itemStyle:{
            //     opacity:0.5,                      // 透明度
            //     color:'red',                      // 统一配置水波的颜色
            //     shadowBlur:10,                    // 水波阴影大小
            //     shadowColor:'red',                // 阴影颜色
            //     shadowOffsetX:10,                 // 阴影水平偏移量
            //     shadowOffsetY:10,                 // 阴影竖直偏移量
            // },
            backgroundStyle: {
              color: "pink", // 背景色
            },
            label: {
              normal: {
                textStyle: {
                  color: "#156ACF",
                  insideColor: "#fff",
                  fontSize: 40,
                },
              },
            },
          },
        ],
      };

 浙公网安备 33010602011771号