
prometheus使用2
参考不错的
Prometheus监控实战之node_exporter详解:
https://blog.csdn.net/ygq13572549874/article/details/129115350
一般操作
查看之前安装的
[root@mcw03 ~]# cd /usr/local/prometheus/
[root@mcw03 prometheus]# ls
console_libraries  consoles  LICENSE  NOTICE  prometheus  prometheus.yml  promtool
[root@mcw03 prometheus]# less prometheus.yml
[root@mcw03 prometheus]#
查看配置
[root@mcw03 prometheus]# cat prometheus.yml
# my global config
global:
  scrape_interval:     15s # Set the scrape interval to every 15 seconds. Default is every 1 minute.
  evaluation_interval: 15s # Evaluate rules every 15 seconds. The default is every 1 minute.
  # scrape_timeout is set to the global default (10s).

# Alertmanager configuration
alerting:
  alertmanagers:
  - static_configs:
    - targets:
      # - alertmanager:9093

# Load rules once and periodically evaluate them according to the global 'evaluation_interval'.
rule_files:
  # - "first_rules.yml"
  # - "second_rules.yml"

# A scrape configuration containing exactly one endpoint to scrape:
# Here it's Prometheus itself.
scrape_configs:
  # The job name is added as a label `job=<job_name>` to any timeseries scraped from this config.
  - job_name: 'prometheus'

    # metrics_path defaults to '/metrics'
    # scheme defaults to 'http'.

    static_configs:
    - targets: ['localhost:9090']
  - job_name: 'agent1'
    static_configs:
    - targets: ['10.0.0.14:9100']
  - job_name: 'promserver'
    static_configs:
    - targets: ['10.0.0.13:9100']
  - job_name: 'server_mariadb'
    static_configs:
    - targets: ['10.0.0.13:9104']
[root@mcw03 prometheus]#
启动:
[root@mcw03 prometheus]#
[root@mcw03 prometheus]#  /usr/local/prometheus/prometheus --config.file="/usr/local/prometheus/prometheus.yml" &
[1] 82834
[root@mcw03 prometheus]# level=info ts=2024-01-29T15:38:28.958560959Z caller=main.go:244 msg="Starting Prometheus" version="(version=2.5.0, branch=HEAD, revision=67dc912ac8b24f94a1fc478f352d25179c94ab9b)"
level=info ts=2024-01-29T15:38:28.958619046Z caller=main.go:245 build_context="(go=go1.11.1, user=root@578ab108d0b9, date=20181106-11:40:44)"
level=info ts=2024-01-29T15:38:28.95863261Z caller=main.go:246 host_details="(Linux 3.10.0-693.el7.x86_64 #1 SMP Tue Aug 22 21:09:27 UTC 2017 x86_64 mcw03 (none))"
level=info ts=2024-01-29T15:38:28.958644576Z caller=main.go:247 fd_limits="(soft=65535, hard=65535)"
level=info ts=2024-01-29T15:38:28.958654061Z caller=main.go:248 vm_limits="(soft=unlimited, hard=unlimited)"
level=info ts=2024-01-29T15:38:28.959638098Z caller=main.go:562 msg="Starting TSDB ..."
level=info ts=2024-01-29T15:38:28.96581693Z caller=main.go:572 msg="TSDB started"
level=info ts=2024-01-29T15:38:28.966063978Z caller=main.go:632 msg="Loading configuration file" filename=/usr/local/prometheus/prometheus.yml
level=info ts=2024-01-29T15:38:28.968164139Z caller=main.go:658 msg="Completed loading of configuration file" filename=/usr/local/prometheus/prometheus.yml
level=info ts=2024-01-29T15:38:28.968197199Z caller=main.go:531 msg="Server is ready to receive web requests."
level=info ts=2024-01-29T15:38:28.969282856Z caller=web.go:399 component=web msg="Start listening for connections" address=0.0.0.0:9090
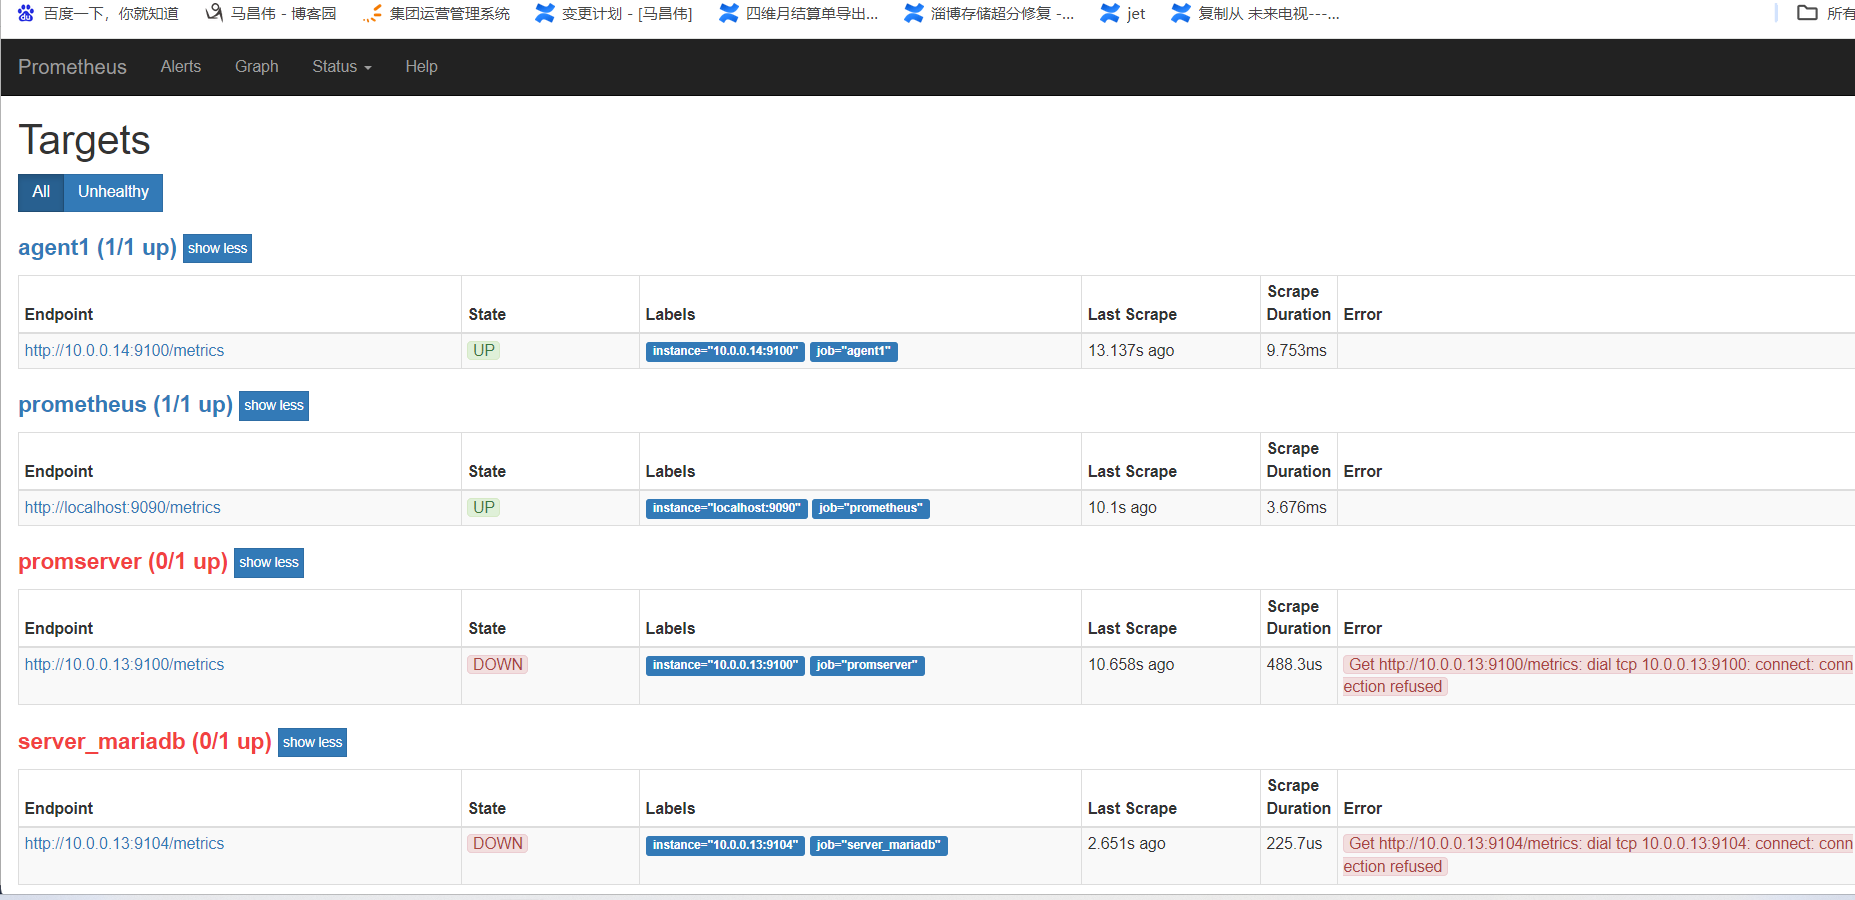
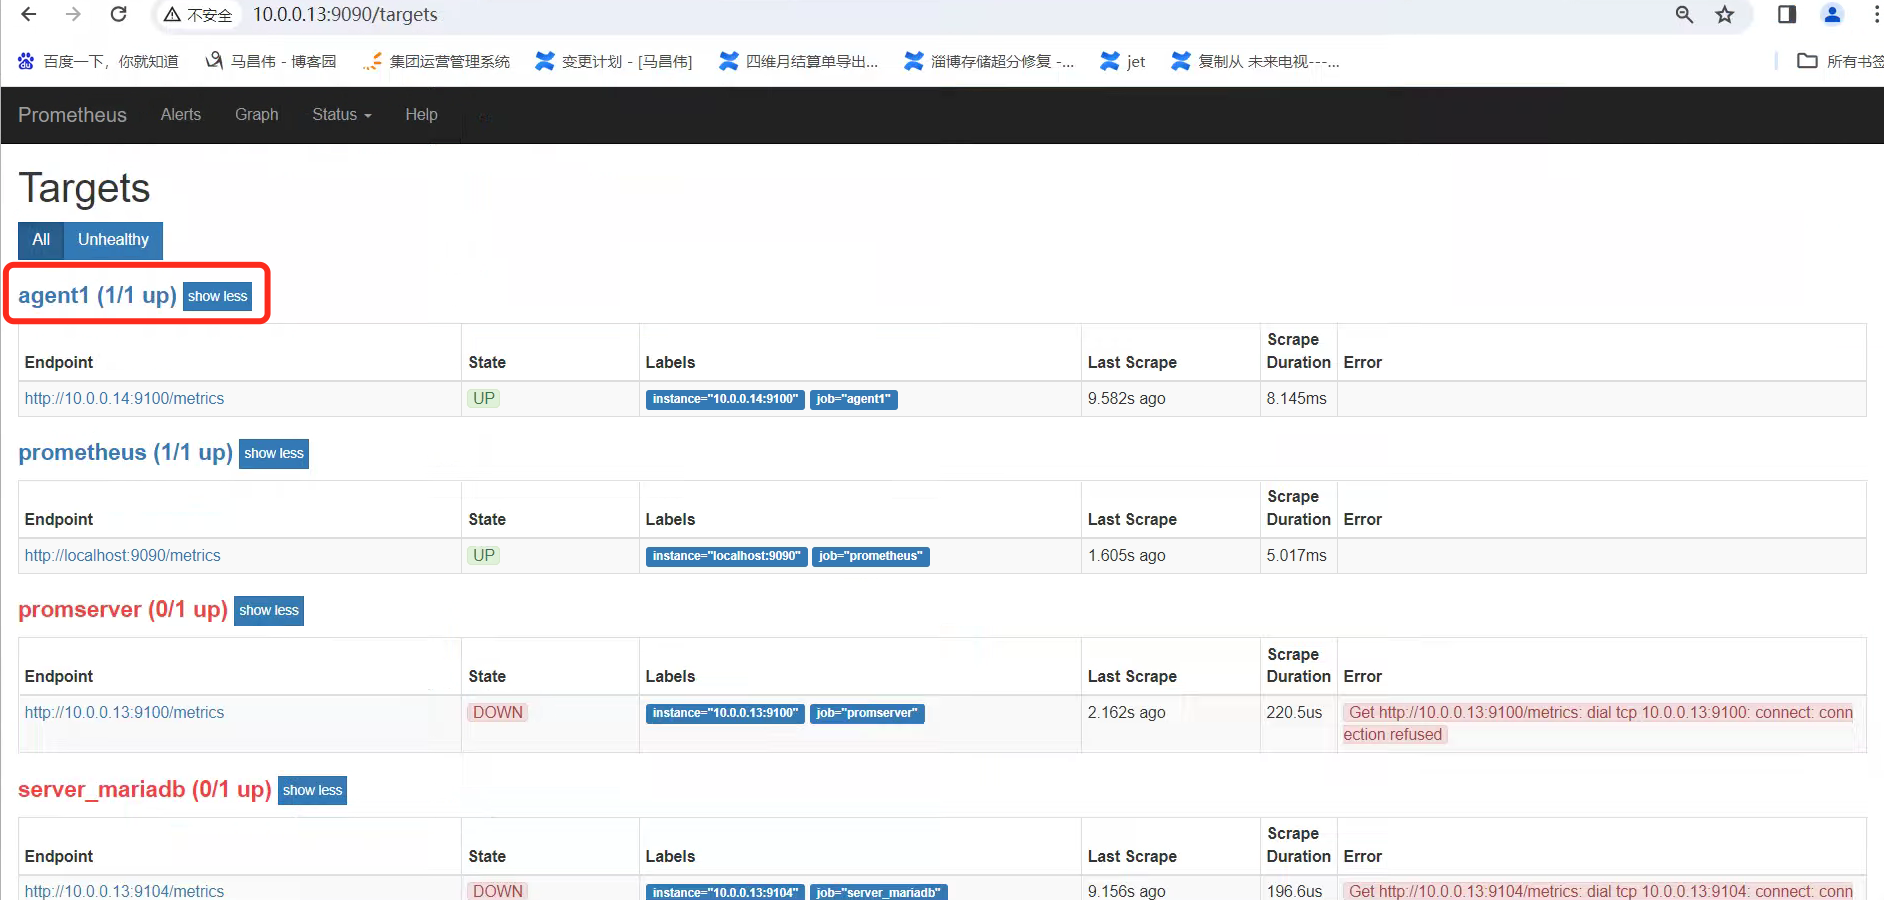
访问地址:http://10.0.0.13:9090/,启动的时候可以看到,默认跳到http://10.0.0.13:9090/graph了
验证配置文件
[root@mcw03 prometheus]# ls
console_libraries  consoles  data  LICENSE  NOTICE  prometheus  prometheus.yml  promtool
[root@mcw03 prometheus]# ./promtool check config prometheus.yml
Checking prometheus.yml
  SUCCESS: 0 rule files found

[root@mcw03 prometheus]#
将配置前面多加个o,检查配置失败
[root@mcw03 prometheus]# tail -3 prometheus.yml
  - job_name: 'server_mariadb'
    static_configs:
    o- targets: ['10.0.0.13:9104']
[root@mcw03 prometheus]# ./promtool check config prometheus.yml
Checking prometheus.yml
  FAILED: parsing YAML file prometheus.yml: yaml: unmarshal errors:
  line 38: field o- targets not found in type config.plain

[root@mcw03 prometheus]#
修改配置重载
修改配置把14的注释掉,检查配置,重载配置,报错
[root@mcw03 prometheus]# vim prometheus.yml
[root@mcw03 prometheus]# cat prometheus.yml
# my global config
global:
  scrape_interval:     15s # Set the scrape interval to every 15 seconds. Default is every 1 minute.
  evaluation_interval: 15s # Evaluate rules every 15 seconds. The default is every 1 minute.
  # scrape_timeout is set to the global default (10s).

# Alertmanager configuration
alerting:
  alertmanagers:
  - static_configs:
    - targets:
      # - alertmanager:9093

# Load rules once and periodically evaluate them according to the global 'evaluation_interval'.
rule_files:
  # - "first_rules.yml"
  # - "second_rules.yml"

# A scrape configuration containing exactly one endpoint to scrape:
# Here it's Prometheus itself.
scrape_configs:
  # The job name is added as a label `job=<job_name>` to any timeseries scraped from this config.
  - job_name: 'prometheus'

    # metrics_path defaults to '/metrics'
    # scheme defaults to 'http'.

    static_configs:
    - targets: ['localhost:9090']
  #- job_name: 'agent1'
  #  static_configs:
  #  - targets: ['10.0.0.14:9100']
  - job_name: 'promserver'
    static_configs:
    - targets: ['10.0.0.13:9100']
  - job_name: 'server_mariadb'
    static_configs:
    - targets: ['10.0.0.13:9104']
[root@mcw03 prometheus]# ./promtool check config prometheus.yml
Checking prometheus.yml
  SUCCESS: 0 rule files found

[root@mcw03 prometheus]# curl -X POST http://localhost:9090/-/reload
Lifecycle APIs are not enabled[root@mcw03 prometheus]#
热加载
prometheus启动后修改配置文件就需要再重启生效
可以通过以下方式 热加载
curl -X POST http://localhost:9090/-/reload
请求接口后返回 Lifecycle API is not enabled. 那么就是启动的时候没有开启热更新配置,需要在启动的命令行增加参数: --web.enable-lifecycle
./prometheus --web.enable-lifecycle --config.file=prometheus.yml
如果已经把promtheus配置到了Linux系统服务系统里面,需要到systemd的system文件夹下修改promtheus对应的.service文件。
大概步骤如下:
然后执行命令
systemctl daemon-reload
systemctl restart prometheus
1
2
后面每次修改了prometheus配置文件后,可以调用接口进行配置的热加载:
curl -X POST http://ip:9090/-/reload
1
参考文章:
prometheus热加载配置文件
https://blog.csdn.net/qq_21133131/article/details/117568214
Prometheus监控学习笔记之Prometheus如何热加载更新配置
https://www.cnblogs.com/momoyan/p/12039895.html
原文链接:https://blog.csdn.net/qq_39595769/article/details/119240941
@@@
先杀掉,
[root@mcw03 prometheus]# ps -ef|grep prome
root      82834   2094  0 Jan29 pts/0    00:00:01 /usr/local/prometheus/prometheus --config.file=/usr/local/prometheus/prometheus.yml
root      84432   2094  0 00:17 pts/0    00:00:00 grep --color=auto prome
[root@mcw03 prometheus]# kill 82834
[root@mcw03 prometheus]# level=warn ts=2024-01-29T16:17:55.448944181Z caller=main.go:406 msg="Received SIGTERM, exiting gracefully..."
level=info ts=2024-01-29T16:17:55.448992753Z caller=main.go:431 msg="Stopping scrape discovery manager..."
level=info ts=2024-01-29T16:17:55.448999882Z caller=main.go:445 msg="Stopping notify discovery manager..."
level=info ts=2024-01-29T16:17:55.449004831Z caller=main.go:467 msg="Stopping scrape manager..."
level=info ts=2024-01-29T16:17:55.449023164Z caller=main.go:427 msg="Scrape discovery manager stopped"
level=info ts=2024-01-29T16:17:55.449031517Z caller=main.go:441 msg="Notify discovery manager stopped"
level=info ts=2024-01-29T16:17:55.449051788Z caller=manager.go:657 component="rule manager" msg="Stopping rule manager..."
level=info ts=2024-01-29T16:17:55.449060796Z caller=manager.go:663 component="rule manager" msg="Rule manager stopped"
level=info ts=2024-01-29T16:17:55.449622055Z caller=main.go:461 msg="Scrape manager stopped"
level=info ts=2024-01-29T16:17:55.449728933Z caller=notifier.go:512 component=notifier msg="Stopping notification manager..."
level=info ts=2024-01-29T16:17:55.44974018Z caller=main.go:616 msg="Notifier manager stopped"
level=info ts=2024-01-29T16:17:55.449872966Z caller=main.go:628 msg="See you next time!"
加上上面的参数启动,这样支持热加载了
[root@mcw03 prometheus]# /usr/local/prometheus/prometheus --web.enable-lifecycle --config.file="/usr/local/prometheus/prometheus.yml" &
[1] 84520
[root@mcw03 prometheus]# level=info ts=2024-01-29T16:19:57.779420663Z caller=main.go:244 msg="Starting Prometheus" version="(version=2.5.0, branch=HEAD, revision=67dc912ac8b24f94a1fc478f352d25179c94ab9b)"
level=info ts=2024-01-29T16:19:57.779482093Z caller=main.go:245 build_context="(go=go1.11.1, user=root@578ab108d0b9, date=20181106-11:40:44)"
level=info ts=2024-01-29T16:19:57.779505718Z caller=main.go:246 host_details="(Linux 3.10.0-693.el7.x86_64 #1 SMP Tue Aug 22 21:09:27 UTC 2017 x86_64 mcw03 (none))"
level=info ts=2024-01-29T16:19:57.779518271Z caller=main.go:247 fd_limits="(soft=65535, hard=65535)"
level=info ts=2024-01-29T16:19:57.77952732Z caller=main.go:248 vm_limits="(soft=unlimited, hard=unlimited)"
level=info ts=2024-01-29T16:19:57.780838853Z caller=main.go:562 msg="Starting TSDB ..."
level=info ts=2024-01-29T16:19:57.813389846Z caller=web.go:399 component=web msg="Start listening for connections" address=0.0.0.0:9090
level=info ts=2024-01-29T16:19:57.828718461Z caller=main.go:572 msg="TSDB started"
level=info ts=2024-01-29T16:19:57.828777376Z caller=main.go:632 msg="Loading configuration file" filename=/usr/local/prometheus/prometheus.yml
level=info ts=2024-01-29T16:19:57.829456749Z caller=main.go:658 msg="Completed loading of configuration file" filename=/usr/local/prometheus/prometheus.yml
level=info ts=2024-01-29T16:19:57.829470351Z caller=main.go:531 msg="Server is ready to receive web requests."
此时没有14的,
将14的配置注释去掉
[root@mcw03 prometheus]# vim prometheus.yml
[root@mcw03 prometheus]# cat prometheus.yml
# my global config
global:
  scrape_interval:     15s # Set the scrape interval to every 15 seconds. Default is every 1 minute.
  evaluation_interval: 15s # Evaluate rules every 15 seconds. The default is every 1 minute.
  # scrape_timeout is set to the global default (10s).

# Alertmanager configuration
alerting:
  alertmanagers:
  - static_configs:
    - targets:
      # - alertmanager:9093

# Load rules once and periodically evaluate them according to the global 'evaluation_interval'.
rule_files:
  # - "first_rules.yml"
  # - "second_rules.yml"

# A scrape configuration containing exactly one endpoint to scrape:
# Here it's Prometheus itself.
scrape_configs:
  # The job name is added as a label `job=<job_name>` to any timeseries scraped from this config.
  - job_name: 'prometheus'

    # metrics_path defaults to '/metrics'
    # scheme defaults to 'http'.

    static_configs:
    - targets: ['localhost:9090']
  - job_name: 'agent1'
    static_configs:
    - targets: ['10.0.0.14:9100']
  - job_name: 'promserver'
    static_configs:
    - targets: ['10.0.0.13:9100']
  - job_name: 'server_mariadb'
    static_configs:
    - targets: ['10.0.0.13:9104']
[root@mcw03 prometheus]#
执行重载
[root@mcw03 prometheus]# curl -X POST http://localhost:9090/-/reload
level=info ts=2024-01-29T16:22:22.264583475Z caller=main.go:632 msg="Loading configuration file" filename=/usr/local/prometheus/prometheus.yml
level=info ts=2024-01-29T16:22:22.264875915Z caller=main.go:658 msg="Completed loading of configuration file" filename=/usr/local/prometheus/prometheus.yml
[root@mcw03 prometheus]#
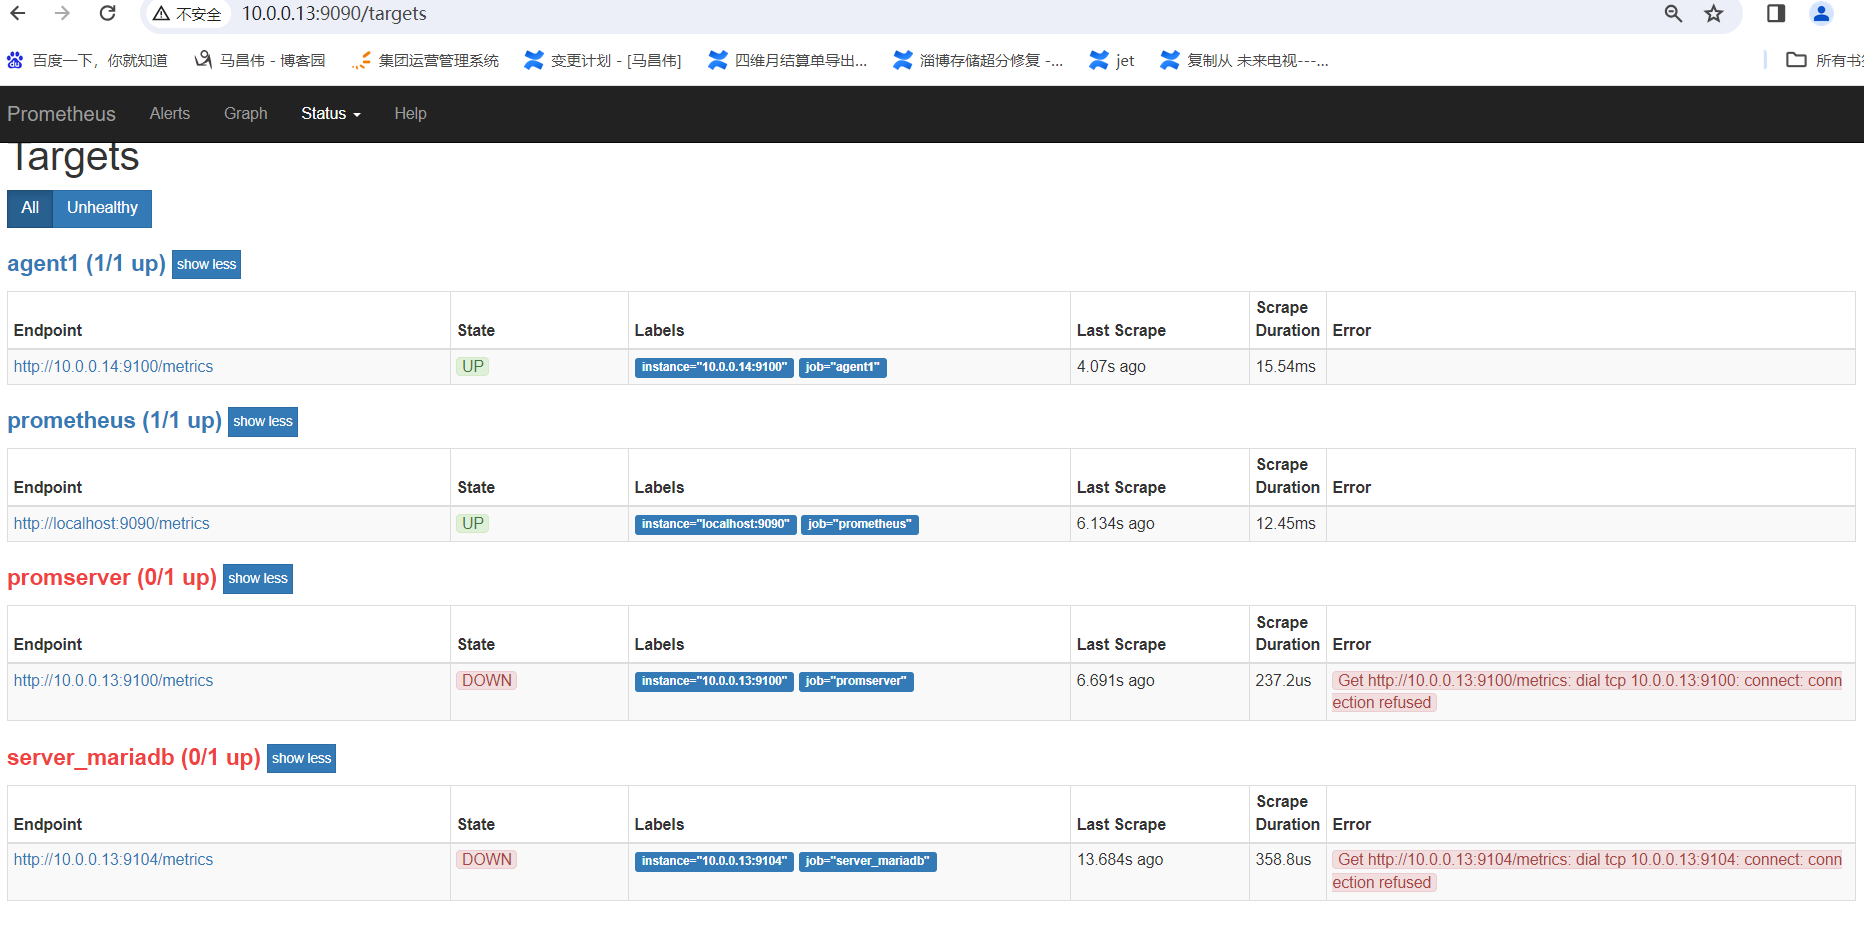
刷新页面可以看到14已经有了
设置systemctl管理
# cat /usr/lib/systemd/system/prometheus.service[Unit]Description=Prometheus Node ExporterAfter=network.target[Service]ExecStart=/usr/local/prometheus/prometheus --config.file=/etc/prometheus.yml --web.read-timeout=5m --web.max-connections=10 --storage.tsdb.retention=15d --storage.tsdb.path=/prometheus/data --query.max-concurrency=20 --query.timeout=2mUser=root[Install]WantedBy=multi-user.target |
启动参数解释
|
1
2
3
4
5
6
7
8
9
10
11
12
13
|
–config.file=/etc/prometheus.yml 指定配置文件 –web.read-timeout=5m 请求链接的最大等待时间,防止太多的空闲链接占用资源 –web.max-connections=512 针对prometheus,获取数据源的时候,建立的网络链接数,做一个最大数字的限制,防止链接数过多造成资源过大的消耗 –storage.tsdb.retention=15d 重要参数,prometheus 开始采集监控数据后,会存在内存和硬盘中;对于保存期限的设置。时间过长,硬盘和内存都吃不消;时间太短,要查历史数据就没了。企业15天最为合适。 –storage.tsdb.path="/prometheus/data" 存储数据路径,不要随便定义 –query.max-concurrency=20 用户查询最大并发数 –query.timeout=2m 慢查询强制终止 |
注意:配置文件不能加双引号,否则启动报错找不到文件或目录
本次启动用户是root生产中最好新建一个用户用于启动,需要设置配置文件及数据文件权限
数据目录在生产中最好单独配置数据硬盘,使用LVM硬盘格式配置
启动
|
1
2
3
4
|
#启动systemctl start prometheus#设置开机自启动systemctl enable prometheus |
查看是否启动
|
1
2
|
lsof -i:9090ps -ef|grep prometheus |
@@@
创建文件,并创建对应的目录
[root@mcw03 prometheus]# cat /usr/lib/systemd/system/prometheus.service
cat: /usr/lib/systemd/system/prometheus.service: No such file or directory
[root@mcw03 prometheus]# systemctl status prometheus
Unit prometheus.service could not be found.
[root@mcw03 prometheus]# vim /usr/lib/systemd/system/prometheus.service
[root@mcw03 prometheus]# pwd
/usr/local/prometheus
[root@mcw03 prometheus]# vim /usr/lib/systemd/system/prometheus.service
[root@mcw03 prometheus]#
[root@mcw03 prometheus]#
[root@mcw03 prometheus]# ls
console_libraries  consoles  data  LICENSE  NOTICE  prometheus  prometheus.yml  promtool
[root@mcw03 prometheus]#
[root@mcw03 prometheus]# ls /data/
gv0  gv1  gv2  gv3
[root@mcw03 prometheus]# ls /
bin  boot  data  dev  etc  home  hs_err_pid18517.log  lib  lib64  media  mnt  opt  proc  root  run  sbin  srv  sys  tmp  user  usr  var
[root@mcw03 prometheus]# mkdir /prometheus/data
mkdir: cannot create directory ‘/prometheus/data’: No such file or directory
[root@mcw03 prometheus]# mkdir /prometheus/data -p
[root@mcw03 prometheus]# ls
console_libraries  consoles  data  LICENSE  NOTICE  prometheus  prometheus.yml  promtool
[root@mcw03 prometheus]# cp prometheus.yml  /etc/
[root@mcw03 prometheus]# cat /usr/lib/systemd/system/prometheus.service
[Unit]
Description=Prometheus Node Exporter
After=network.target

[Service]
ExecStart=/usr/local/prometheus/prometheus --config.file=/etc/prometheus.yml --web.read-timeout=5m  --web.max-connections=10 --storage.tsdb.retention=15d --storage.tsdb.path=/prometheus/data --query.max-concurrency=20 --query.timeout=2m
User=root
[Install]
WantedBy=multi-user.target
[root@mcw03 prometheus]# ls data/
lock  wal
[root@mcw03 prometheus]# ls data/wal/
00000000
[root@mcw03 prometheus]# ls console
ls: cannot access console: No such file or directory
[root@mcw03 prometheus]# ls consoles/
index.html.example  node-cpu.html  node-disk.html  node.html  node-overview.html  prometheus.html  prometheus-overview.html
[root@mcw03 prometheus]# ls console_libraries/
menu.lib  prom.lib
[root@mcw03 prometheus]#
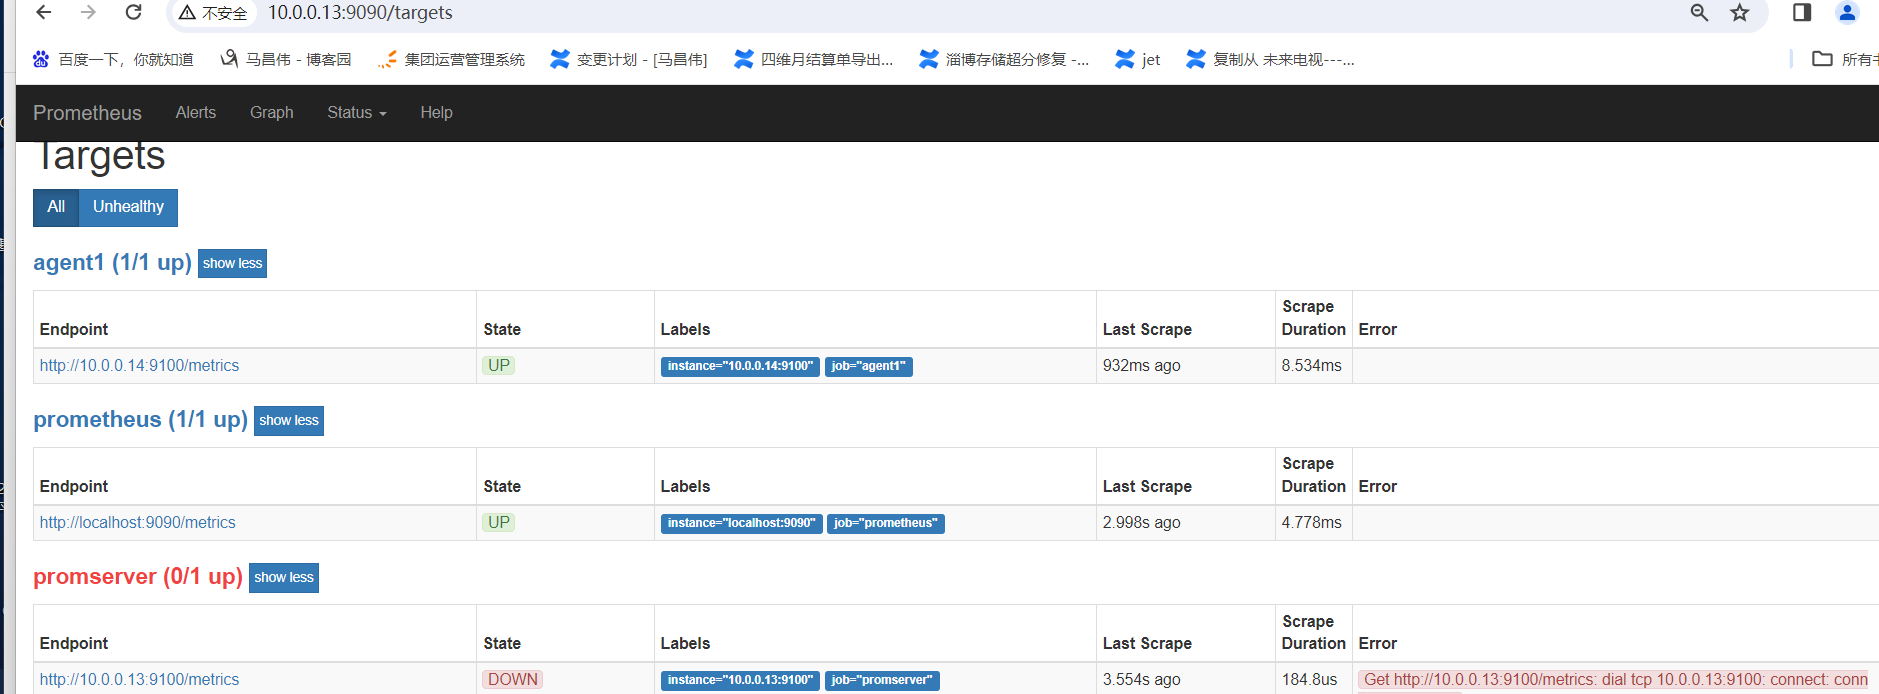
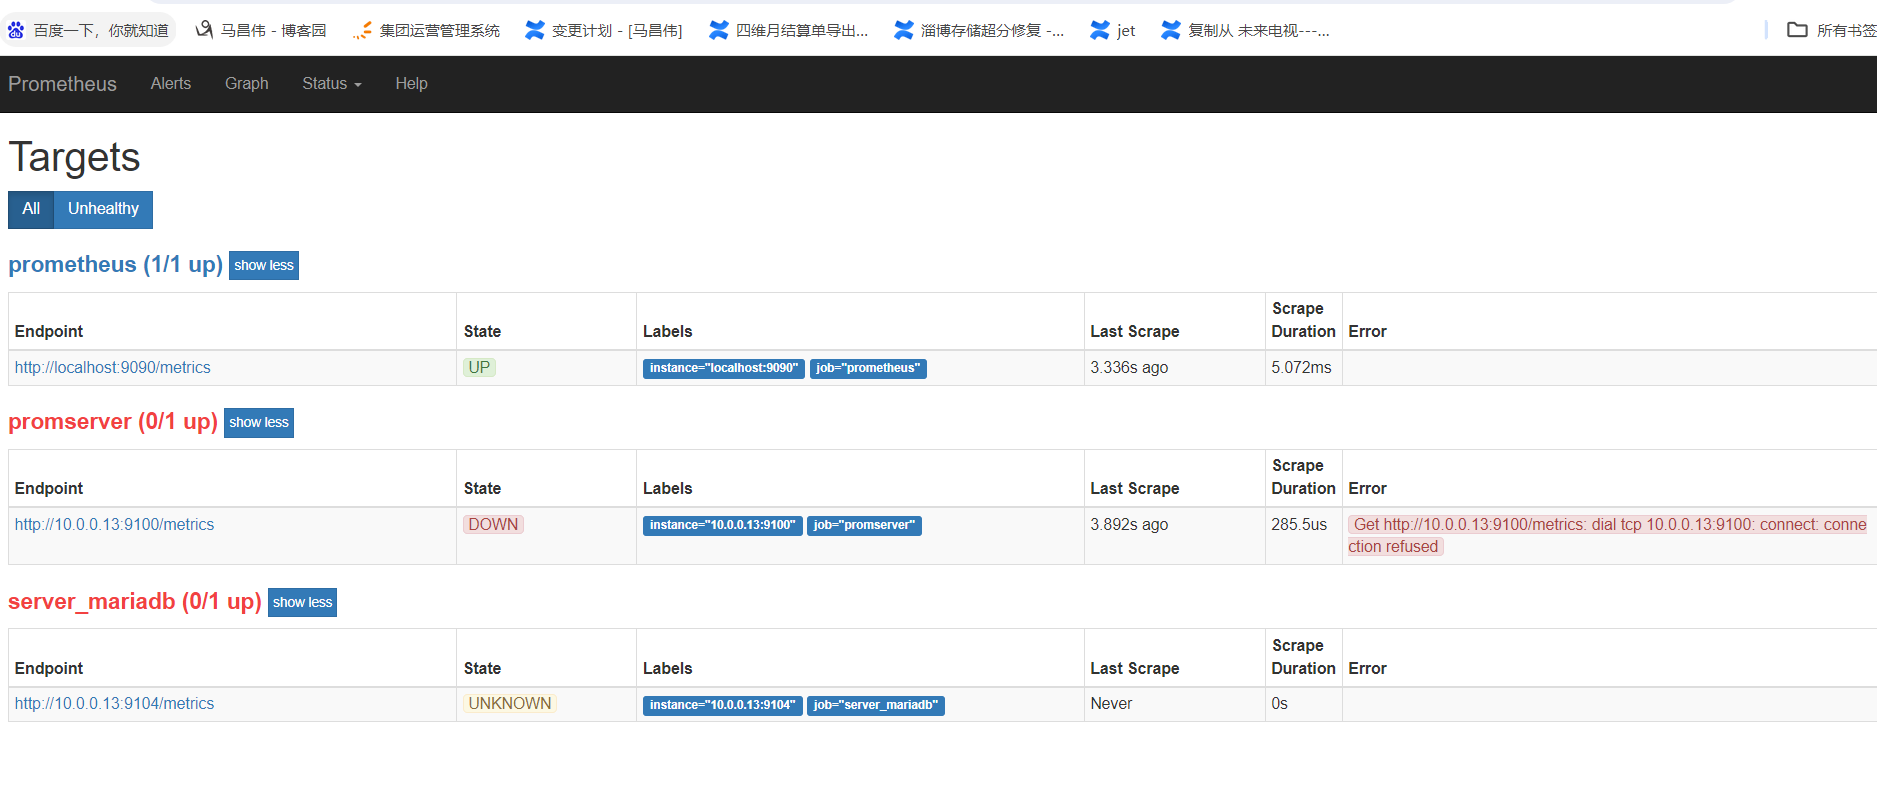
此时页面是这样的
停止并用systemctl启动
[root@mcw03 prometheus]# ps -ef|grep prom
root      84520   2094  0 00:19 pts/0    00:00:00 /usr/local/prometheus/prometheus --web.enable-lifecycle --config.file=/usr/local/prometheus/prometheus.yml
root      85064   2094  0 00:32 pts/0    00:00:00 grep --color=auto prom
[root@mcw03 prometheus]# kill 84520
[root@mcw03 prometheus]# level=warn ts=2024-01-29T16:32:10.65552338Z caller=main.go:406 msg="Received SIGTERM, exiting gracefully..."
level=info ts=2024-01-29T16:32:10.655566913Z caller=main.go:431 msg="Stopping scrape discovery manager..."
level=info ts=2024-01-29T16:32:10.655574899Z caller=main.go:445 msg="Stopping notify discovery manager..."
level=info ts=2024-01-29T16:32:10.65557968Z caller=main.go:467 msg="Stopping scrape manager..."
level=info ts=2024-01-29T16:32:10.655598695Z caller=main.go:427 msg="Scrape discovery manager stopped"
level=info ts=2024-01-29T16:32:10.655606567Z caller=main.go:441 msg="Notify discovery manager stopped"
level=info ts=2024-01-29T16:32:10.655627041Z caller=manager.go:657 component="rule manager" msg="Stopping rule manager..."
level=info ts=2024-01-29T16:32:10.655635473Z caller=manager.go:663 component="rule manager" msg="Rule manager stopped"
level=info ts=2024-01-29T16:32:10.65608701Z caller=main.go:461 msg="Scrape manager stopped"
level=info ts=2024-01-29T16:32:10.656138338Z caller=notifier.go:512 component=notifier msg="Stopping notification manager..."
level=info ts=2024-01-29T16:32:10.65615002Z caller=main.go:616 msg="Notifier manager stopped"
level=info ts=2024-01-29T16:32:10.656259633Z caller=main.go:628 msg="See you next time!"

[1]+  Done                    /usr/local/prometheus/prometheus --web.enable-lifecycle --config.file="/usr/local/prometheus/prometheus.yml"
[root@mcw03 prometheus]# systemctl status prometheus
● prometheus.service - Prometheus Node Exporter
   Loaded: loaded (/usr/lib/systemd/system/prometheus.service; disabled; vendor preset: disabled)
   Active: inactive (dead)
[root@mcw03 prometheus]# systemctl start prometheus
[root@mcw03 prometheus]# systemctl status prometheus
● prometheus.service - Prometheus Node Exporter
   Loaded: loaded (/usr/lib/systemd/system/prometheus.service; disabled; vendor preset: disabled)
   Active: active (running) since Tue 2024-01-30 00:32:29 CST; 7s ago
 Main PID: 85086 (prometheus)
   CGroup: /system.slice/prometheus.service
           └─85086 /usr/local/prometheus/prometheus --config.file=/etc/prometheus.yml --web.read-timeout=5m --web.max-connections=10 --storage.tsdb.retention=15d --storage.tsdb.path=...

Jan 30 00:32:29 mcw03 prometheus[85086]: level=info ts=2024-01-29T16:32:29.116661038Z caller=main.go:245 build_context="(go=go1.11.1, user=root@578ab108d0b9, date=20181106-11:40:44)"
Jan 30 00:32:29 mcw03 prometheus[85086]: level=info ts=2024-01-29T16:32:29.116676722Z caller=main.go:246 host_details="(Linux 3.10.0-693.el7.x86_64 #1 SMP Tue Aug 22 21:0...w03 (none))"
Jan 30 00:32:29 mcw03 prometheus[85086]: level=info ts=2024-01-29T16:32:29.116690993Z caller=main.go:247 fd_limits="(soft=1024, hard=4096)"
Jan 30 00:32:29 mcw03 prometheus[85086]: level=info ts=2024-01-29T16:32:29.116701722Z caller=main.go:248 vm_limits="(soft=unlimited, hard=unlimited)"
Jan 30 00:32:29 mcw03 prometheus[85086]: level=info ts=2024-01-29T16:32:29.118003926Z caller=main.go:562 msg="Starting TSDB ..."
Jan 30 00:32:29 mcw03 prometheus[85086]: level=info ts=2024-01-29T16:32:29.122879549Z caller=main.go:572 msg="TSDB started"
Jan 30 00:32:29 mcw03 prometheus[85086]: level=info ts=2024-01-29T16:32:29.122934471Z caller=main.go:632 msg="Loading configuration file" filename=/etc/prometheus.yml
Jan 30 00:32:29 mcw03 prometheus[85086]: level=info ts=2024-01-29T16:32:29.123963083Z caller=main.go:658 msg="Completed loading of configuration file" filename=/etc/prometheus.yml
Jan 30 00:32:29 mcw03 prometheus[85086]: level=info ts=2024-01-29T16:32:29.123980522Z caller=main.go:531 msg="Server is ready to receive web requests."
Jan 30 00:32:29 mcw03 prometheus[85086]: level=info ts=2024-01-29T16:32:29.124447919Z caller=web.go:399 component=web msg="Start listening for connections" address=0.0.0.0:9090
Hint: Some lines were ellipsized, use -l to show in full.
[root@mcw03 prometheus]# ps -ef|grep prome
root      85086      1  0 00:32 ?        00:00:00 /usr/local/prometheus/prometheus --config.file=/etc/prometheus.yml --web.read-timeout=5m --web.max-connections=10 --storage.tsdb.retention=15d --storage.tsdb.path=/prometheus/data --query.max-concurrency=20 --query.timeout=2m
root      85105   2094  0 00:32 pts/0    00:00:00 grep --color=auto prome
[root@mcw03 prometheus]#
刷新页面,没有啥变化
将14的配置注释掉,发现还是不能用重载了
[root@mcw03 prometheus]# vim /etc/prometheus.yml
[root@mcw03 prometheus]# curl -X POST http://localhost:9090/-/reload
Lifecycle APIs are not enabled[root@mcw03 prometheus]#
加上这个参数 --web.enable-lifecycle,然后重新启动
[root@mcw03 prometheus]# vim /usr/lib/systemd/system/prometheus.service
[root@mcw03 prometheus]# cat /usr/lib/systemd/system/prometheus.service
[Unit]
Description=Prometheus Node Exporter
After=network.target

[Service]
ExecStart=/usr/local/prometheus/prometheus --config.file=/etc/prometheus.yml  --web.enable-lifecycle --web.read-timeout=5m  --web.max-connections=10 --storage.tsdb.retention=15d --storage.tsdb.path=/prometheus/data --query.max-concurrency=20 --query.timeout=2m
User=root
[Install]
WantedBy=multi-user.target
[root@mcw03 prometheus]# systemctl start prometheus
Warning: prometheus.service changed on disk. Run 'systemctl daemon-reload' to reload units.
[root@mcw03 prometheus]# systemctl daemon-reload
[root@mcw03 prometheus]# systemctl start prometheus
[root@mcw03 prometheus]#
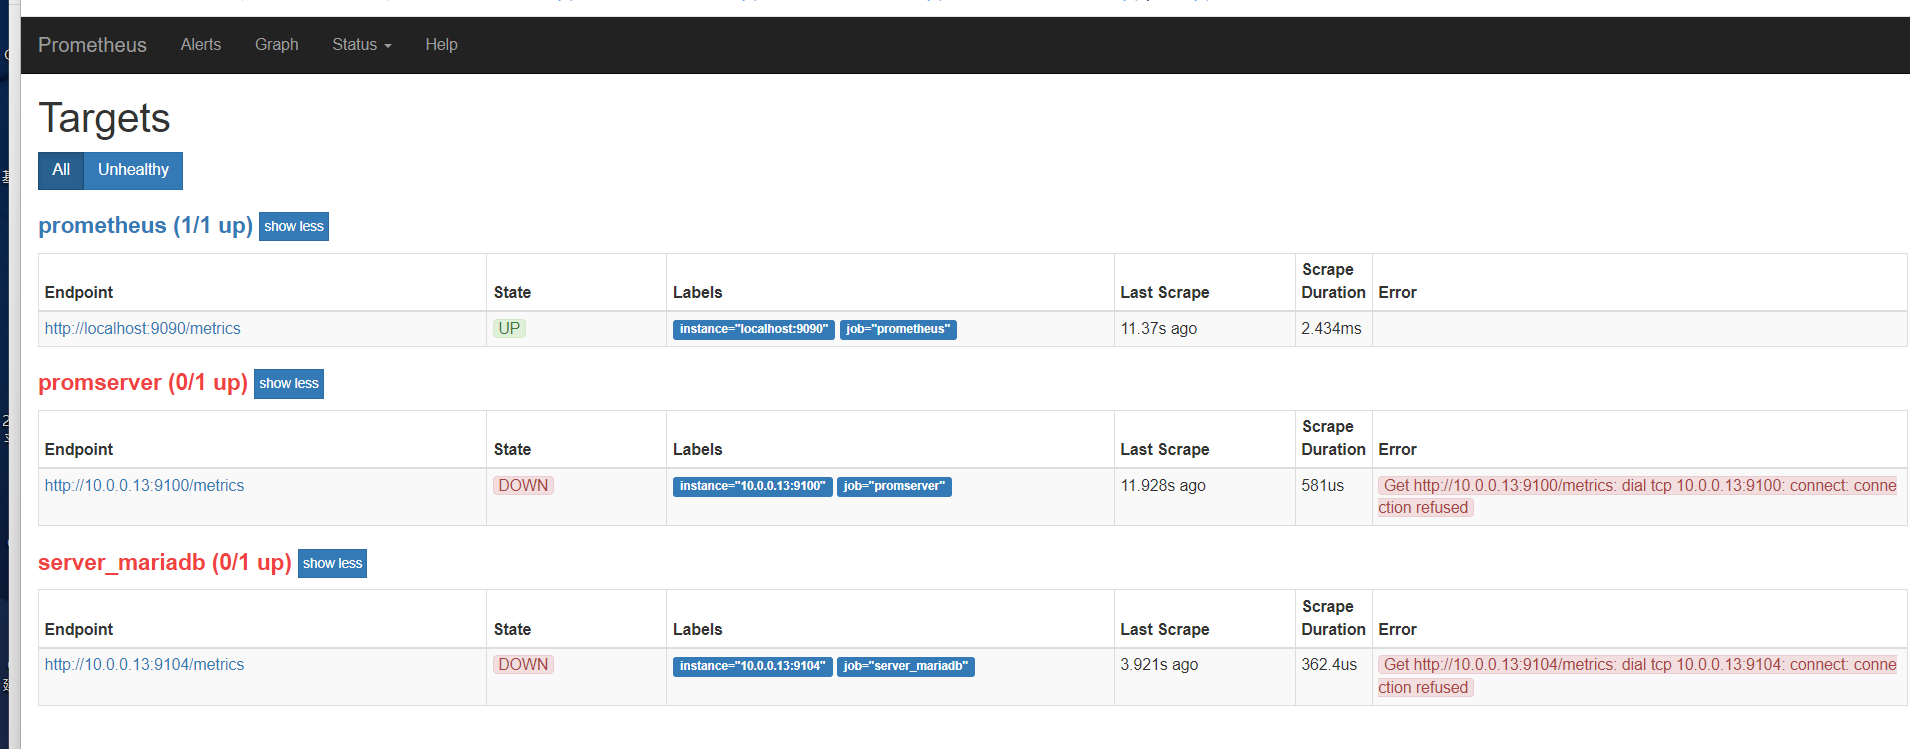
此时14down
取消注释掉的14机器,然后修改配置重载,正常重载
[root@mcw03 prometheus]# vim /etc/prometheus.yml
[root@mcw03 prometheus]# grep agent1 -A 4 /etc/prometheus.yml
  - job_name: 'agent1'
    static_configs:
    - targets: ['10.0.0.14:9100']
  - job_name: 'promserver'
    static_configs:
[root@mcw03 prometheus]# curl -X POST http://localhost:9090/-/reload
[root@mcw03 prometheus]#
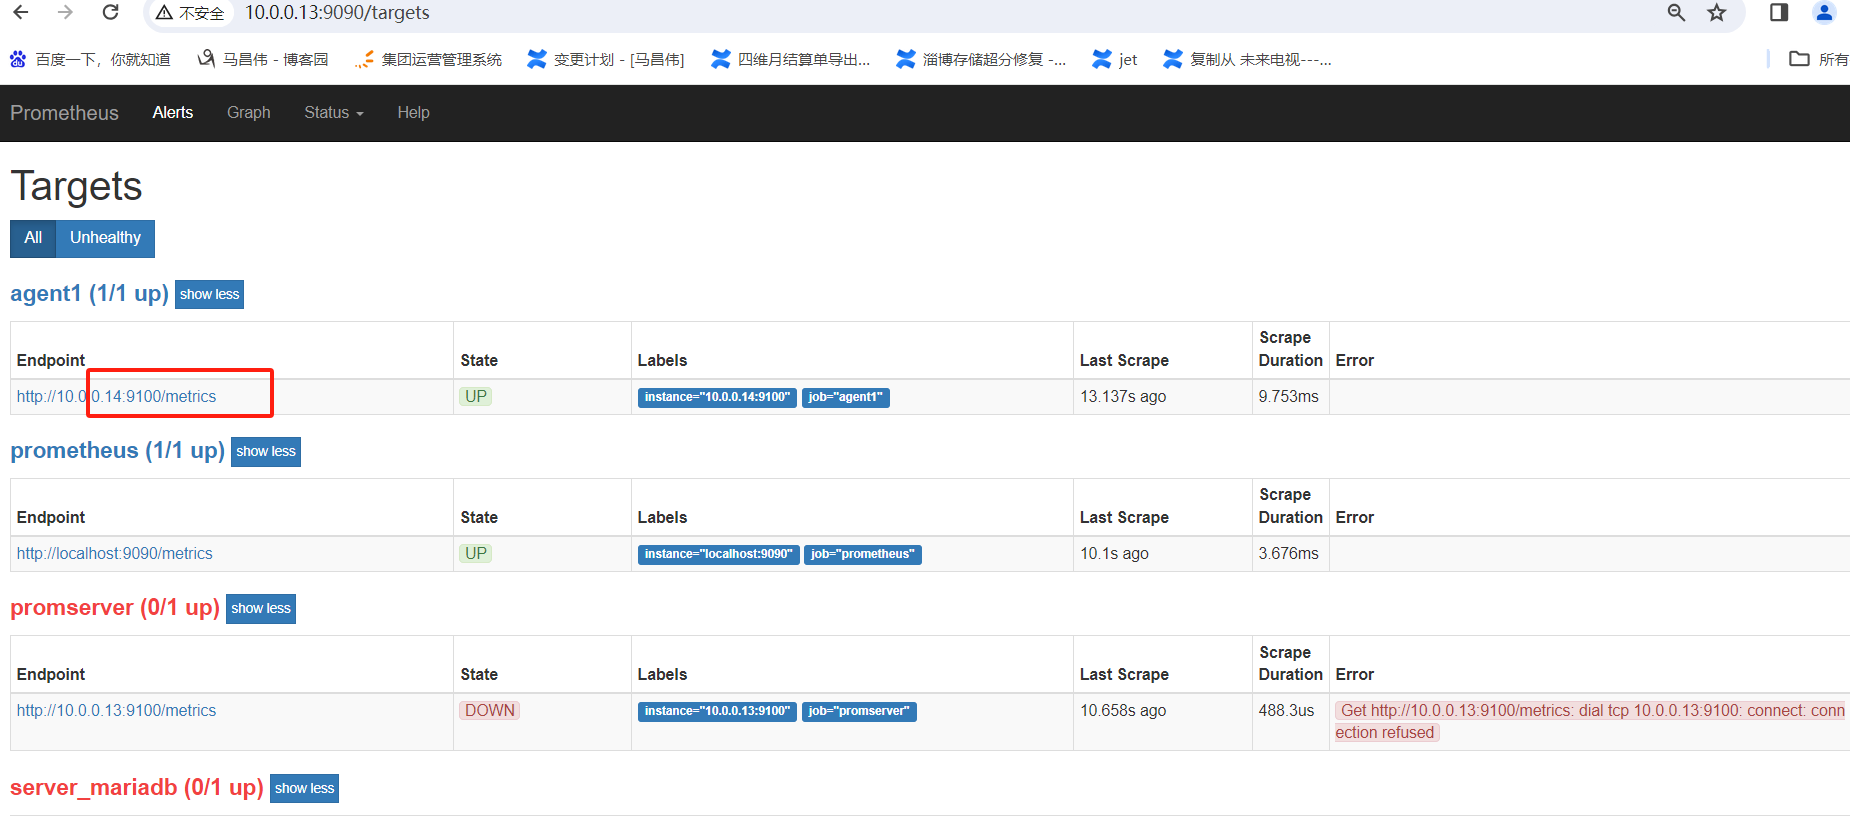
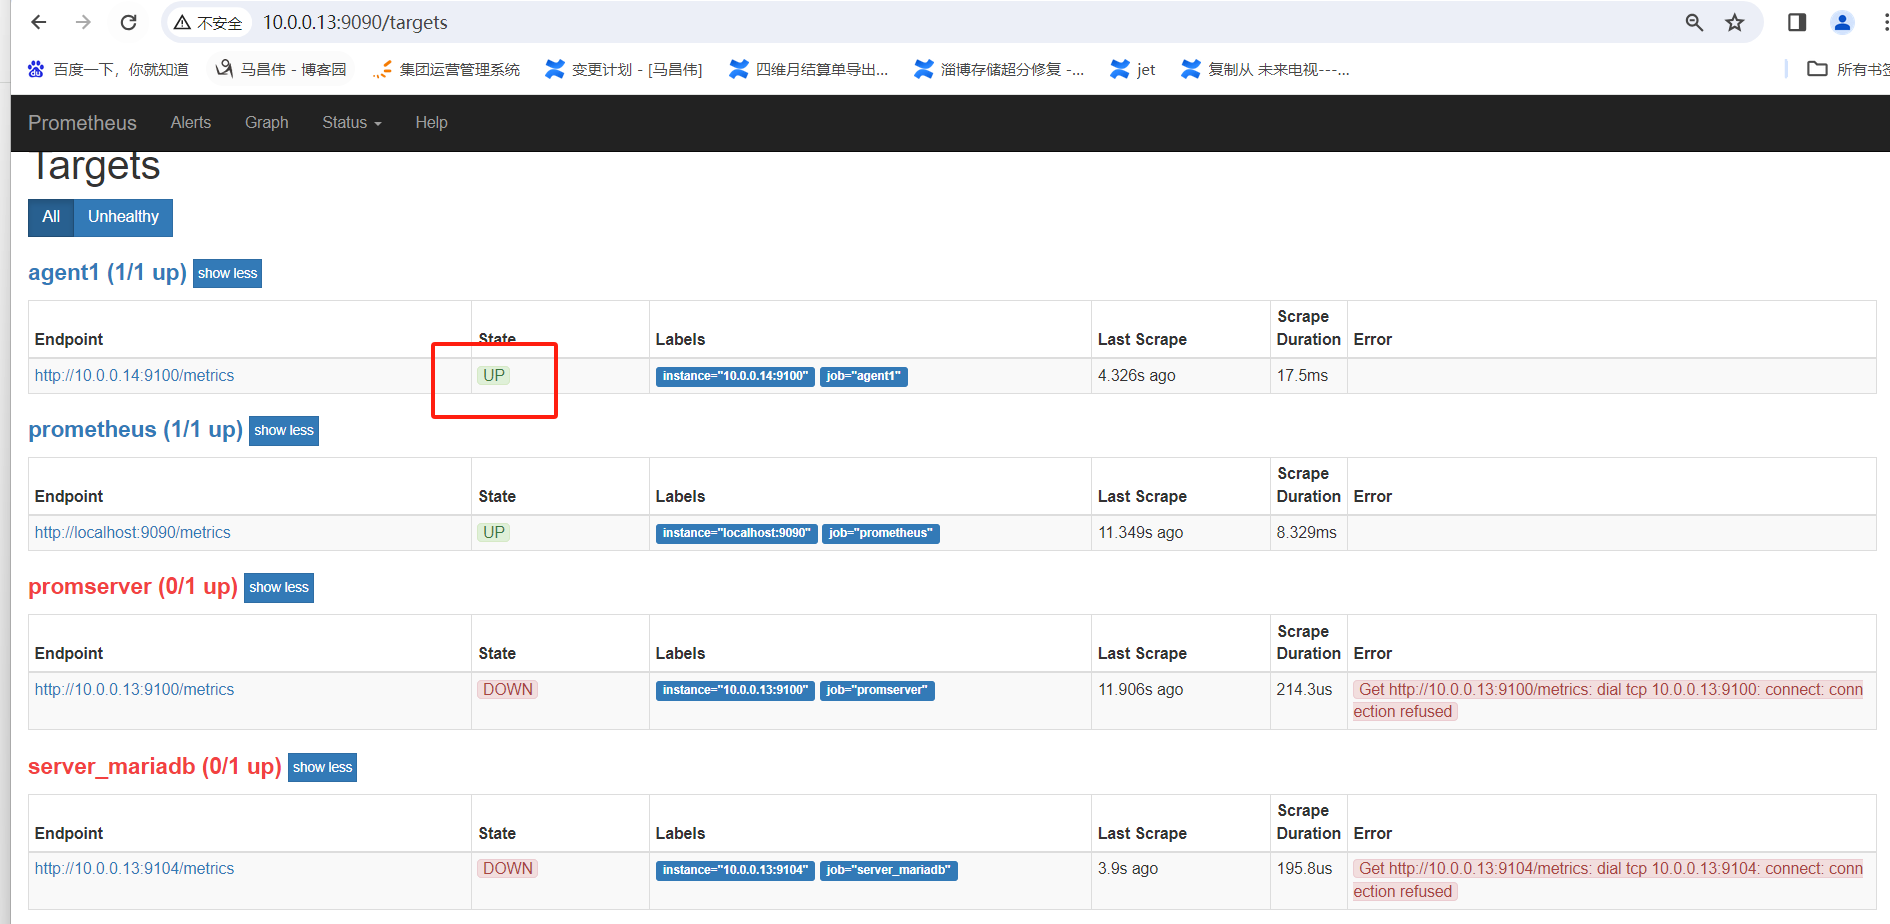
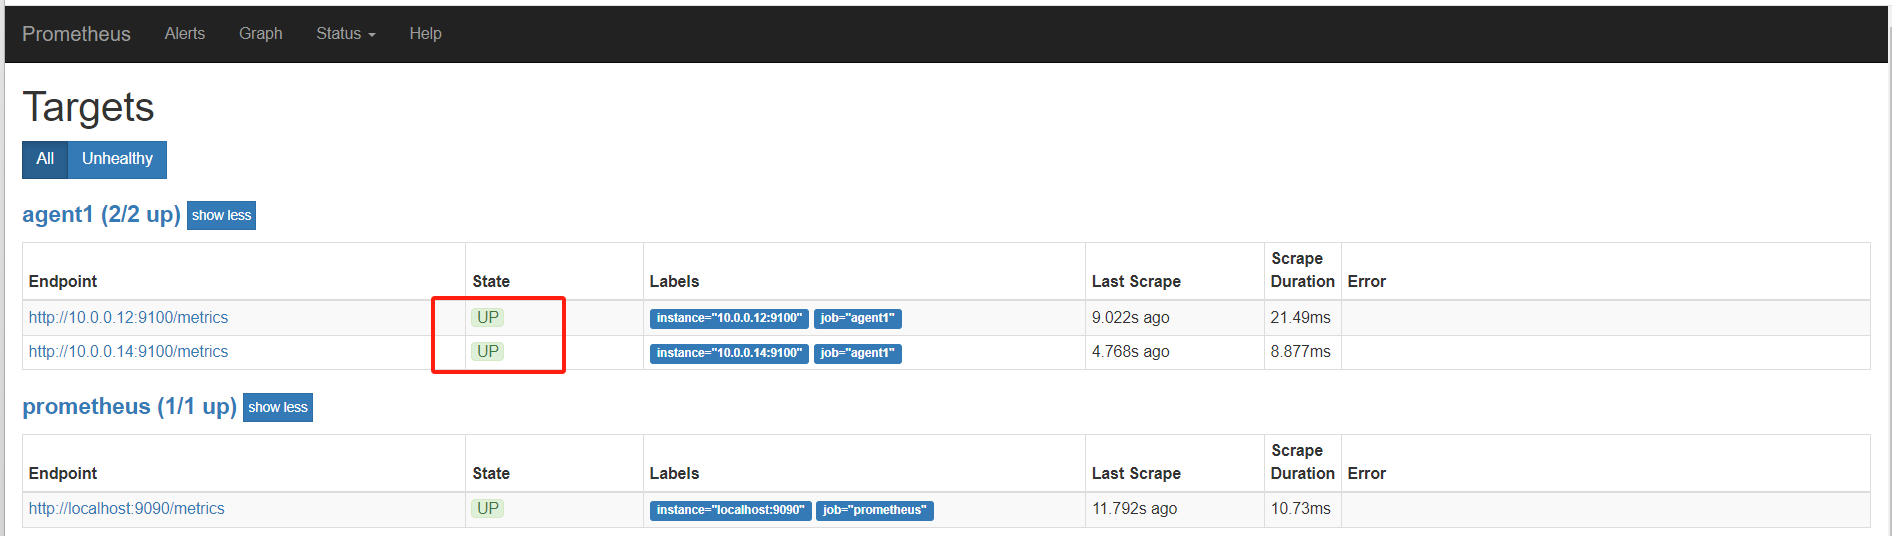
刷新一下,14up了
添加第二个node,放在同一组下面
先将客户端程序从mcw02复制到mcw02
[root@mcw04 ~]# scp -rp /usr/local/node_exporter/ 10.0.0.12:/usr/local
The authenticity of host '10.0.0.12 (10.0.0.12)' can't be established.
ECDSA key fingerprint is SHA256:mc9PiiU0mo/DDfwqVPG5s2VIrSDe1B+9iZM7rSeC/Zg.
ECDSA key fingerprint is MD5:86:5b:8b:ee:46:2b:47:a5:fb:cf:f9:68:e3:ee:b0:2a.
Are you sure you want to continue connecting (yes/no)? yes
Warning: Permanently added '10.0.0.12' (ECDSA) to the list of known hosts.
root@10.0.0.12's password:
LICENSE                                                                                                                                                100%   11KB 966.1KB/s   00:00
node_exporter                                                                                                                                          100%   16MB  43.6MB/s   00:00
NOTICE                                                                                                                                                 100%  463   248.9KB/s   00:00
[root@mcw04 ~]#
mcw02上启动起来
[root@mcw02 ~]# nohup /usr/local/node_exporter/node_exporter &
[1] 25347
[root@mcw02 ~]# nohup: ignoring input and appending output to ‘nohup.out’

[root@mcw02 ~]# ps -ef|grep node_export
root      25347   1746  0 10:50 pts/0    00:00:00 /usr/local/node_exporter/node_exporter
root      25354   1746  0 10:50 pts/0    00:00:00 grep --color=auto node_export
[root@mcw02 ~]# ss -lntup|grep 25347
tcp    LISTEN     0      16384    :::9100                 :::*                   users:(("node_exporter",pid=25347,fd=3))
[root@mcw02 ~]#
添加这个节点的监控之前
添加到agent1监控组下,然后重载配置
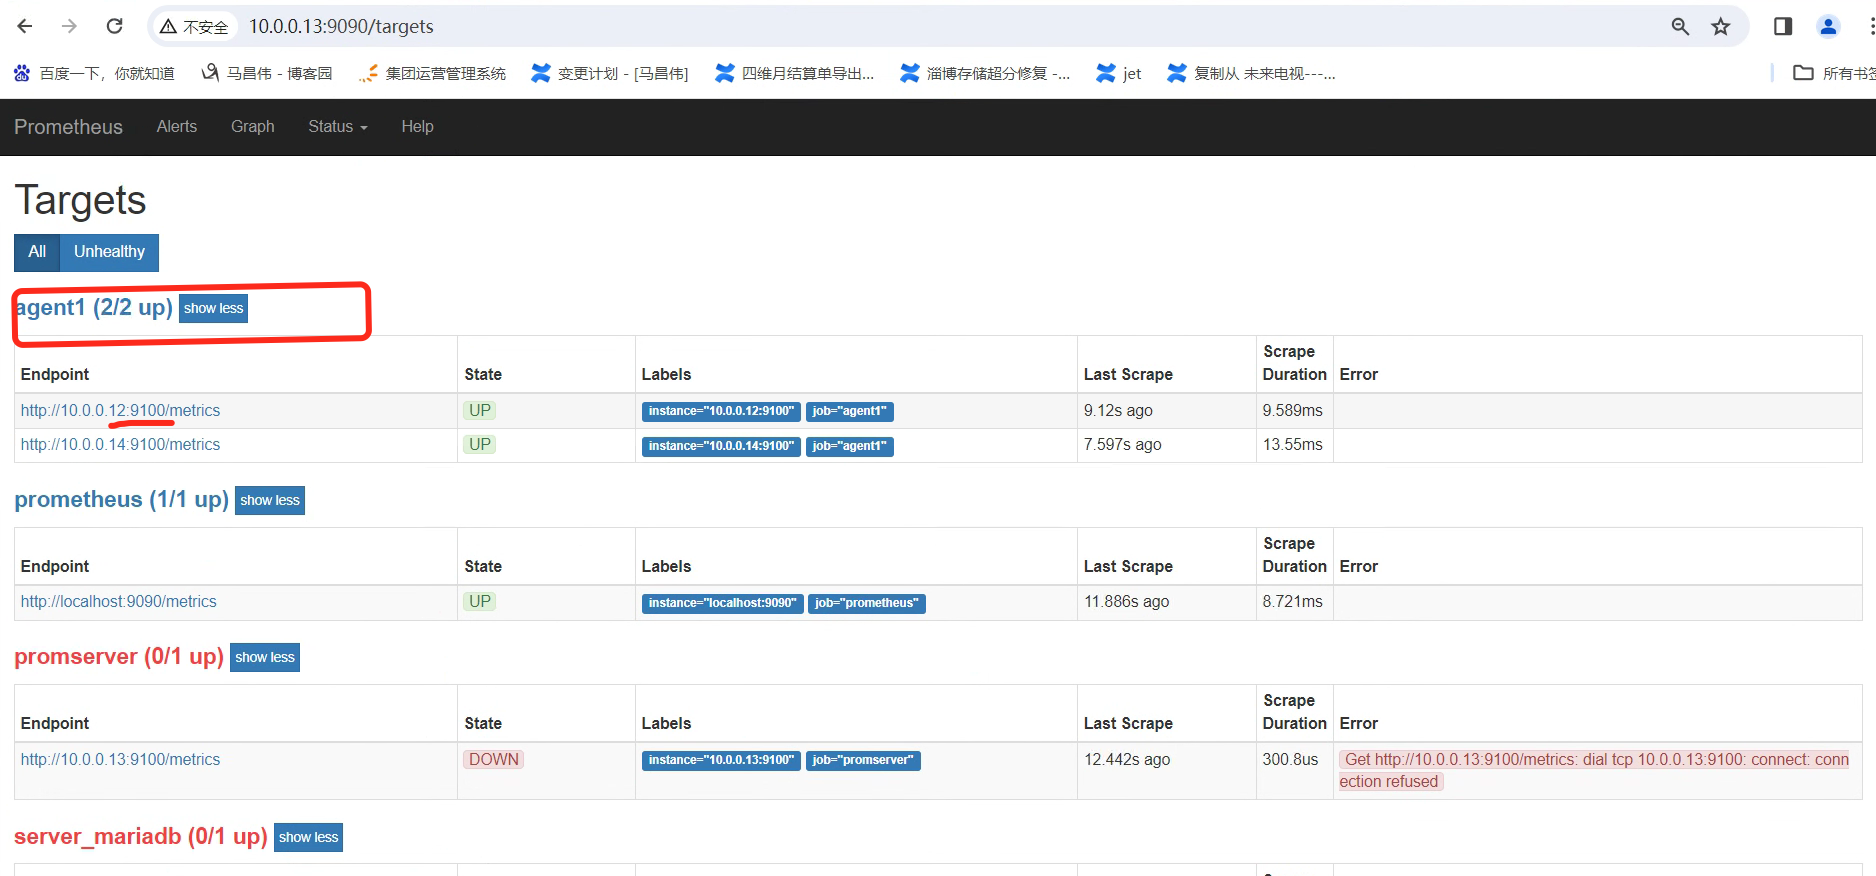
[root@mcw03 prometheus]# vim /etc/prometheus.yml
[root@mcw03 prometheus]# cat /etc/prometheus.yml
# my global config
global:
  scrape_interval:     15s # Set the scrape interval to every 15 seconds. Default is every 1 minute.
  evaluation_interval: 15s # Evaluate rules every 15 seconds. The default is every 1 minute.
  # scrape_timeout is set to the global default (10s).

# Alertmanager configuration
alerting:
  alertmanagers:
  - static_configs:
    - targets:
      # - alertmanager:9093

# Load rules once and periodically evaluate them according to the global 'evaluation_interval'.
rule_files:
  # - "first_rules.yml"
  # - "second_rules.yml"

# A scrape configuration containing exactly one endpoint to scrape:
# Here it's Prometheus itself.
scrape_configs:
  # The job name is added as a label `job=<job_name>` to any timeseries scraped from this config.
  - job_name: 'prometheus'

    # metrics_path defaults to '/metrics'
    # scheme defaults to 'http'.

    static_configs:
    - targets: ['localhost:9090']
  - job_name: 'agent1'
    static_configs:
    - targets: ['10.0.0.14:9100']
    - targets: ['10.0.0.12:9100']
  - job_name: 'promserver'
    static_configs:
    - targets: ['10.0.0.13:9100']
  - job_name: 'server_mariadb'
    static_configs:
    - targets: ['10.0.0.13:9104']
[root@mcw03 prometheus]# curl -X POST http://localhost:9090/-/reload
[root@mcw03 prometheus]#
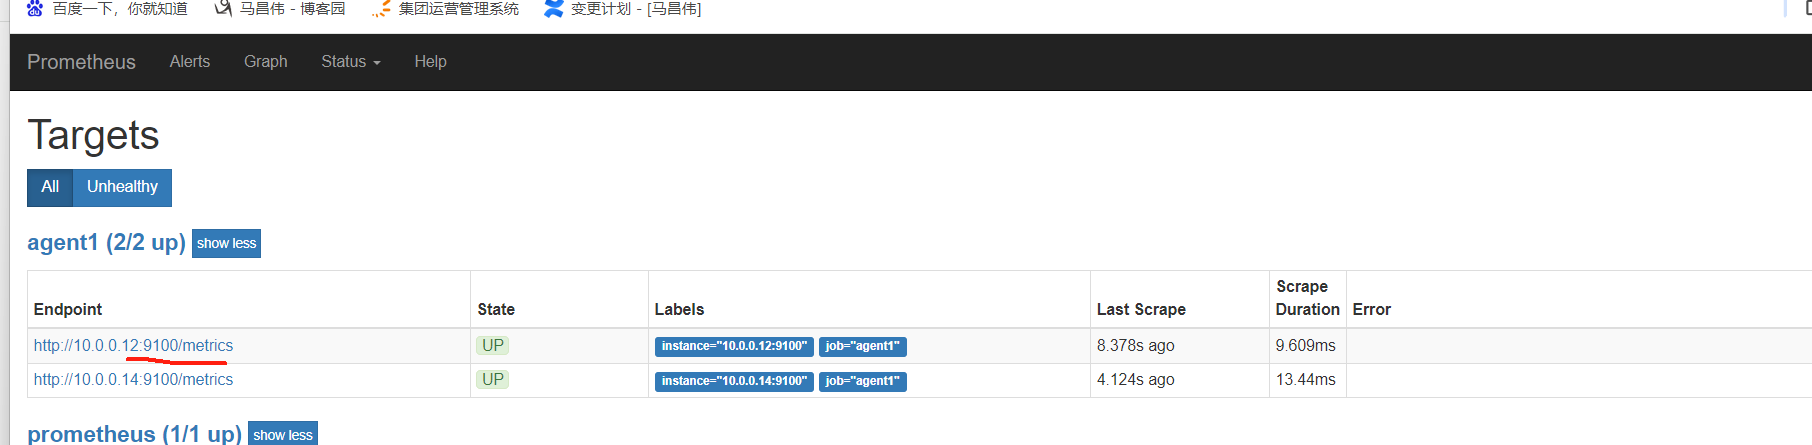
刷新一下,可以看到监控组下有两个了,是job name来分组的
其它
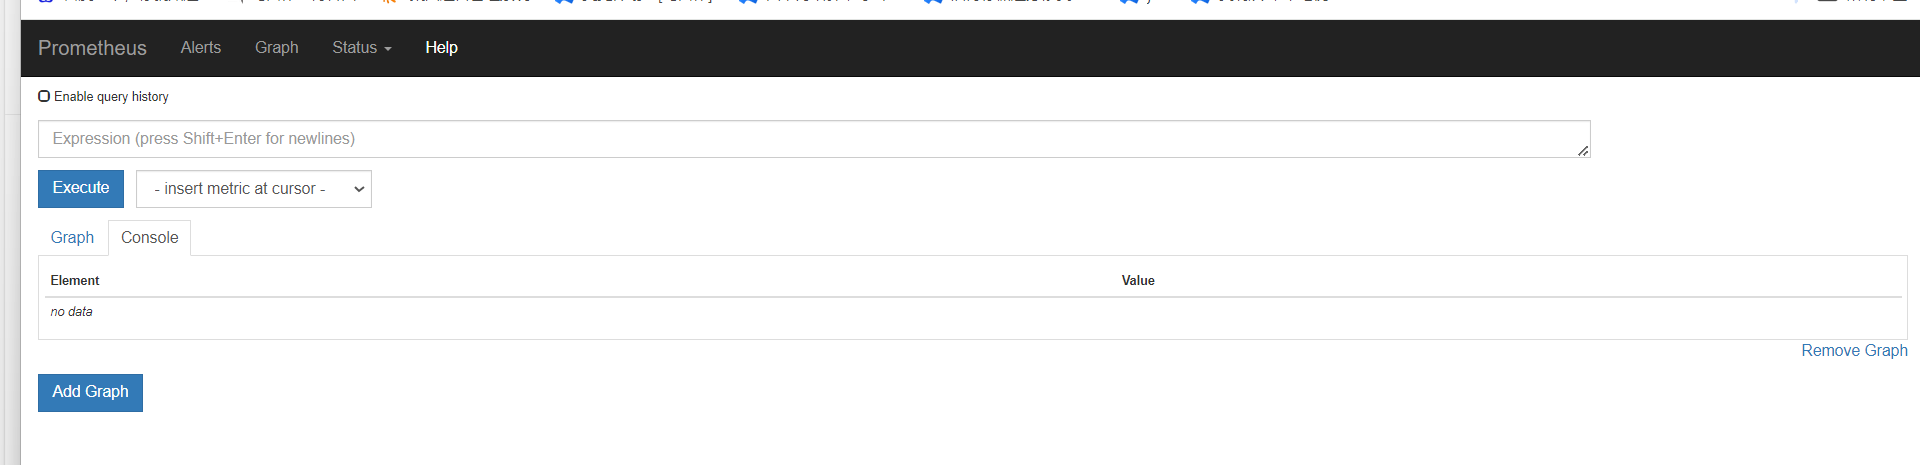
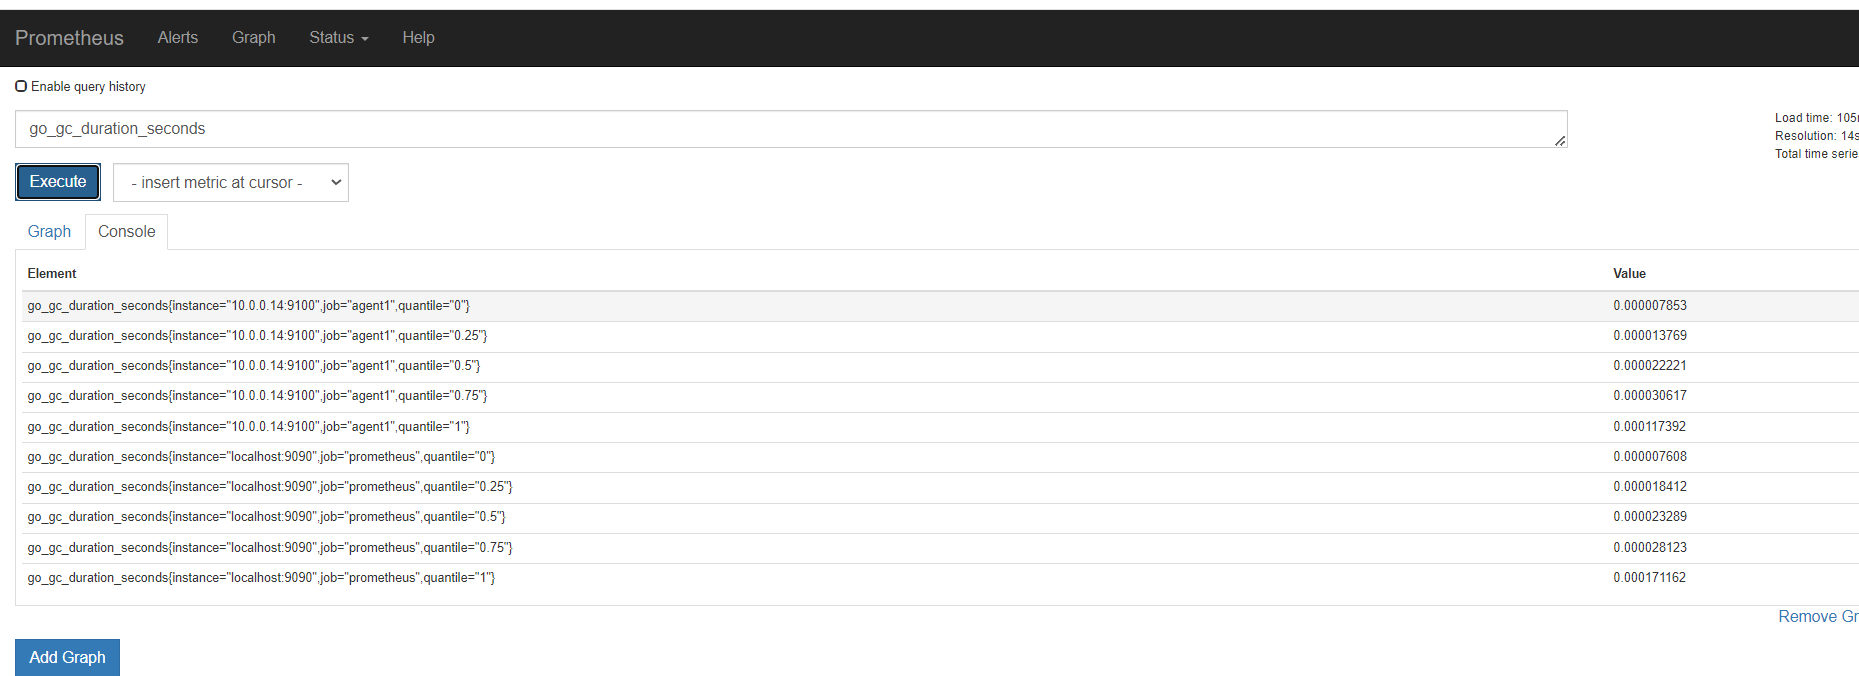
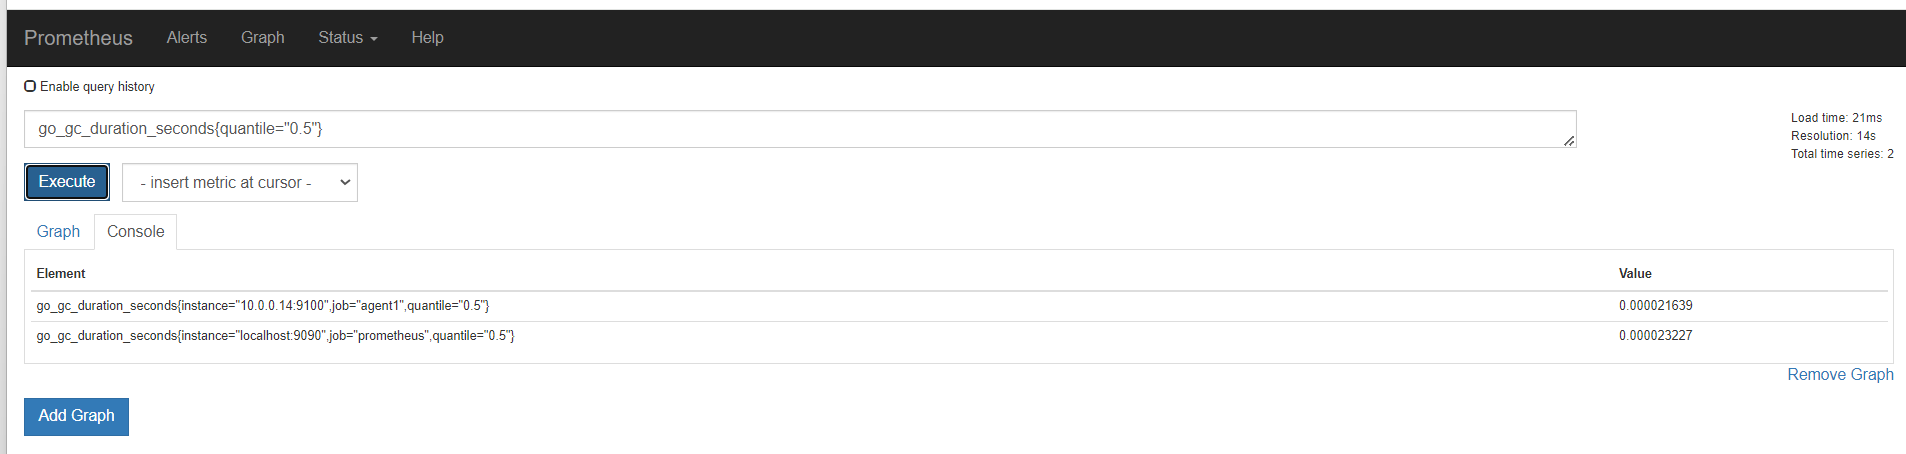
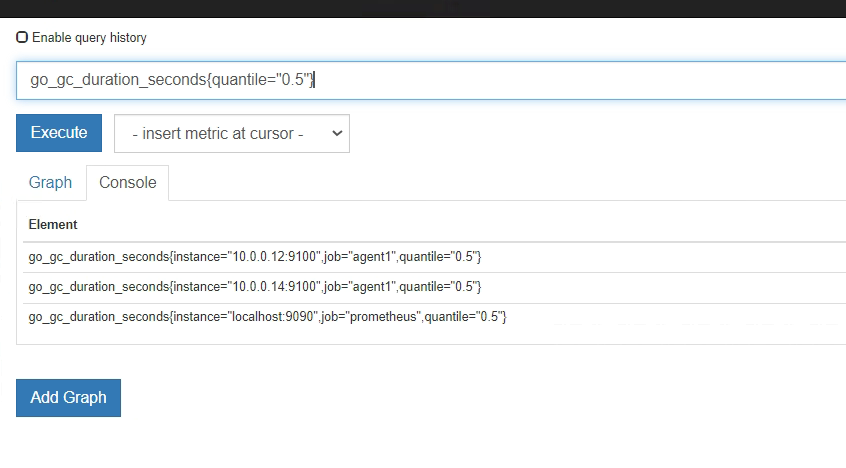
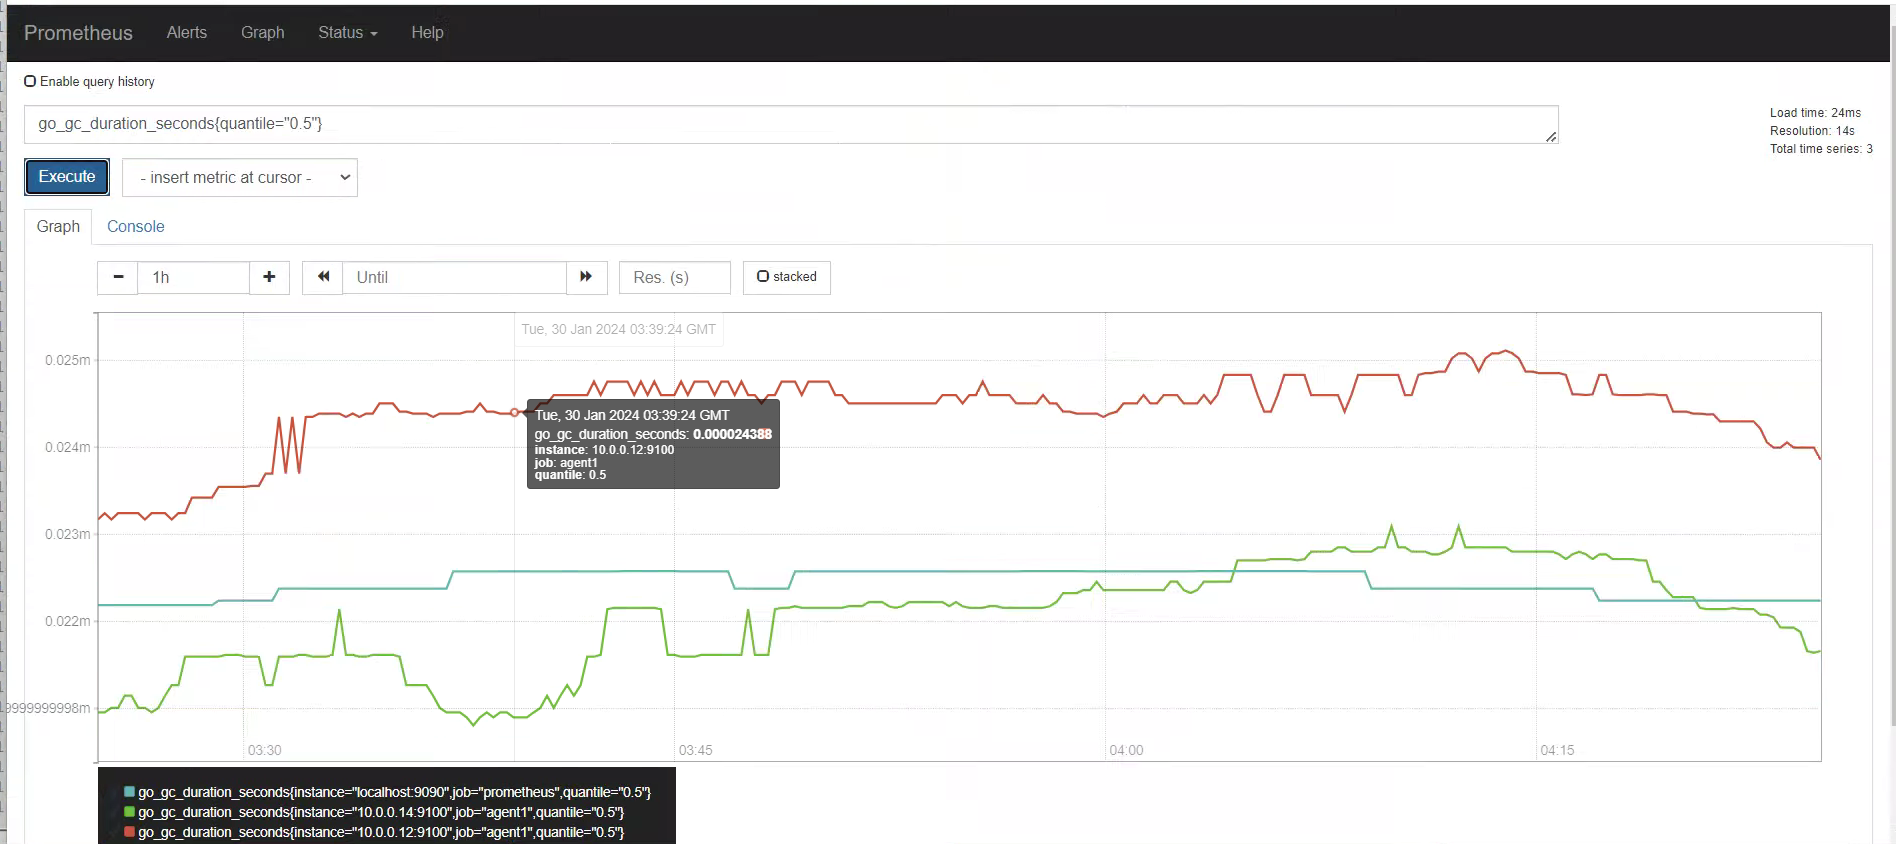
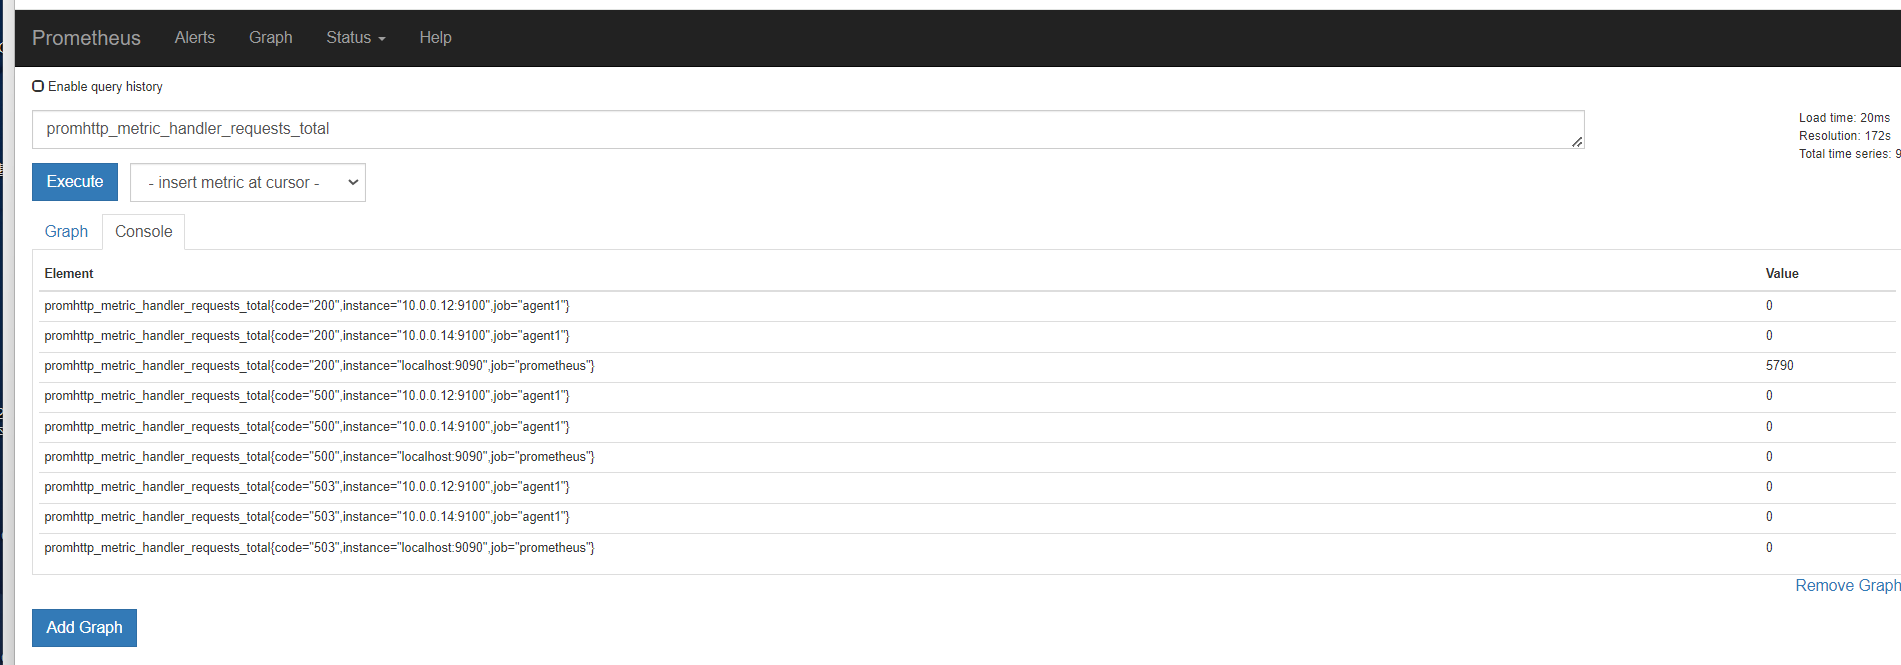
第一个指标 ,表达式浏览器
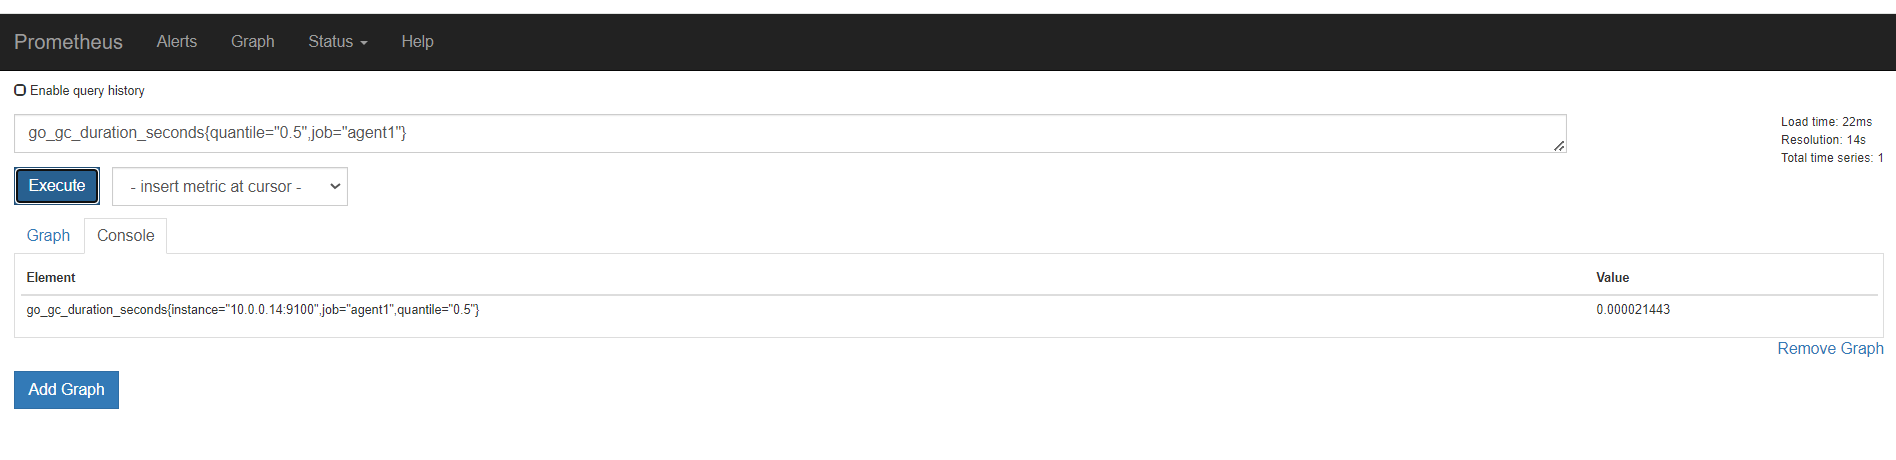
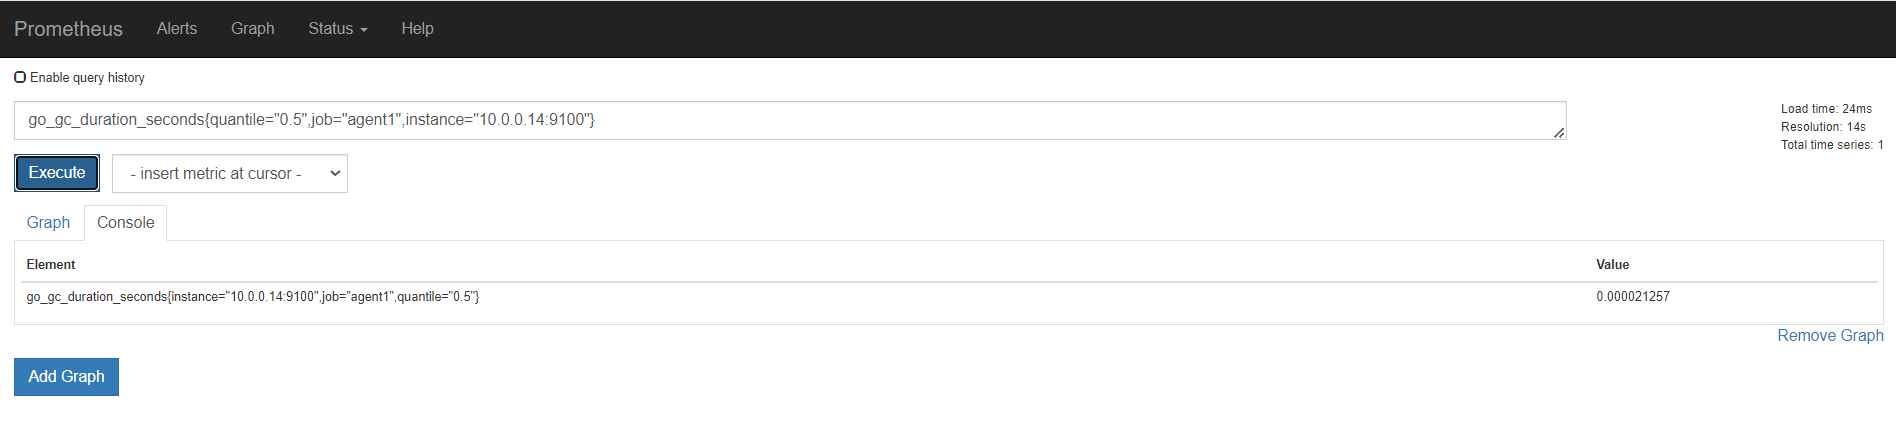
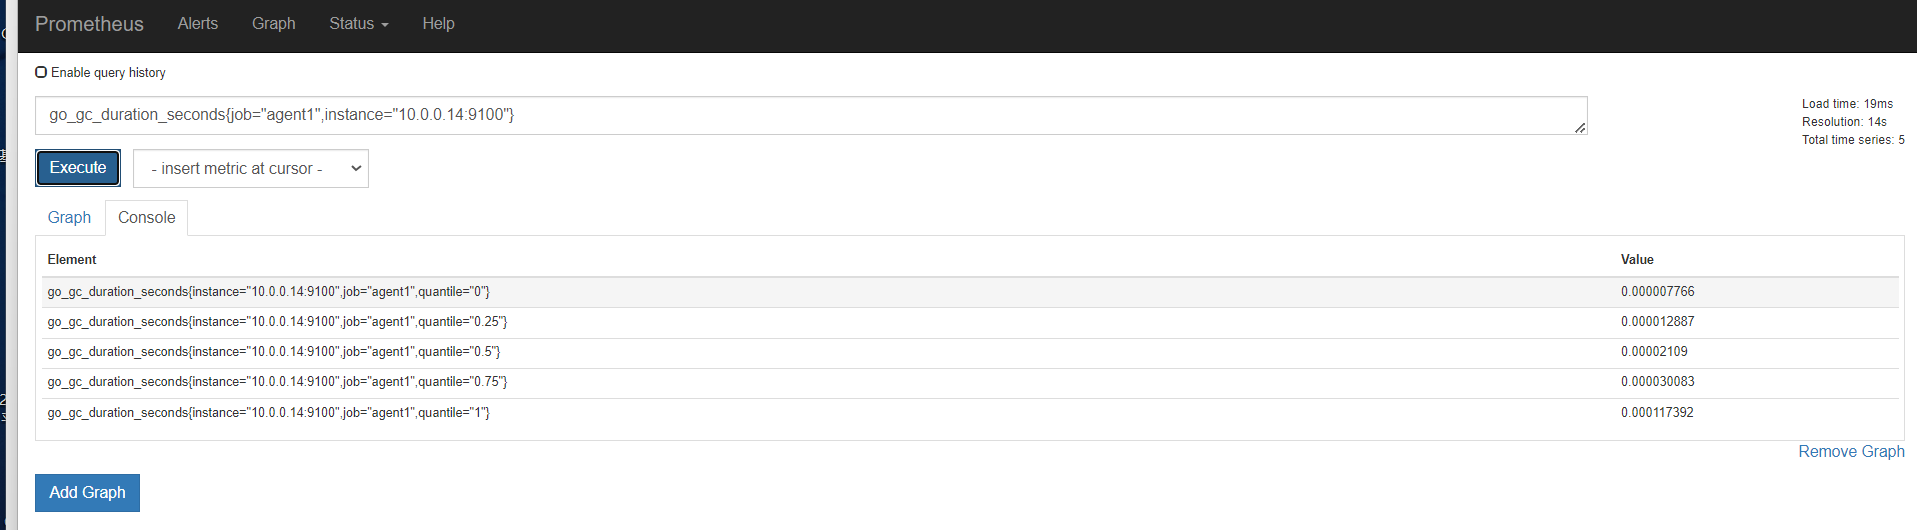
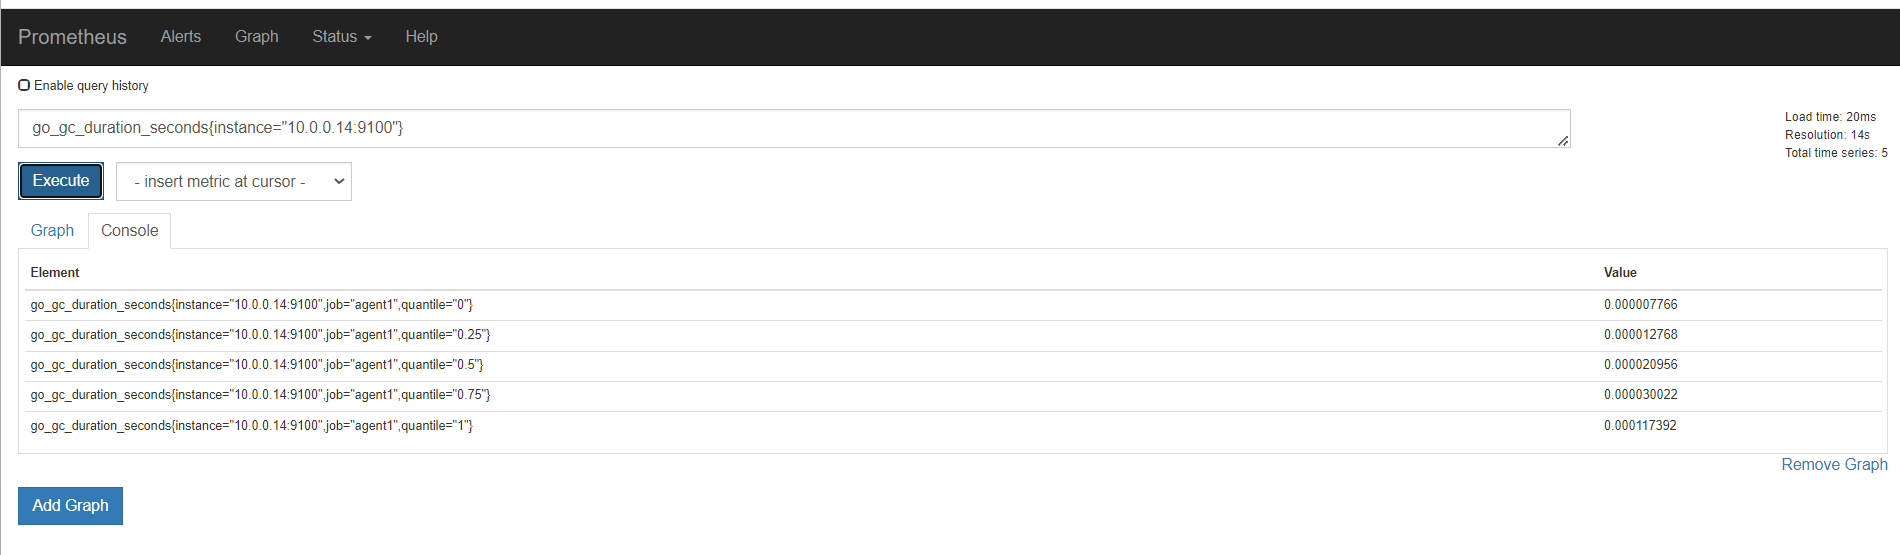
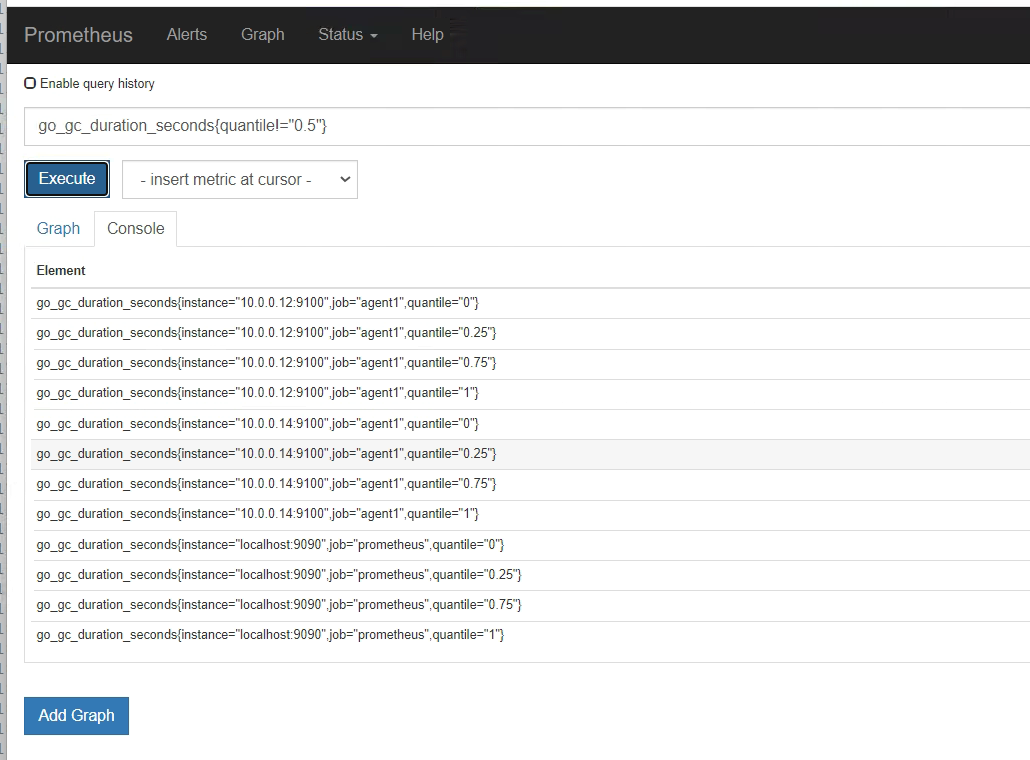
不等于,取反
聚合时间序列 sum rate
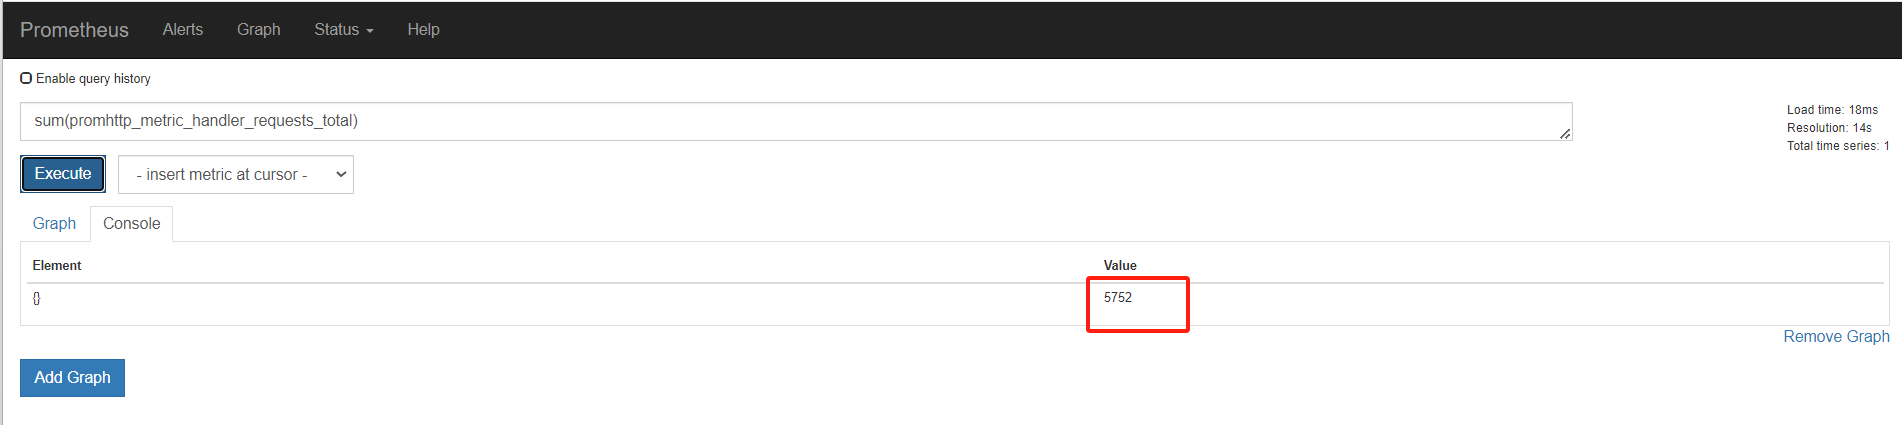
sum
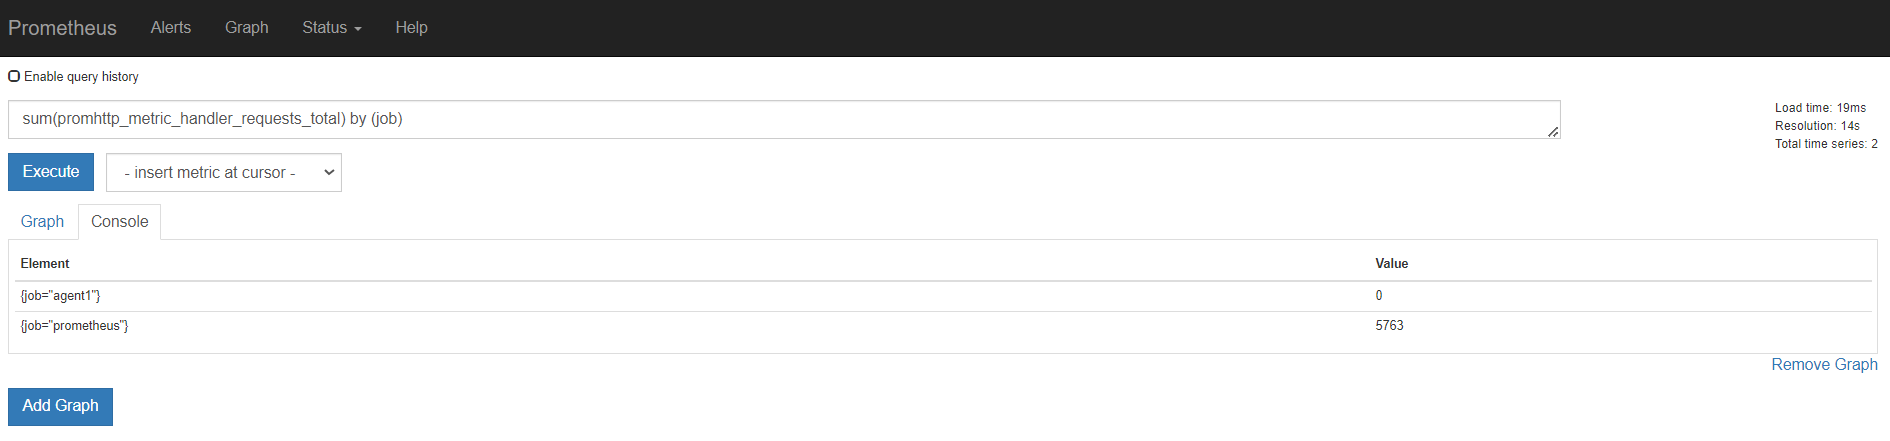
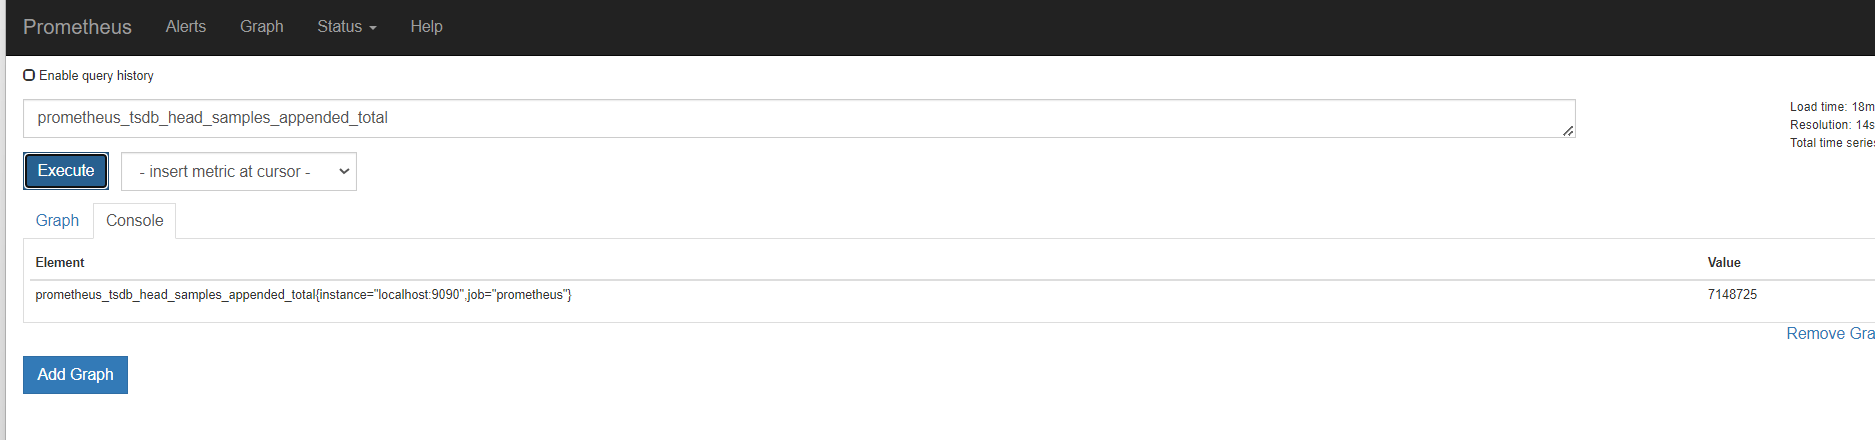
服务端撞去数据产生的http请求总数

sum,对这些结果累加,值是随时变化的,因为请求次数很快就多出来一个
sum()是统计所有,是这个指标求和。 by ()就是根据那个进行分组求和 。也就是分组聚合 sum(promhttp_metric_handler_requests_total) by (job)
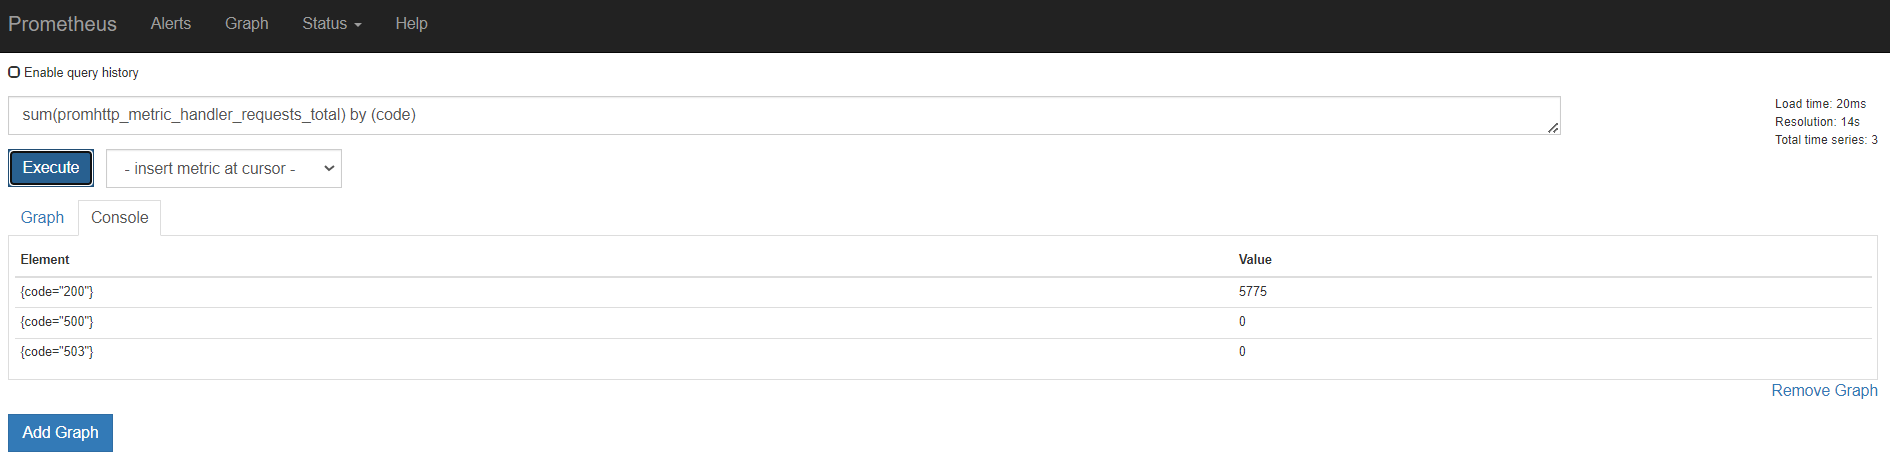
我们看上面那个指标,我们可以知道,还可以根据code和instance分组聚合。分组统计http请求个数
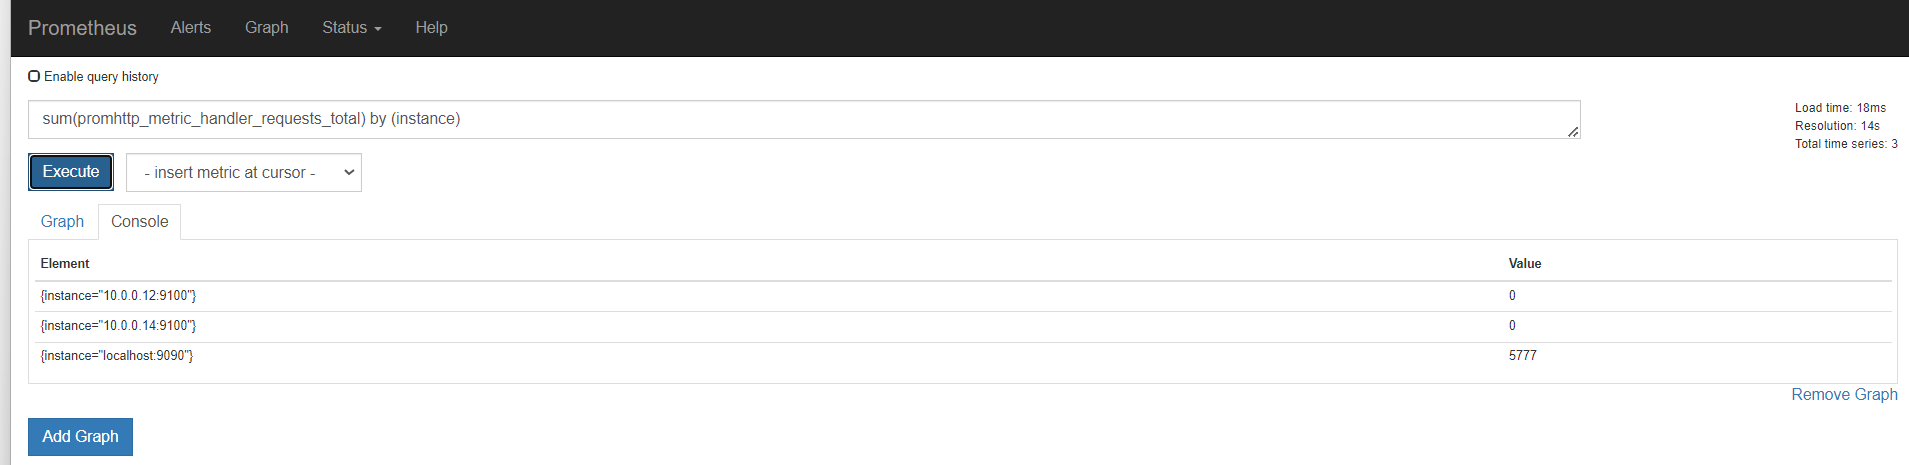
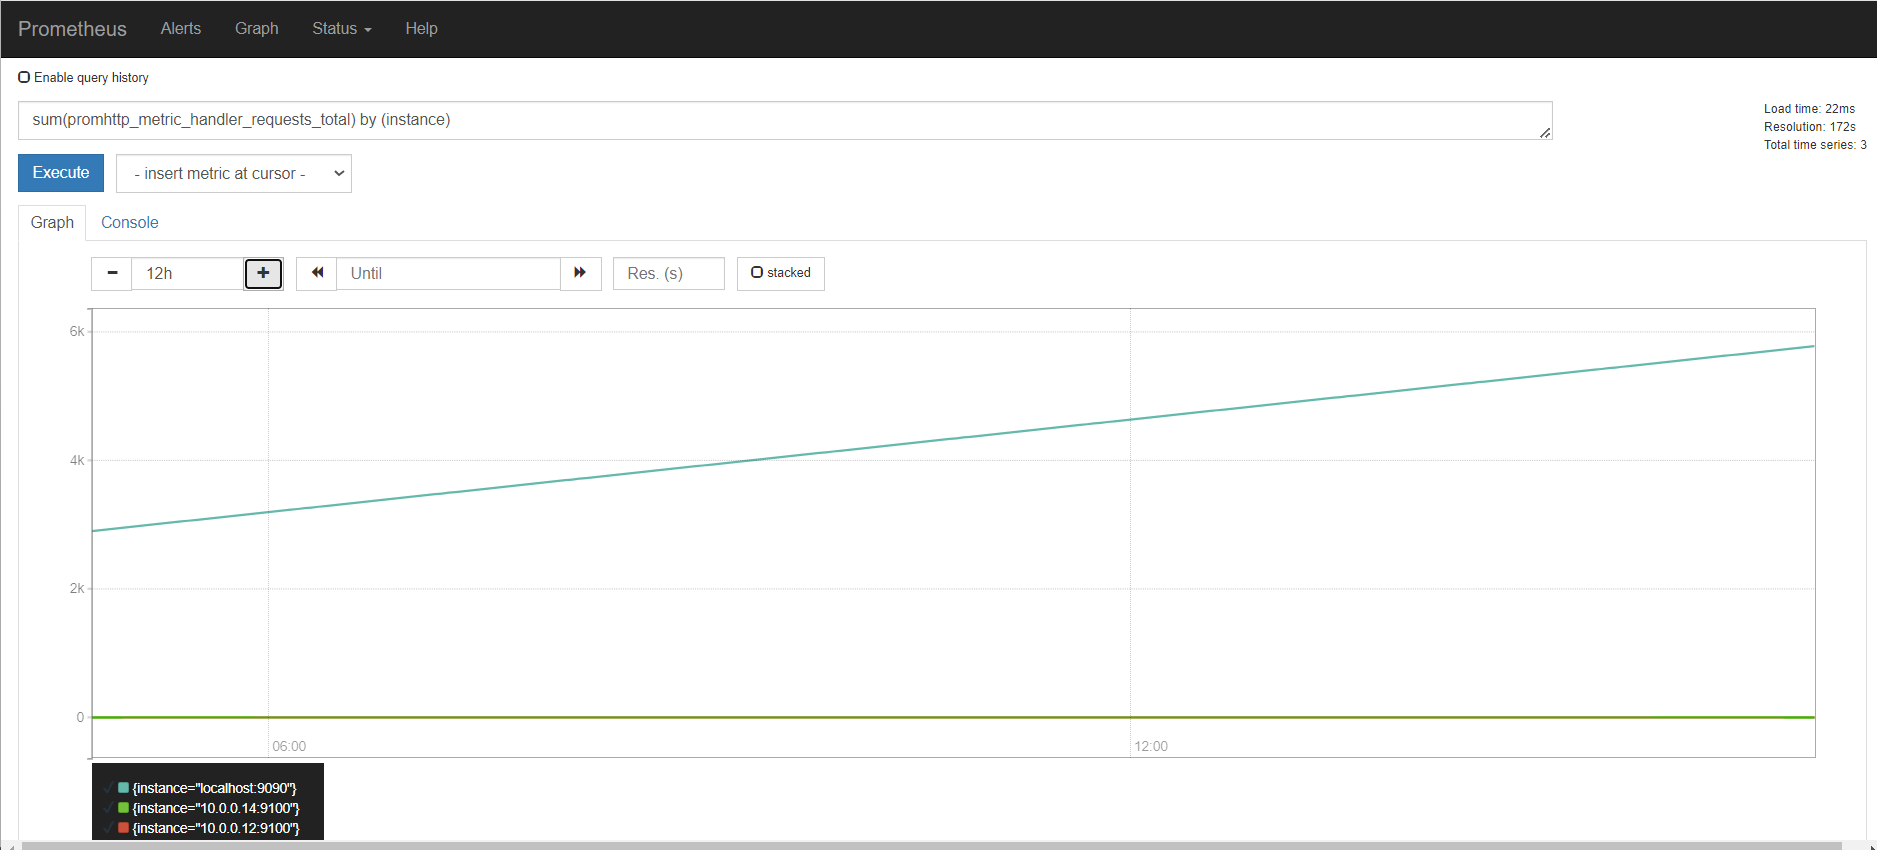
分组统计个数之后,还能看到图形
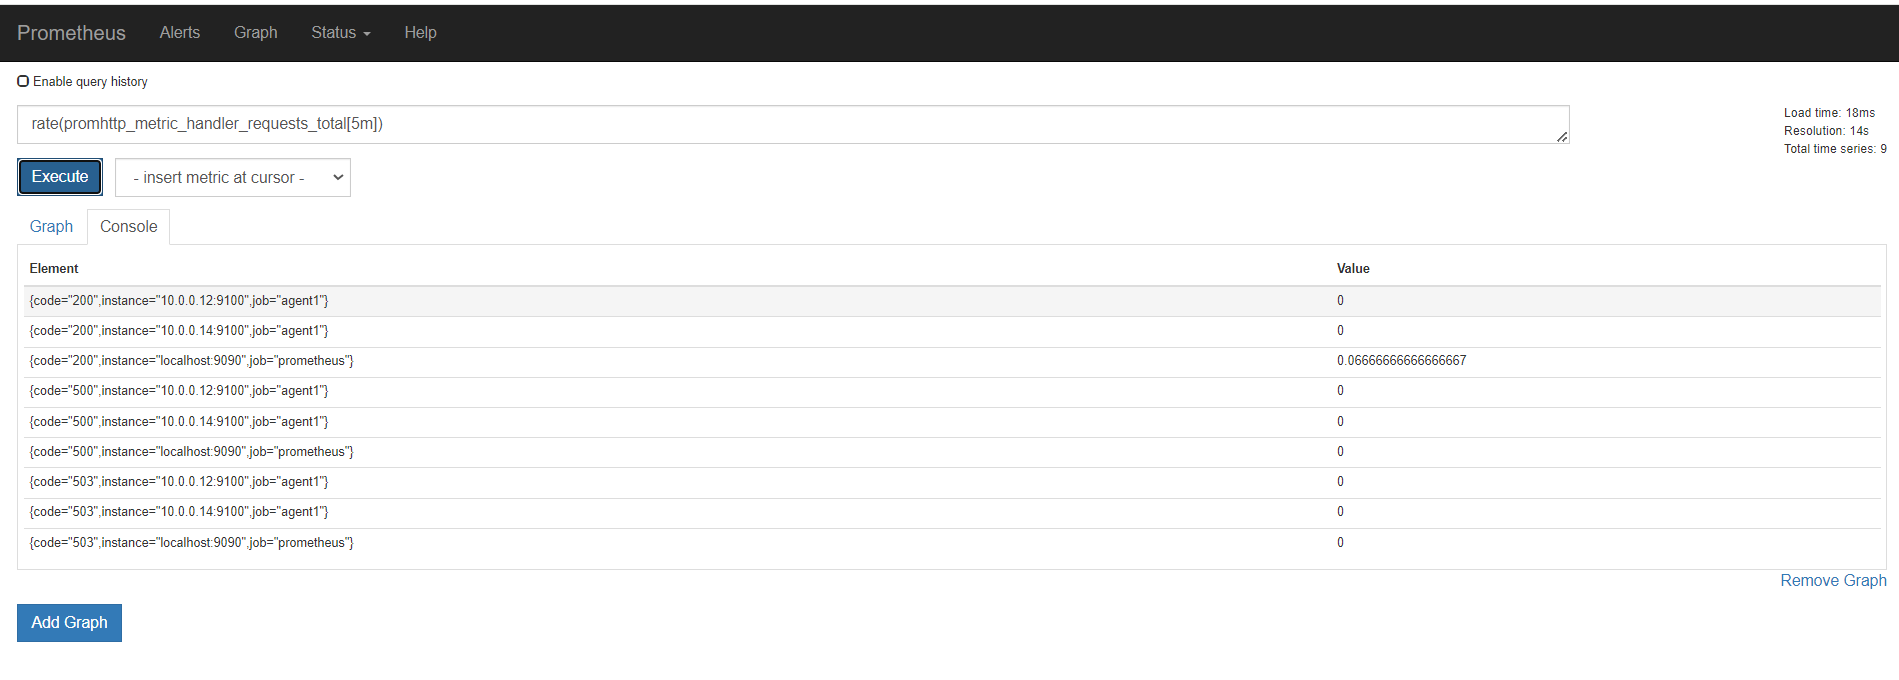
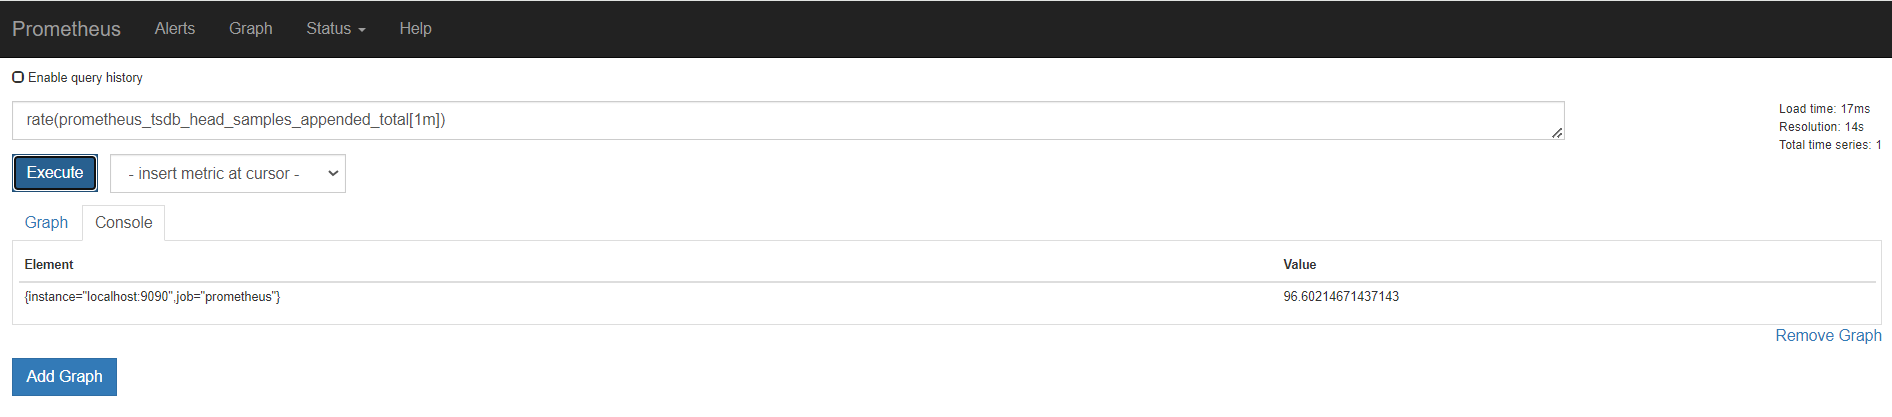
rate
s m h d 天 w 周
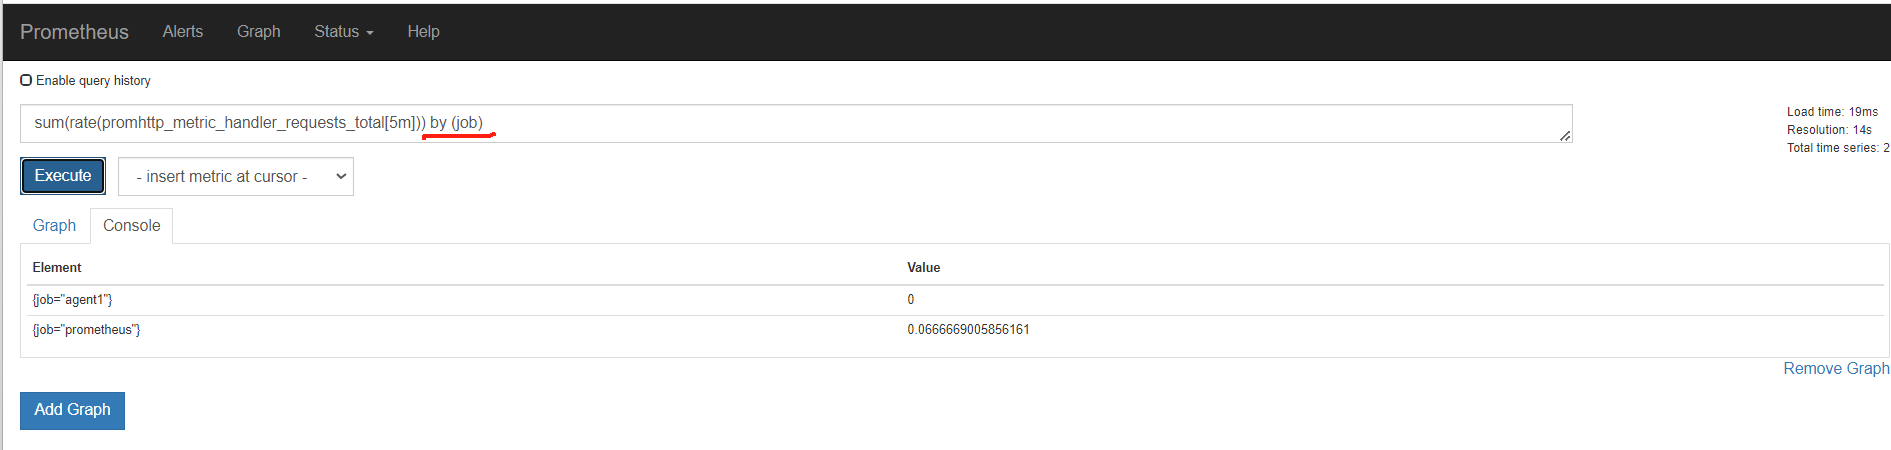
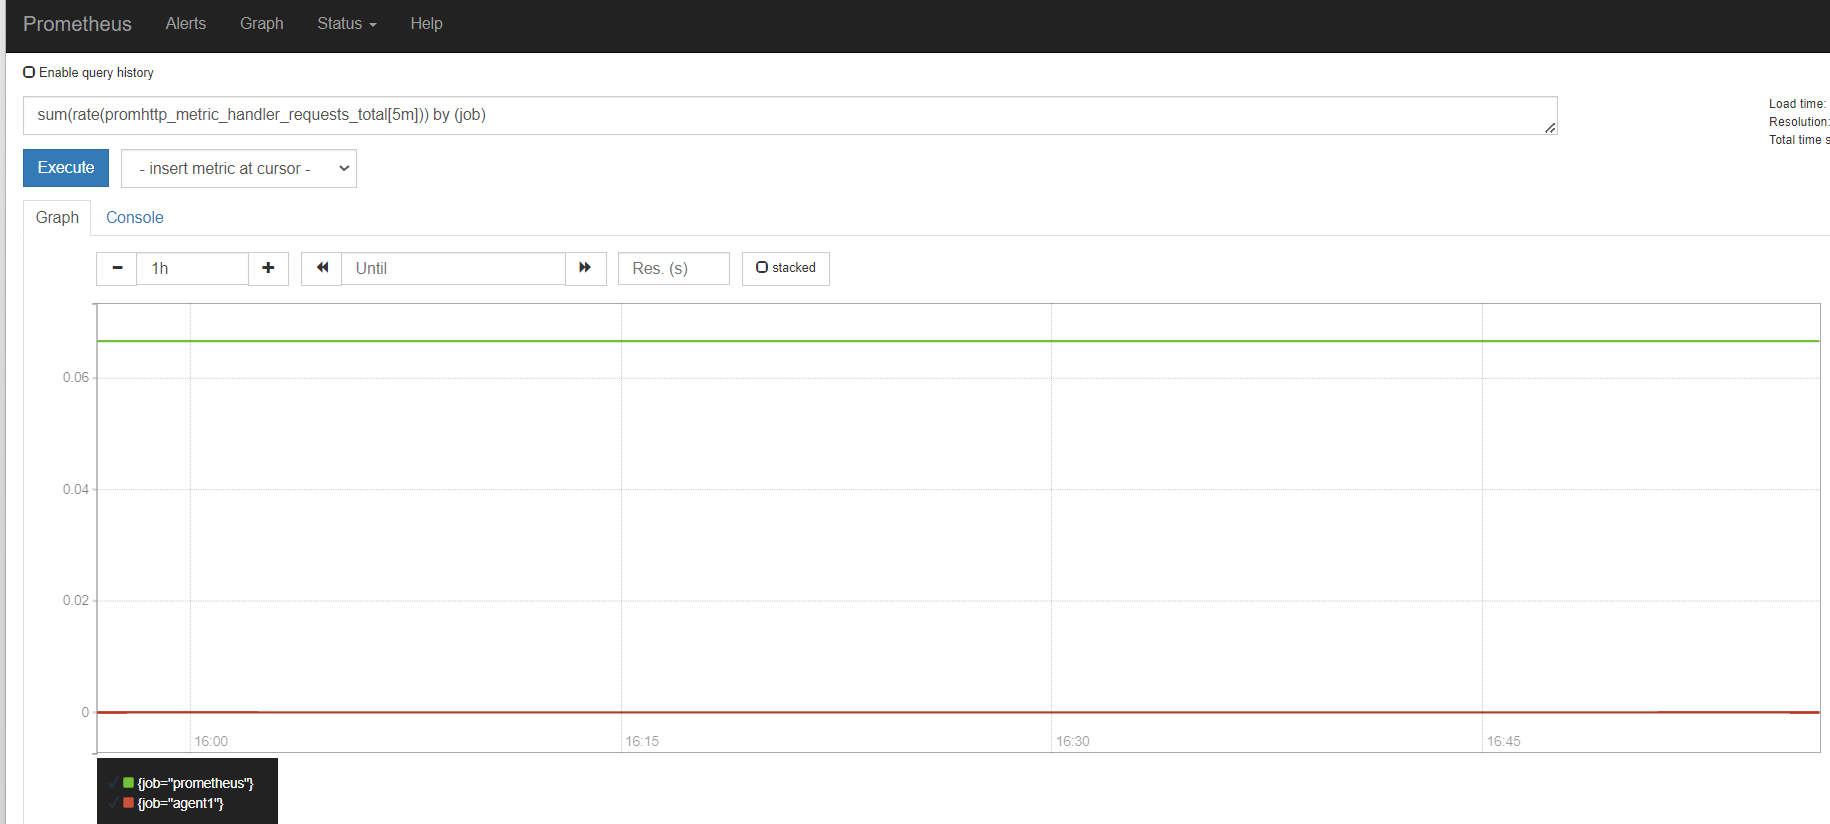
sum(rate(promhttp_metric_handler_requests_total[5m])) by (job)
原始这样的
需要指定时间
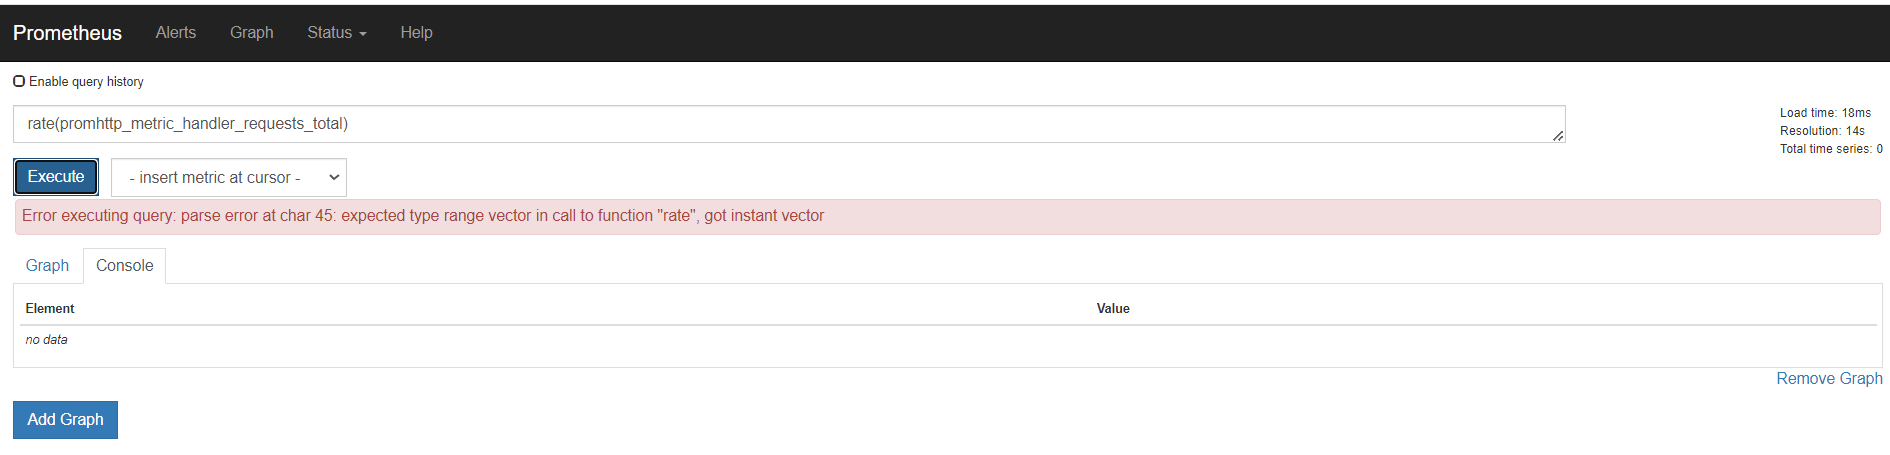
这里指定5分钟rate用来计算一定范围内时间序列的每秒平均增长率。只能遇见计数器一起使用
上面是所有元素各自的结果,加上sum(),就是上面所有的统计求和,这里结果是一样的
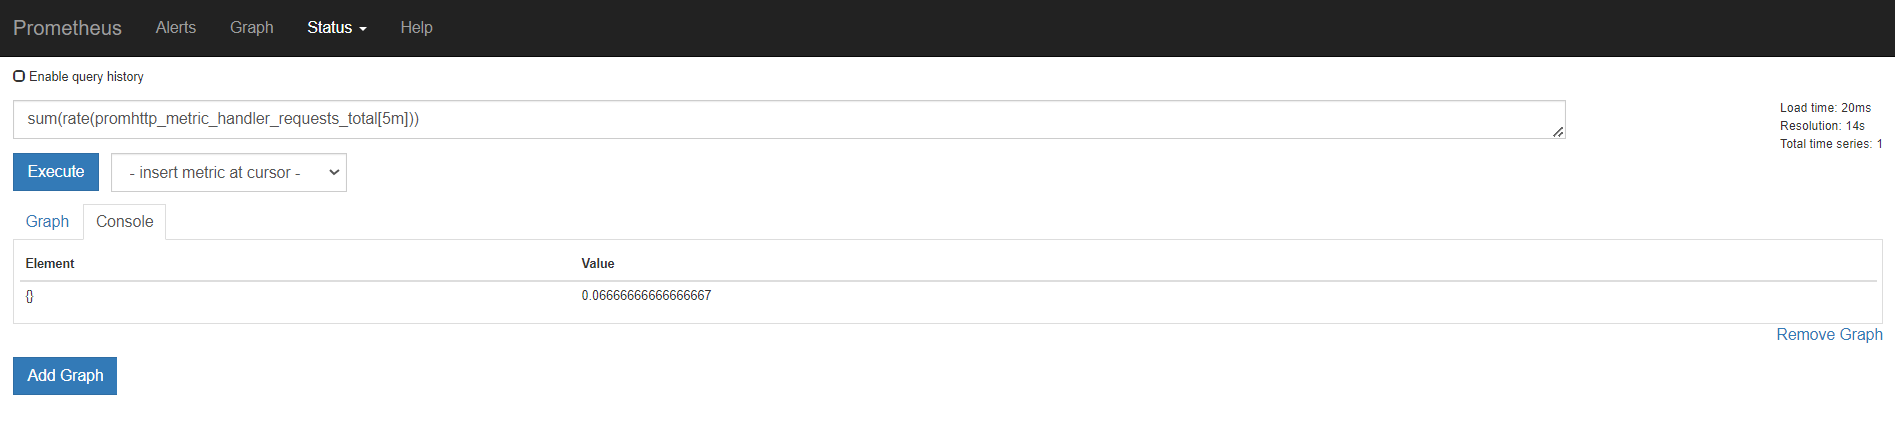
再用by分组聚合
容量规划
内存
磁盘
监控节点
安装node exporter
wget https://github.com/prometheus/node_exporter/releases/download/v0.16.0/node_exporter-0.16.0.linux-amd64.tar.gz
tar xf node_exporter-*
sudo cp node_exporter-*/node_exporter /usr/local/bin/
查看版本
[root@mcw02 ~]# /usr/local/node_exporter/node_exporter --version
node_exporter, version 0.16.0 (branch: HEAD, revision: d42bd70f4363dced6b77d8fc311ea57b63387e4f)
  build user:       root@a67a9bc13a69
  build date:       20180515-15:52:42
  go version:       go1.9.6
[root@mcw02 ~]#
配置node exporter
[root@mcw02 ~]# /usr/local/node_exporter/node_exporter --help
usage: node_exporter [<flags>]

Flags:
  -h, --help                    Show context-sensitive help (also try --help-long and --help-man).
      --collector.diskstats.ignored-devices="^(ram|loop|fd|(h|s|v|xv)d[a-z]|nvme\\d+n\\d+p)\\d+$"
                                Regexp of devices to ignore for diskstats.
      --collector.filesystem.ignored-mount-points="^/(dev|proc|sys|var/lib/docker)($|/)"
                                Regexp of mount points to ignore for filesystem collector.
      --collector.filesystem.ignored-fs-types="^(autofs|binfmt_misc|cgroup|configfs|debugfs|devpts|devtmpfs|fusectl|hugetlbfs|mqueue|overlay|proc|procfs|pstore|rpc_pipefs|securityfs|sysfs|tracefs)$"
                                Regexp of filesystem types to ignore for filesystem collector.
      --collector.netdev.ignored-devices="^$"
                                Regexp of net devices to ignore for netdev collector.
      --collector.netstat.fields="^(.*_(InErrors|InErrs)|Ip_Forwarding|Ip(6|Ext)_(InOctets|OutOctets)|Icmp6?_(InMsgs|OutMsgs)|TcpExt_(Listen.*|Syncookies.*)|Tcp_(ActiveOpens|PassiveOpens|RetransSegs|CurrEstab)|Udp6?_(InDatagrams|OutDatagrams|NoPorts))$"
                                Regexp of fields to return for netstat collector.
      --collector.ntp.server="127.0.0.1"
                                NTP server to use for ntp collector
      --collector.ntp.protocol-version=4
                                NTP protocol version
      --collector.ntp.server-is-local
                                Certify that collector.ntp.server address is the same local host as this collector.
      --collector.ntp.ip-ttl=1  IP TTL to use while sending NTP query
      --collector.ntp.max-distance=3.46608s
                                Max accumulated distance to the root
      --collector.ntp.local-offset-tolerance=1ms
                                Offset between local clock and local ntpd time to tolerate
      --path.procfs="/proc"     procfs mountpoint.
      --path.sysfs="/sys"       sysfs mountpoint.
      --collector.qdisc.fixtures=""
                                test fixtures to use for qdisc collector end-to-end testing
      --collector.runit.servicedir="/etc/service"
                                Path to runit service directory.
      --collector.supervisord.url="http://localhost:9001/RPC2"
                                XML RPC endpoint.
      --collector.systemd.unit-whitelist=".+"
                                Regexp of systemd units to whitelist. Units must both match whitelist and not match blacklist to be included.
      --collector.systemd.unit-blacklist=".+\\.scope"
                                Regexp of systemd units to blacklist. Units must both match whitelist and not match blacklist to be included.
      --collector.systemd.private
                                Establish a private, direct connection to systemd without dbus.
      --collector.textfile.directory=""
                                Directory to read text files with metrics from.
      --collector.vmstat.fields="^(oom_kill|pgpg|pswp|pg.*fault).*"
                                Regexp of fields to return for vmstat collector.
      --collector.wifi.fixtures=""
                                test fixtures to use for wifi collector metrics
      --collector.arp           Enable the arp collector (default: enabled).
      --collector.bcache        Enable the bcache collector (default: enabled).
      --collector.bonding       Enable the bonding collector (default: enabled).
      --collector.buddyinfo     Enable the buddyinfo collector (default: disabled).
      --collector.conntrack     Enable the conntrack collector (default: enabled).
      --collector.cpu           Enable the cpu collector (default: enabled).
      --collector.diskstats     Enable the diskstats collector (default: enabled).
      --collector.drbd          Enable the drbd collector (default: disabled).
      --collector.edac          Enable the edac collector (default: enabled).
      --collector.entropy       Enable the entropy collector (default: enabled).
      --collector.filefd        Enable the filefd collector (default: enabled).
      --collector.filesystem    Enable the filesystem collector (default: enabled).
      --collector.hwmon         Enable the hwmon collector (default: enabled).
      --collector.infiniband    Enable the infiniband collector (default: enabled).
      --collector.interrupts    Enable the interrupts collector (default: disabled).
      --collector.ipvs          Enable the ipvs collector (default: enabled).
      --collector.ksmd          Enable the ksmd collector (default: disabled).
      --collector.loadavg       Enable the loadavg collector (default: enabled).
      --collector.logind        Enable the logind collector (default: disabled).
      --collector.mdadm         Enable the mdadm collector (default: enabled).
      --collector.meminfo       Enable the meminfo collector (default: enabled).
      --collector.meminfo_numa  Enable the meminfo_numa collector (default: disabled).
      --collector.mountstats    Enable the mountstats collector (default: disabled).
      --collector.netdev        Enable the netdev collector (default: enabled).
      --collector.netstat       Enable the netstat collector (default: enabled).
      --collector.nfs           Enable the nfs collector (default: enabled).
      --collector.nfsd          Enable the nfsd collector (default: enabled).
      --collector.ntp           Enable the ntp collector (default: disabled).
      --collector.qdisc         Enable the qdisc collector (default: disabled).
      --collector.runit         Enable the runit collector (default: disabled).
      --collector.sockstat      Enable the sockstat collector (default: enabled).
      --collector.stat          Enable the stat collector (default: enabled).
      --collector.supervisord   Enable the supervisord collector (default: disabled).
      --collector.systemd       Enable the systemd collector (default: disabled).
      --collector.tcpstat       Enable the tcpstat collector (default: disabled).
      --collector.textfile      Enable the textfile collector (default: enabled).
      --collector.time          Enable the time collector (default: enabled).
      --collector.uname         Enable the uname collector (default: enabled).
      --collector.vmstat        Enable the vmstat collector (default: enabled).
      --collector.wifi          Enable the wifi collector (default: enabled).
      --collector.xfs           Enable the xfs collector (default: enabled).
      --collector.zfs           Enable the zfs collector (default: enabled).
      --collector.timex         Enable the timex collector (default: enabled).
      --web.listen-address=":9100"
                                Address on which to expose metrics and web interface.
      --web.telemetry-path="/metrics"
                                Path under which to expose metrics.
      --log.level="info"        Only log messages with the given severity or above. Valid levels: [debug, info, warn, error, fatal]
      --log.format="logger:stderr"
                                Set the log target and format. Example: "logger:syslog?appname=bob&local=7" or "logger:stdout?json=true"
      --version                 Show application version.

[root@mcw02 ~]#
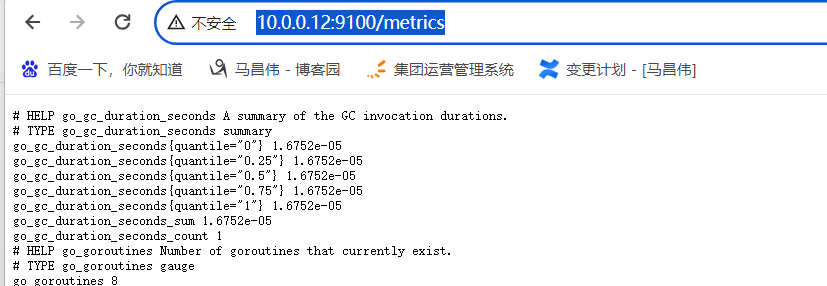
下面这样启动的,默认访问地址 http://10.0.0.12:9100/metrics
[root@mcw02 ~]# nohup /usr/local/node_exporter/node_exporter &
[1] 43955
[root@mcw02 ~]#
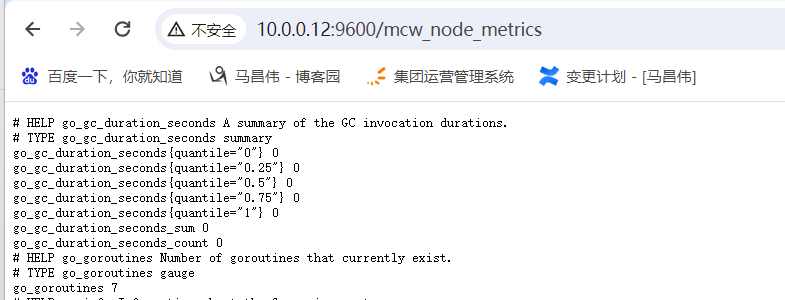
如下添加参数访问,指定端口和访问路径
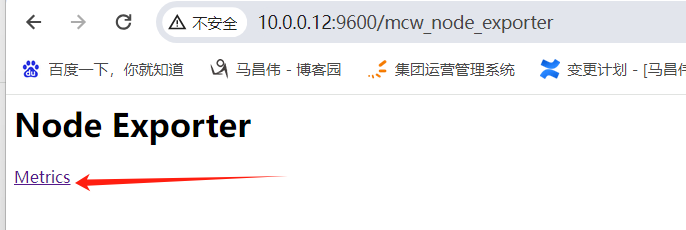
[root@mcw02 ~]# nohup /usr/local/node_exporter/node_exporter --web.listen-address=":9600" --web.telemetry-path="/mcw_node_metrics"  &
[1] 43998
[root@mcw02 ~]#
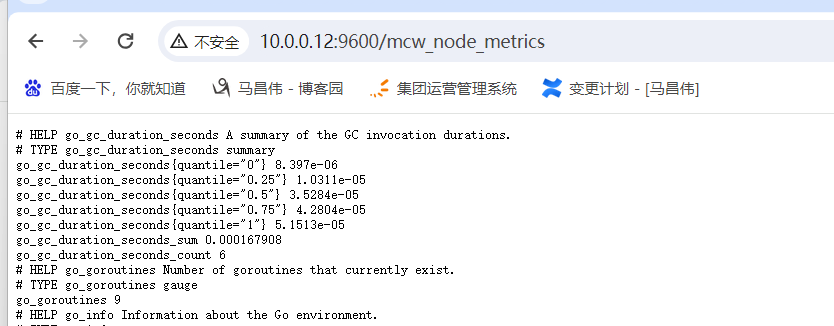
可以看到,正常访问到数据 http://10.0.0.12:9600/mcw_node_metrics
curl请求
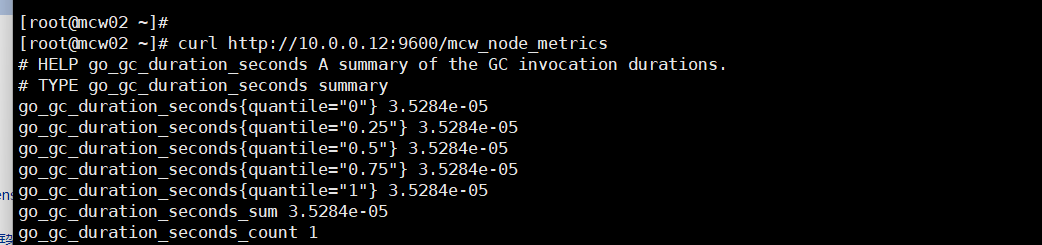
报错了,是因为我们已经改了端口了
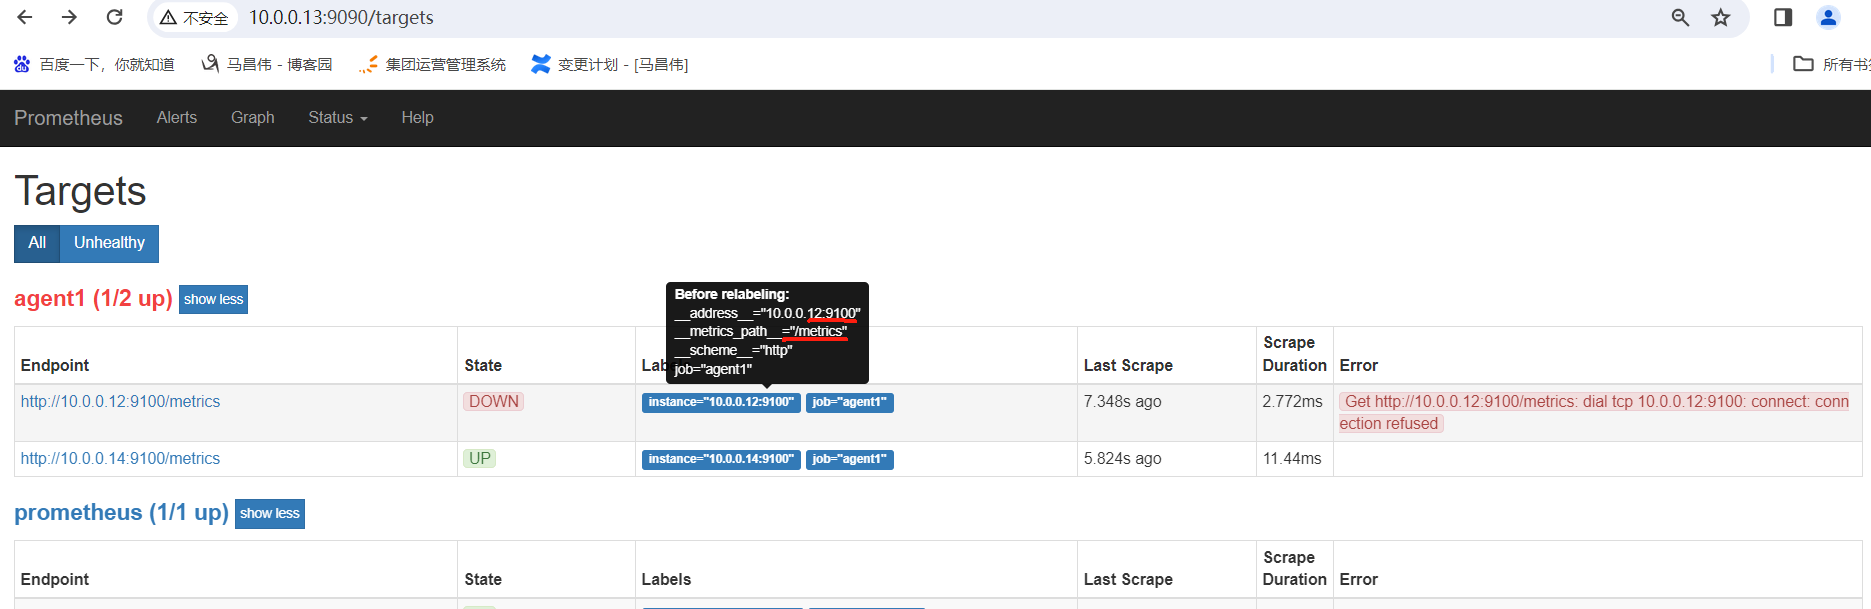
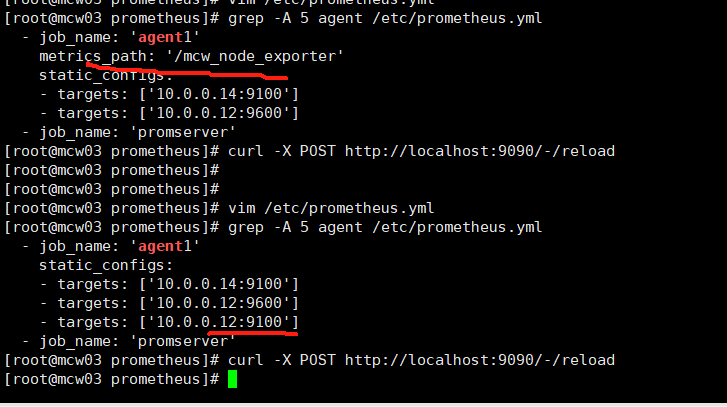
服务端修改配置端口,重载配置
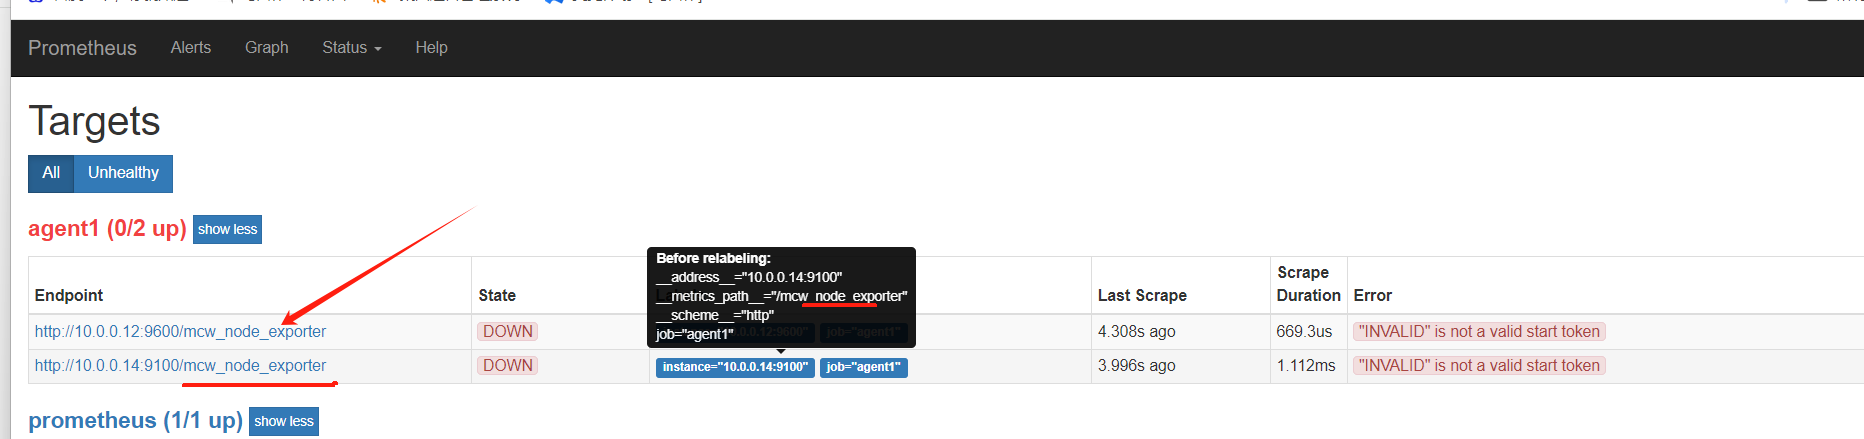
[root@mcw03 prometheus]# vim /etc/prometheus.yml
[root@mcw03 prometheus]# grep -A 5 agent /etc/prometheus.yml
  - job_name: 'agent1'
    static_configs:
    - targets: ['10.0.0.14:9100']
    - targets: ['10.0.0.12:9600']
  - job_name: 'promserver'
    static_configs:
[root@mcw03 prometheus]# curl -X POST http://localhost:9090/-/reload
[root@mcw03 prometheus]#
"INVALID" is not a valid start token
端口改了,但是访问路径没有改,还是报错

一修改,改的一组的,访问路径。点击访问12节点的
可以访问到数据
数据粗来了
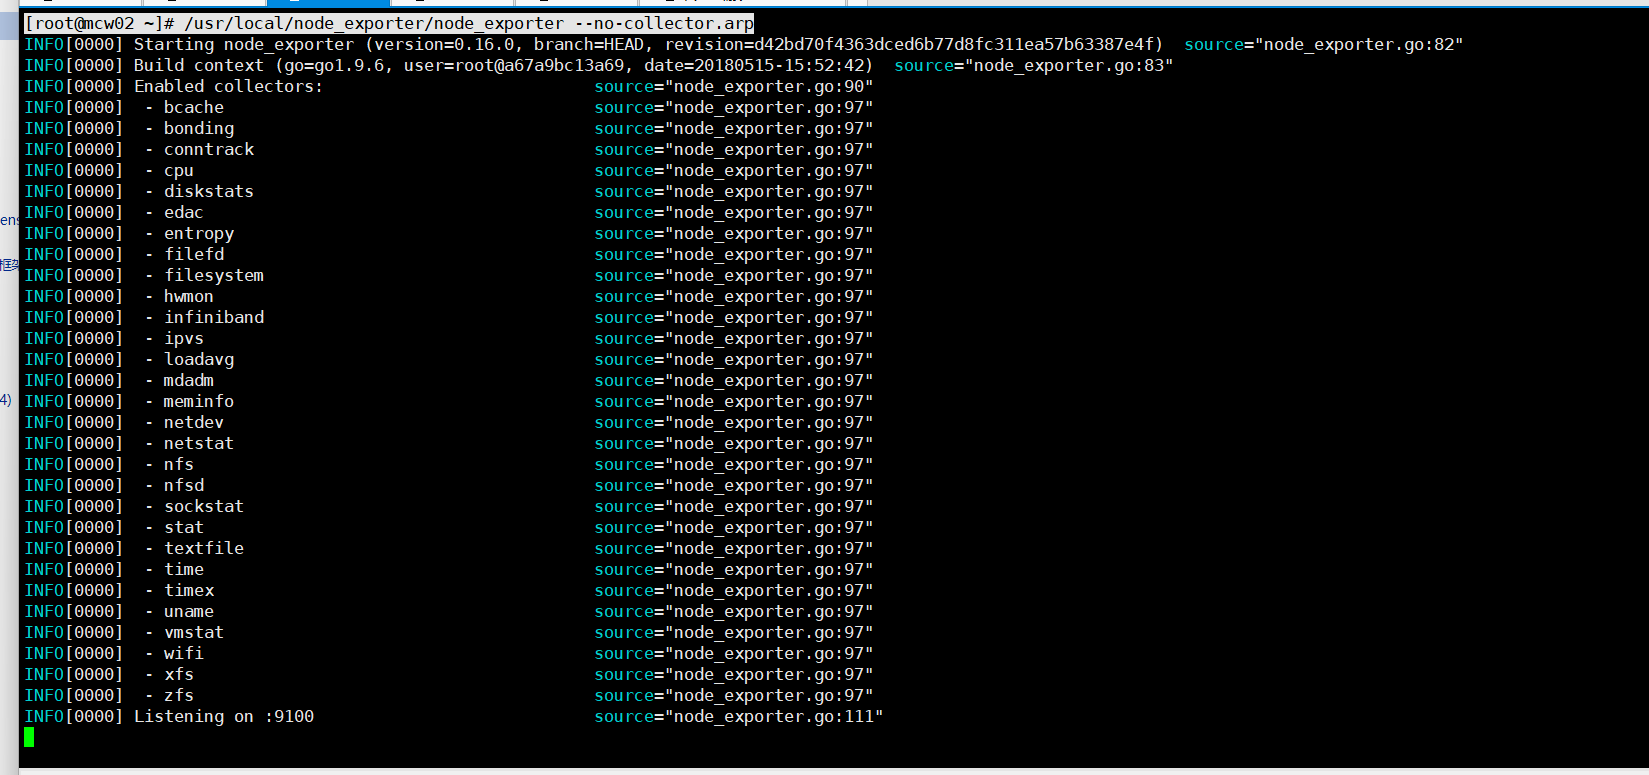
默认是开启的收集器,想要关闭,前面加no-
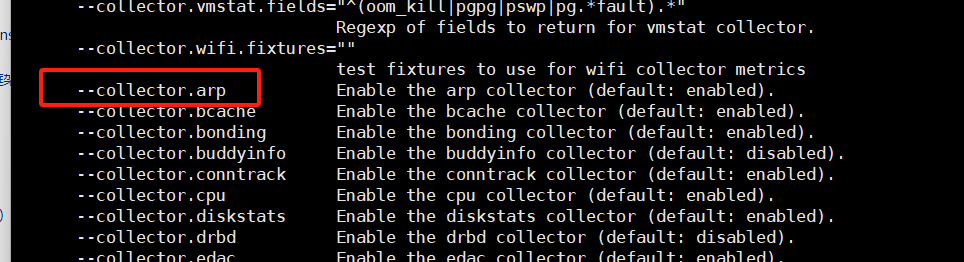
关闭arp执行
[root@mcw02 ~]# /usr/local/node_exporter/node_exporter --no-collector.arp
这因为端口 不同,直接一个机器上起了两个客户端,并且可以 访问
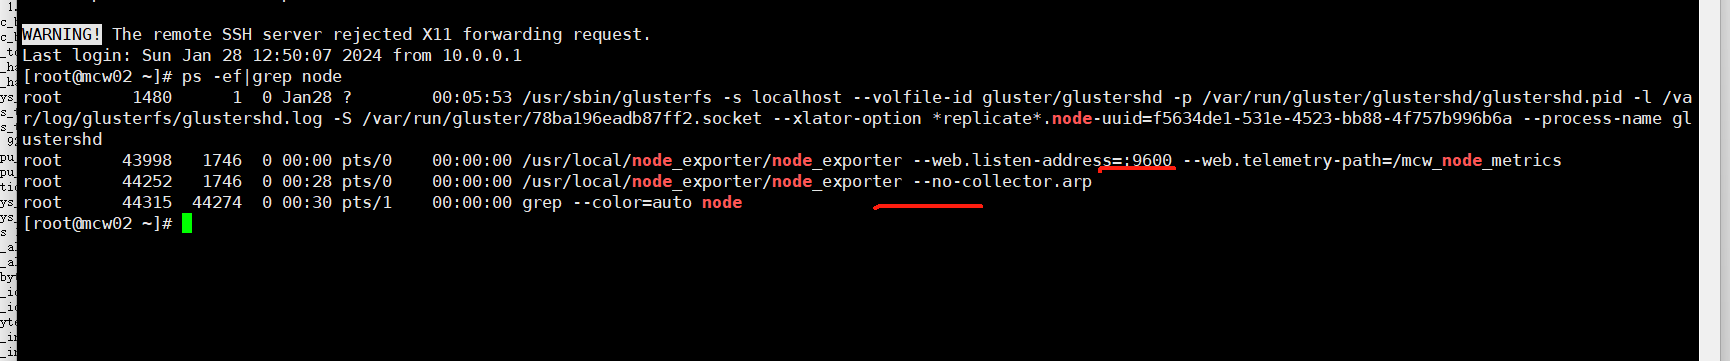
把path去掉之后,使用默认的路径,都up了,并且12节点上起了两个客户端
9600端口,如果不改路径,那么也可up

配置textfile收集器
创建目录保存指标定义文件
[root@mcw02 ~]# mkdir -p /var/lib/node_exporter/textfile_collector
[root@mcw02 ~]#
没有这个指标的
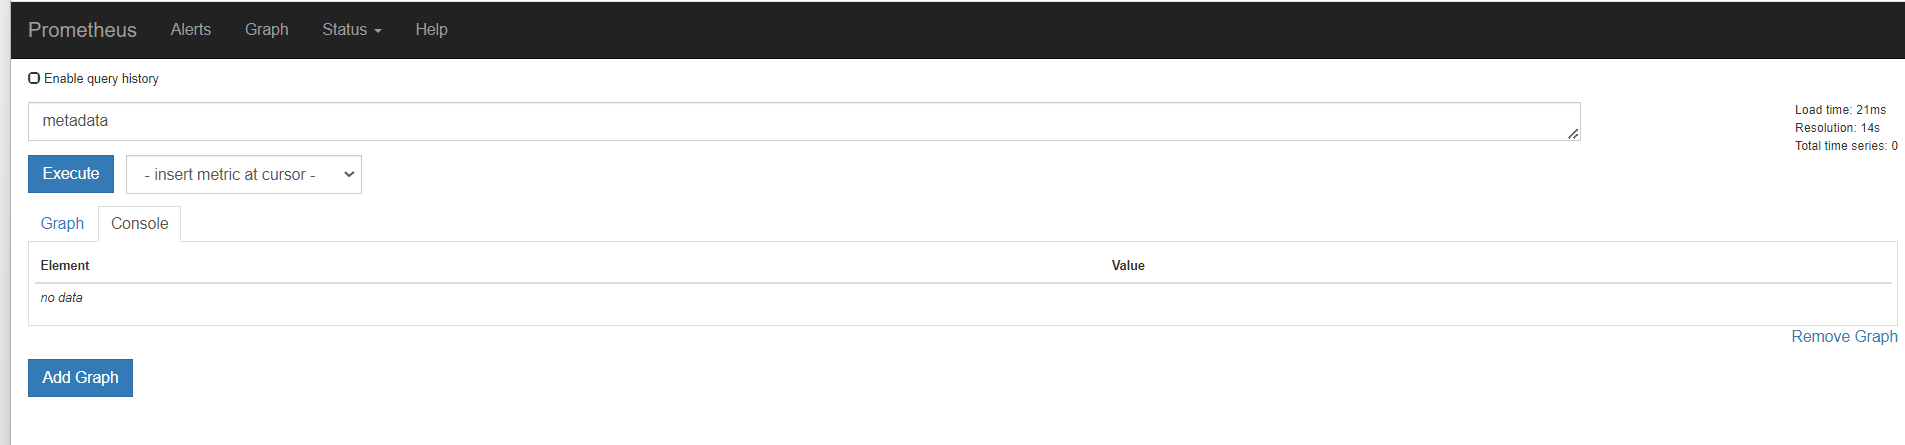
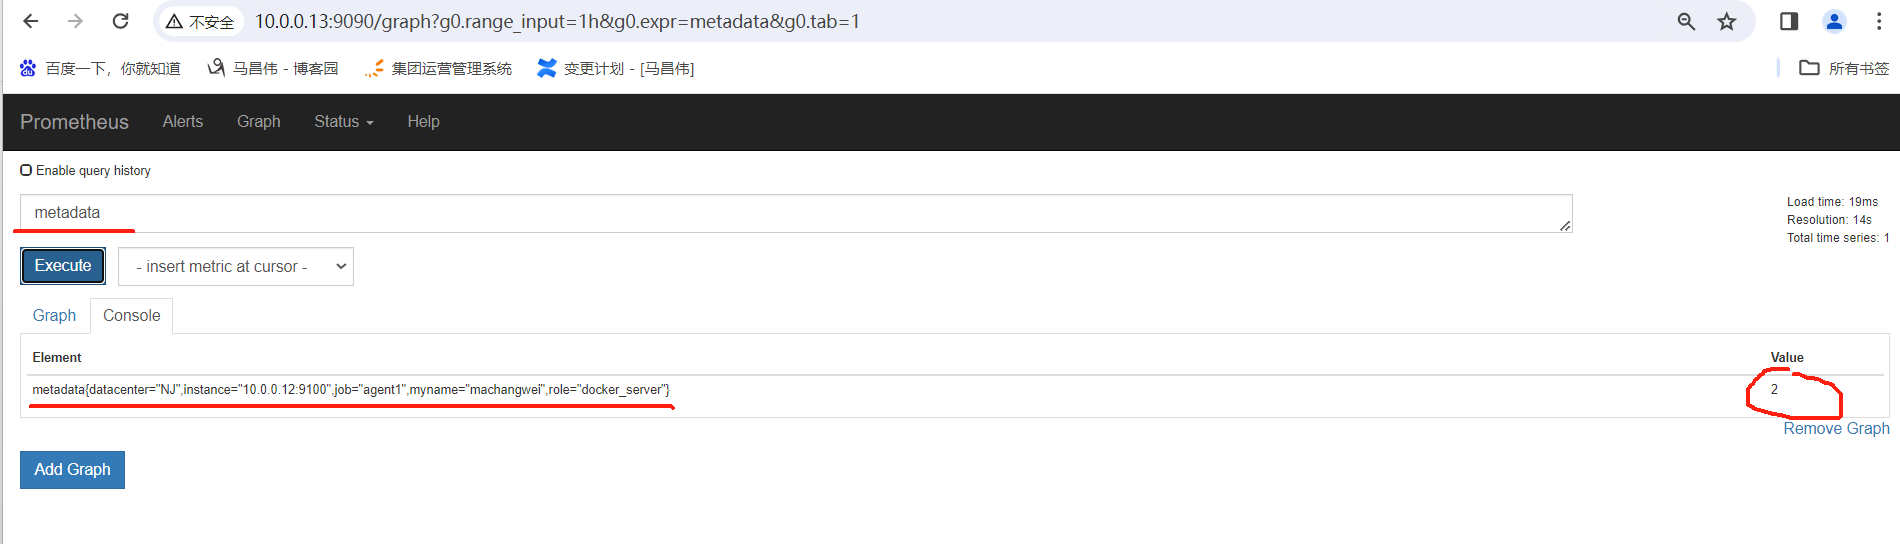
创建目录之后,添加元数据指标。以.prom结尾,花括号里放标签,前面是指标,后面是指标值。指标名称是metadata
[root@mcw02 ~]# mkdir -p /var/lib/node_exporter/textfile_collector
[root@mcw02 ~]# echo 'metadata{role="docker_server",datacenter="NJ",myname="machangwei"}' 2|sudo tee /var/lib/node_exporter/textfile_collector/metaddata.prom
metadata{role="docker_server",datacenter="NJ",myname="machangwei"} 2
[root@mcw02 ~]# cat /var/lib/node_exporter/textfile_collector/metaddata.prom
metadata{role="docker_server",datacenter="NJ",myname="machangwei"} 2
[root@mcw02 ~]#
启动客户端需要指定收集器目录,默认收集器已经开启了
[root@mcw02 ~]# nohup /usr/local/node_exporter/node_exporter  --collector.textfile.directory="/var/lib/node_exporter/textfile_collector/" &
[1] 44569
[root@mcw02 ~]#
客户端已经好了
然后再次搜索,可以看到这个指标,只要有程序实时覆盖该文件中的值,那么就是实时监控数据

启用systemd收集器
启用后,只想收集的服务加入到白名单:
nohup /usr/local/node_exporter/node_exporter --collector.textfile.directory="/var/lib/node_exporter/textfile_collector/" --collector.systemd --collector.systemd.unit-whitelist="(docker|ssh|rsyslog).service" &
[root@mcw02 ~]# nohup /usr/local/node_exporter/node_exporter  --collector.textfile.directory="/var/lib/node_exporter/textfile_collector/" --collector.systemd --collector.system.unit-whitelist="(docker|ssh|rsyslog}.service" &
[1] 48427
[root@mcw02 ~]#
结果报错了
[root@mcw02 ~]# tail nohup.out
time="2024-02-01T01:00:24+08:00" level=info msg=" - timex" source="node_exporter.go:97"
time="2024-02-01T01:00:24+08:00" level=info msg=" - uname" source="node_exporter.go:97"
time="2024-02-01T01:00:24+08:00" level=info msg=" - vmstat" source="node_exporter.go:97"
time="2024-02-01T01:00:24+08:00" level=info msg=" - wifi" source="node_exporter.go:97"
time="2024-02-01T01:00:24+08:00" level=info msg=" - xfs" source="node_exporter.go:97"
time="2024-02-01T01:00:24+08:00" level=info msg=" - zfs" source="node_exporter.go:97"
time="2024-02-01T01:00:24+08:00" level=info msg="Listening on :9100" source="node_exporter.go:111"
node_exporter: error: unknown long flag '--collector.system.unit-whitelist', try --help
node_exporter: error: unknown long flag '--collector.system.unit-whitelist', try --help
node_exporter: error: unknown long flag '--collector.system.unit-whitelist', try --help
[root@mcw02 ~]#
再次尝试启动
[root@mcw02 ~]# nohup /usr/local/node_exporter/node_exporter  --collector.textfile.directory="/var/lib/node_exporter/textfile_collector/" --collector.systemd --collector.systemd.unit-whitelist="(docker|ssh|rsyslog}.service"
nohup: ignoring input and appending output to ‘nohup.out’
[root@mcw02 ~]#
正则有问题吧
time="2024-02-01T08:54:14+08:00" level=info msg="Starting node_exporter (version=0.16.0, branch=HEAD, revision=d42bd70f4363dced6b77d8fc311ea57b63387e4f)" source="node_exporter.go:82"
time="2024-02-01T08:54:14+08:00" level=info msg="Build context (go=go1.9.6, user=root@a67a9bc13a69, date=20180515-15:52:42)" source="node_exporter.go:83"
panic: regexp: Compile(`^(?:(docker|ssh|rsyslog}.service)$`): error parsing regexp: missing closing ): `^(?:(docker|ssh|rsyslog}.service)$`

goroutine 1 [running]:
regexp.MustCompile(0xc42001eed0, 0x22, 0xc42014fb18)
        /usr/local/go/src/regexp/regexp.go:240 +0x171
github.com/prometheus/node_exporter/collector.NewSystemdCollector(0xa1ac40, 0xc42012df80, 0xac973e, 0x7)
        /go/src/github.com/prometheus/node_exporter/collector/systemd_linux.go:69 +0x44c
github.com/prometheus/node_exporter/collector.NewNodeCollector(0x0, 0x0, 0x0, 0xc420147dd0, 0xc4201784b0, 0xc42016b0a0)
        /go/src/github.com/prometheus/node_exporter/collector/collector.go:94 +0x435
main.main()
        /go/src/github.com/prometheus/node_exporter/node_exporter.go:86 +0x622
(END)
这下可以了,花括号问题

正常启动
[root@mcw02 ~]# nohup /usr/local/node_exporter/node_exporter  --collector.textfile.directory="/var/lib/node_exporter/textfile_collector/" --collector.systemd --collector.systemd.unit-whitelist="(docker|ssh|rsyslog).service" &
[1] 48675
[root@mcw02 ~]#
将target合并到一个target里面,作为列表元素
[root@mcw03 prometheus]# grep -A 5 agent /etc/prometheus.yml
  - job_name: 'agent1'
    static_configs:
    - targets: ['10.0.0.14:9100']
    - targets: ['10.0.0.12:9100']
  - job_name: 'promserver'
    static_configs:
[root@mcw03 prometheus]#
[root@mcw03 prometheus]# vim /etc/prometheus.yml
[root@mcw03 prometheus]# grep -A 5 agent /etc/prometheus.yml
  - job_name: 'agent1'
    static_configs:
    - targets: ['10.0.0.14:9100','10.0.0.12:9100']
  - job_name: 'promserver'
    static_configs:
    - targets: ['10.0.0.13:9100']
[root@mcw03 prometheus]# curl -X POST http://localhost:9090/-/reload
[root@mcw03 prometheus]#
正常up
过滤收集器
查看两者启动方式不同
[root@mcw02 ~]# ps -ef|grep -v grep |grep node_exporter
root      48675   1746  0 08:58 pts/0    00:00:00 /usr/local/node_exporter/node_exporter --collector.textfile.directory=/var/lib/node_exporter/textfile_collector/ --collector.systemd --collector.systemd.unit-whitelist=(docker|ssh|rsyslog).service
[root@mcw02 ~]#
[root@mcw04 ~]# ps -ef|grep -v grep |grep node_exporter
root      16003   2129  0 Jan30 pts/0    00:03:13 /usr/local/node_exporter/node_exporter
[root@mcw04 ~]#
添加params。只收集下面的那些
[root@mcw03 prometheus]# grep -A 5 agent /etc/prometheus.yml
  - job_name: 'agent1'
    static_configs:
    - targets: ['10.0.0.14:9100','10.0.0.12:9100']
  - job_name: 'promserver'
    static_configs:
    - targets: ['10.0.0.13:9100']
[root@mcw03 prometheus]# vim /etc/prometheus.yml
[root@mcw03 prometheus]# grep -A 14 agent /etc/prometheus.yml
  - job_name: 'agent1'
    static_configs:
    - targets: ['10.0.0.14:9100','10.0.0.12:9100']
    params:
      collect[]:
        - cpu
        - meminfo
        - diskstats
        - netdev
        - filefd
        - filesystem
        - xfs
        - systemd
  - job_name: 'promserver'
    static_configs:
[root@mcw03 prometheus]# curl -X POST http://localhost:9090/-/reload
[root@mcw03 prometheus]#
启用了systemd的,使用params之后才正常up,么有启动的14节点的报错。并且endpoint下面有标签,收集那些指标
| server returned HTTP status 400 Bad Request |

查看12节点,还是有很多指标
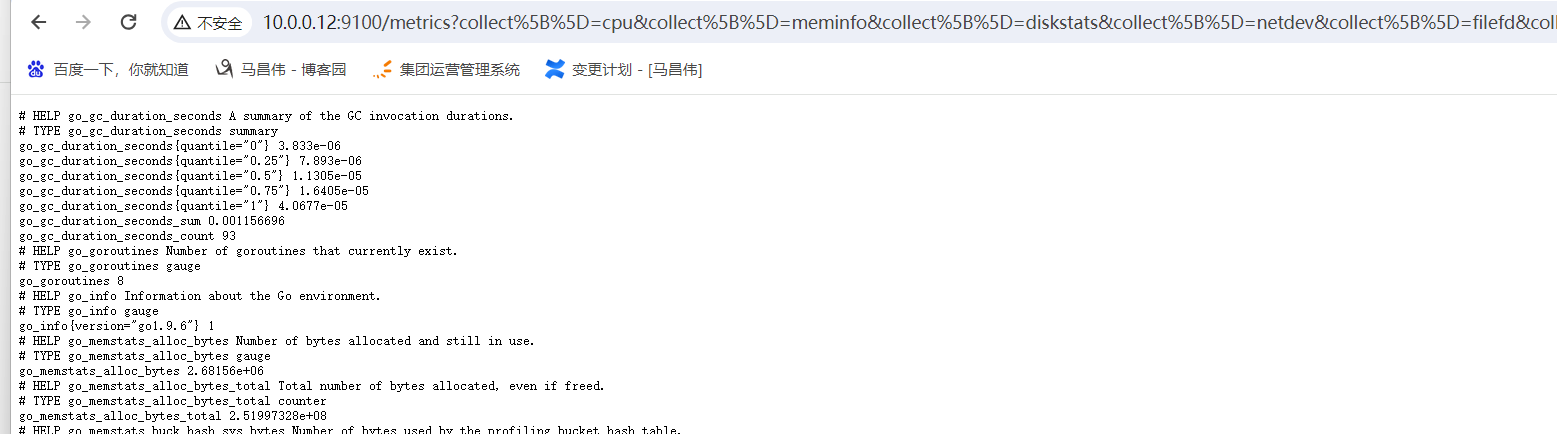


# HELP go_gc_duration_seconds A summary of the GC invocation durations.
# TYPE go_gc_duration_seconds summary
go_gc_duration_seconds{quantile="0"} 3.833e-06
go_gc_duration_seconds{quantile="0.25"} 7.893e-06
go_gc_duration_seconds{quantile="0.5"} 1.1305e-05
go_gc_duration_seconds{quantile="0.75"} 1.6405e-05
go_gc_duration_seconds{quantile="1"} 4.0677e-05
go_gc_duration_seconds_sum 0.001156696
go_gc_duration_seconds_count 93
# HELP go_goroutines Number of goroutines that currently exist.
# TYPE go_goroutines gauge
go_goroutines 8
# HELP go_info Information about the Go environment.
# TYPE go_info gauge
go_info{version="go1.9.6"} 1
# HELP go_memstats_alloc_bytes Number of bytes allocated and still in use.
# TYPE go_memstats_alloc_bytes gauge
go_memstats_alloc_bytes 2.68156e+06
# HELP go_memstats_alloc_bytes_total Total number of bytes allocated, even if freed.
# TYPE go_memstats_alloc_bytes_total counter
go_memstats_alloc_bytes_total 2.51997328e+08
# HELP go_memstats_buck_hash_sys_bytes Number of bytes used by the profiling bucket hash table.
# TYPE go_memstats_buck_hash_sys_bytes gauge
go_memstats_buck_hash_sys_bytes 1.477664e+06
# HELP go_memstats_frees_total Total number of frees.
# TYPE go_memstats_frees_total counter
go_memstats_frees_total 1.882502e+06
# HELP go_memstats_gc_cpu_fraction The fraction of this program's available CPU time used by the GC since the program started.
# TYPE go_memstats_gc_cpu_fraction gauge
go_memstats_gc_cpu_fraction 0.00016678596611586499
# HELP go_memstats_gc_sys_bytes Number of bytes used for garbage collection system metadata.
# TYPE go_memstats_gc_sys_bytes gauge
go_memstats_gc_sys_bytes 462848
# HELP go_memstats_heap_alloc_bytes Number of heap bytes allocated and still in use.
# TYPE go_memstats_heap_alloc_bytes gauge
go_memstats_heap_alloc_bytes 2.68156e+06
# HELP go_memstats_heap_idle_bytes Number of heap bytes waiting to be used.
# TYPE go_memstats_heap_idle_bytes gauge
go_memstats_heap_idle_bytes 3.866624e+06
# HELP go_memstats_heap_inuse_bytes Number of heap bytes that are in use.
# TYPE go_memstats_heap_inuse_bytes gauge
go_memstats_heap_inuse_bytes 3.735552e+06
# HELP go_memstats_heap_objects Number of allocated objects.
# TYPE go_memstats_heap_objects gauge
go_memstats_heap_objects 18119
# HELP go_memstats_heap_released_bytes Number of heap bytes released to OS.
# TYPE go_memstats_heap_released_bytes gauge
go_memstats_heap_released_bytes 0
# HELP go_memstats_heap_sys_bytes Number of heap bytes obtained from system.
# TYPE go_memstats_heap_sys_bytes gauge
go_memstats_heap_sys_bytes 7.602176e+06
# HELP go_memstats_last_gc_time_seconds Number of seconds since 1970 of last garbage collection.
# TYPE go_memstats_last_gc_time_seconds gauge
go_memstats_last_gc_time_seconds 1.7067497371836941e+09
# HELP go_memstats_lookups_total Total number of pointer lookups.
# TYPE go_memstats_lookups_total counter
go_memstats_lookups_total 2795
# HELP go_memstats_mallocs_total Total number of mallocs.
# TYPE go_memstats_mallocs_total counter
go_memstats_mallocs_total 1.900621e+06
# HELP go_memstats_mcache_inuse_bytes Number of bytes in use by mcache structures.
# TYPE go_memstats_mcache_inuse_bytes gauge
go_memstats_mcache_inuse_bytes 1736
# HELP go_memstats_mcache_sys_bytes Number of bytes used for mcache structures obtained from system.
# TYPE go_memstats_mcache_sys_bytes gauge
go_memstats_mcache_sys_bytes 16384
# HELP go_memstats_mspan_inuse_bytes Number of bytes in use by mspan structures.
# TYPE go_memstats_mspan_inuse_bytes gauge
go_memstats_mspan_inuse_bytes 44384
# HELP go_memstats_mspan_sys_bytes Number of bytes used for mspan structures obtained from system.
# TYPE go_memstats_mspan_sys_bytes gauge
go_memstats_mspan_sys_bytes 65536
# HELP go_memstats_next_gc_bytes Number of heap bytes when next garbage collection will take place.
# TYPE go_memstats_next_gc_bytes gauge
go_memstats_next_gc_bytes 4.194304e+06
# HELP go_memstats_other_sys_bytes Number of bytes used for other system allocations.
# TYPE go_memstats_other_sys_bytes gauge
go_memstats_other_sys_bytes 466136
# HELP go_memstats_stack_inuse_bytes Number of bytes in use by the stack allocator.
# TYPE go_memstats_stack_inuse_bytes gauge
go_memstats_stack_inuse_bytes 327680
# HELP go_memstats_stack_sys_bytes Number of bytes obtained from system for stack allocator.
# TYPE go_memstats_stack_sys_bytes gauge
go_memstats_stack_sys_bytes 327680
# HELP go_memstats_sys_bytes Number of bytes obtained from system.
# TYPE go_memstats_sys_bytes gauge
go_memstats_sys_bytes 1.0418424e+07
# HELP go_threads Number of OS threads created.
# TYPE go_threads gauge
go_threads 4
# HELP node_cpu_guest_seconds_total Seconds the cpus spent in guests (VMs) for each mode.
# TYPE node_cpu_guest_seconds_total counter
node_cpu_guest_seconds_total{cpu="0",mode="nice"} 0
node_cpu_guest_seconds_total{cpu="0",mode="user"} 0
# HELP node_cpu_seconds_total Seconds the cpus spent in each mode.
# TYPE node_cpu_seconds_total counter
node_cpu_seconds_total{cpu="0",mode="idle"} 318303.94
node_cpu_seconds_total{cpu="0",mode="iowait"} 160.76
node_cpu_seconds_total{cpu="0",mode="irq"} 0
node_cpu_seconds_total{cpu="0",mode="nice"} 0.09
node_cpu_seconds_total{cpu="0",mode="softirq"} 118.83
node_cpu_seconds_total{cpu="0",mode="steal"} 0
node_cpu_seconds_total{cpu="0",mode="system"} 2119.13
node_cpu_seconds_total{cpu="0",mode="user"} 2840.86
# HELP node_disk_io_now The number of I/Os currently in progress.
# TYPE node_disk_io_now gauge
node_disk_io_now{device="dm-0"} 0
node_disk_io_now{device="dm-1"} 0
node_disk_io_now{device="sda"} 0
node_disk_io_now{device="sr0"} 0
# HELP node_disk_io_time_seconds_total Total seconds spent doing I/Os.
# TYPE node_disk_io_time_seconds_total counter
node_disk_io_time_seconds_total{device="dm-0"} 764.7230000000001
node_disk_io_time_seconds_total{device="dm-1"} 0.325
node_disk_io_time_seconds_total{device="sda"} 764.6610000000001
node_disk_io_time_seconds_total{device="sr0"} 0
# HELP node_disk_io_time_weighted_seconds_total The weighted # of seconds spent doing I/Os. See https://www.kernel.org/doc/Documentation/iostats.txt.
# TYPE node_disk_io_time_weighted_seconds_total counter
node_disk_io_time_weighted_seconds_total{device="dm-0"} 1936.368
node_disk_io_time_weighted_seconds_total{device="dm-1"} 0.325
node_disk_io_time_weighted_seconds_total{device="sda"} 1856.987
node_disk_io_time_weighted_seconds_total{device="sr0"} 0
# HELP node_disk_read_bytes_total The total number of bytes read successfully.
# TYPE node_disk_read_bytes_total counter
node_disk_read_bytes_total{device="dm-0"} 1.756449792e+09
node_disk_read_bytes_total{device="dm-1"} 380928
node_disk_read_bytes_total{device="sda"} 1.790110208e+09
node_disk_read_bytes_total{device="sr0"} 0
# HELP node_disk_read_time_seconds_total The total number of milliseconds spent by all reads.
# TYPE node_disk_read_time_seconds_total counter
node_disk_read_time_seconds_total{device="dm-0"} 1024.198
node_disk_read_time_seconds_total{device="dm-1"} 0.325
node_disk_read_time_seconds_total{device="sda"} 1062.2060000000001
node_disk_read_time_seconds_total{device="sr0"} 0
# HELP node_disk_reads_completed_total The total number of reads completed successfully.
# TYPE node_disk_reads_completed_total counter
node_disk_reads_completed_total{device="dm-0"} 16044
node_disk_reads_completed_total{device="dm-1"} 62
node_disk_reads_completed_total{device="sda"} 18306
node_disk_reads_completed_total{device="sr0"} 0
# HELP node_disk_reads_merged_total The total number of reads merged. See https://www.kernel.org/doc/Documentation/iostats.txt.
# TYPE node_disk_reads_merged_total counter
node_disk_reads_merged_total{device="dm-0"} 0
node_disk_reads_merged_total{device="dm-1"} 0
node_disk_reads_merged_total{device="sda"} 39
node_disk_reads_merged_total{device="sr0"} 0
# HELP node_disk_write_time_seconds_total This is the total number of seconds spent by all writes.
# TYPE node_disk_write_time_seconds_total counter
node_disk_write_time_seconds_total{device="dm-0"} 912.142
node_disk_write_time_seconds_total{device="dm-1"} 0
node_disk_write_time_seconds_total{device="sda"} 809.452
node_disk_write_time_seconds_total{device="sr0"} 0
# HELP node_disk_writes_completed_total The total number of writes completed successfully.
# TYPE node_disk_writes_completed_total counter
node_disk_writes_completed_total{device="dm-0"} 965171
node_disk_writes_completed_total{device="dm-1"} 0
node_disk_writes_completed_total{device="sda"} 873870
node_disk_writes_completed_total{device="sr0"} 0
# HELP node_disk_writes_merged_total The number of writes merged. See https://www.kernel.org/doc/Documentation/iostats.txt.
# TYPE node_disk_writes_merged_total counter
node_disk_writes_merged_total{device="dm-0"} 0
node_disk_writes_merged_total{device="dm-1"} 0
node_disk_writes_merged_total{device="sda"} 91307
node_disk_writes_merged_total{device="sr0"} 0
# HELP node_disk_written_bytes_total The total number of bytes written successfully.
# TYPE node_disk_written_bytes_total counter
node_disk_written_bytes_total{device="dm-0"} 3.3735647744e+10
node_disk_written_bytes_total{device="dm-1"} 0
node_disk_written_bytes_total{device="sda"} 3.3737777664e+10
node_disk_written_bytes_total{device="sr0"} 0
# HELP node_exporter_build_info A metric with a constant '1' value labeled by version, revision, branch, and goversion from which node_exporter was built.
# TYPE node_exporter_build_info gauge
node_exporter_build_info{branch="HEAD",goversion="go1.9.6",revision="d42bd70f4363dced6b77d8fc311ea57b63387e4f",version="0.16.0"} 1
# HELP node_filefd_allocated File descriptor statistics: allocated.
# TYPE node_filefd_allocated gauge
node_filefd_allocated 3552
# HELP node_filefd_maximum File descriptor statistics: maximum.
# TYPE node_filefd_maximum gauge
node_filefd_maximum 2e+06
# HELP node_filesystem_avail_bytes Filesystem space available to non-root users in bytes.
# TYPE node_filesystem_avail_bytes gauge
node_filesystem_avail_bytes{device="/dev/mapper/centos-root",fstype="xfs",mountpoint="/"} 9.521995776e+09
node_filesystem_avail_bytes{device="/dev/sda1",fstype="xfs",mountpoint="/boot"} 9.13555456e+08
node_filesystem_avail_bytes{device="rootfs",fstype="rootfs",mountpoint="/"} 9.521995776e+09
node_filesystem_avail_bytes{device="tmpfs",fstype="tmpfs",mountpoint="/run"} 1.969913856e+09
node_filesystem_avail_bytes{device="tmpfs",fstype="tmpfs",mountpoint="/run/user/0"} 3.95804672e+08
# HELP node_filesystem_device_error Whether an error occurred while getting statistics for the given device.
# TYPE node_filesystem_device_error gauge
node_filesystem_device_error{device="/dev/mapper/centos-root",fstype="xfs",mountpoint="/"} 0
node_filesystem_device_error{device="/dev/sda1",fstype="xfs",mountpoint="/boot"} 0
node_filesystem_device_error{device="rootfs",fstype="rootfs",mountpoint="/"} 0
node_filesystem_device_error{device="tmpfs",fstype="tmpfs",mountpoint="/run"} 0
node_filesystem_device_error{device="tmpfs",fstype="tmpfs",mountpoint="/run/user/0"} 0
# HELP node_filesystem_files Filesystem total file nodes.
# TYPE node_filesystem_files gauge
node_filesystem_files{device="/dev/mapper/centos-root",fstype="xfs",mountpoint="/"} 9.957376e+06
node_filesystem_files{device="/dev/sda1",fstype="xfs",mountpoint="/boot"} 524288
node_filesystem_files{device="rootfs",fstype="rootfs",mountpoint="/"} 9.957376e+06
node_filesystem_files{device="tmpfs",fstype="tmpfs",mountpoint="/run"} 483160
node_filesystem_files{device="tmpfs",fstype="tmpfs",mountpoint="/run/user/0"} 483160
# HELP node_filesystem_files_free Filesystem total free file nodes.
# TYPE node_filesystem_files_free gauge
node_filesystem_files_free{device="/dev/mapper/centos-root",fstype="xfs",mountpoint="/"} 9.660103e+06
node_filesystem_files_free{device="/dev/sda1",fstype="xfs",mountpoint="/boot"} 523960
node_filesystem_files_free{device="rootfs",fstype="rootfs",mountpoint="/"} 9.660103e+06
node_filesystem_files_free{device="tmpfs",fstype="tmpfs",mountpoint="/run"} 482605
node_filesystem_files_free{device="tmpfs",fstype="tmpfs",mountpoint="/run/user/0"} 483159
# HELP node_filesystem_free_bytes Filesystem free space in bytes.
# TYPE node_filesystem_free_bytes gauge
node_filesystem_free_bytes{device="/dev/mapper/centos-root",fstype="xfs",mountpoint="/"} 9.521995776e+09
node_filesystem_free_bytes{device="/dev/sda1",fstype="xfs",mountpoint="/boot"} 9.13555456e+08
node_filesystem_free_bytes{device="rootfs",fstype="rootfs",mountpoint="/"} 9.521995776e+09
node_filesystem_free_bytes{device="tmpfs",fstype="tmpfs",mountpoint="/run"} 1.969913856e+09
node_filesystem_free_bytes{device="tmpfs",fstype="tmpfs",mountpoint="/run/user/0"} 3.95804672e+08
# HELP node_filesystem_readonly Filesystem read-only status.
# TYPE node_filesystem_readonly gauge
node_filesystem_readonly{device="/dev/mapper/centos-root",fstype="xfs",mountpoint="/"} 0
node_filesystem_readonly{device="/dev/sda1",fstype="xfs",mountpoint="/boot"} 0
node_filesystem_readonly{device="rootfs",fstype="rootfs",mountpoint="/"} 0
node_filesystem_readonly{device="tmpfs",fstype="tmpfs",mountpoint="/run"} 0
node_filesystem_readonly{device="tmpfs",fstype="tmpfs",mountpoint="/run/user/0"} 0
# HELP node_filesystem_size_bytes Filesystem size in bytes.
# TYPE node_filesystem_size_bytes gauge
node_filesystem_size_bytes{device="/dev/mapper/centos-root",fstype="xfs",mountpoint="/"} 2.0382220288e+10
node_filesystem_size_bytes{device="/dev/sda1",fstype="xfs",mountpoint="/boot"} 1.063256064e+09
node_filesystem_size_bytes{device="rootfs",fstype="rootfs",mountpoint="/"} 2.0382220288e+10
node_filesystem_size_bytes{device="tmpfs",fstype="tmpfs",mountpoint="/run"} 1.97902336e+09
node_filesystem_size_bytes{device="tmpfs",fstype="tmpfs",mountpoint="/run/user/0"} 3.95804672e+08
# HELP node_memory_Active_anon_bytes Memory information field Active_anon_bytes.
# TYPE node_memory_Active_anon_bytes gauge
node_memory_Active_anon_bytes 1.359429632e+09
# HELP node_memory_Active_bytes Memory information field Active_bytes.
# TYPE node_memory_Active_bytes gauge
node_memory_Active_bytes 2.195337216e+09
# HELP node_memory_Active_file_bytes Memory information field Active_file_bytes.
# TYPE node_memory_Active_file_bytes gauge
node_memory_Active_file_bytes 8.35907584e+08
# HELP node_memory_AnonHugePages_bytes Memory information field AnonHugePages_bytes.
# TYPE node_memory_AnonHugePages_bytes gauge
node_memory_AnonHugePages_bytes 1.430257664e+09
# HELP node_memory_AnonPages_bytes Memory information field AnonPages_bytes.
# TYPE node_memory_AnonPages_bytes gauge
node_memory_AnonPages_bytes 1.69039872e+09
# HELP node_memory_Bounce_bytes Memory information field Bounce_bytes.
# TYPE node_memory_Bounce_bytes gauge
node_memory_Bounce_bytes 0
# HELP node_memory_Buffers_bytes Memory information field Buffers_bytes.
# TYPE node_memory_Buffers_bytes gauge
node_memory_Buffers_bytes 73728
# HELP node_memory_Cached_bytes Memory information field Cached_bytes.
# TYPE node_memory_Cached_bytes gauge
node_memory_Cached_bytes 1.669480448e+09
# HELP node_memory_CommitLimit_bytes Memory information field CommitLimit_bytes.
# TYPE node_memory_CommitLimit_bytes gauge
node_memory_CommitLimit_bytes 1.983213568e+09
# HELP node_memory_Committed_AS_bytes Memory information field Committed_AS_bytes.
# TYPE node_memory_Committed_AS_bytes gauge
node_memory_Committed_AS_bytes 2.837794816e+09
# HELP node_memory_DirectMap1G_bytes Memory information field DirectMap1G_bytes.
# TYPE node_memory_DirectMap1G_bytes gauge
node_memory_DirectMap1G_bytes 2.147483648e+09
# HELP node_memory_DirectMap2M_bytes Memory information field DirectMap2M_bytes.
# TYPE node_memory_DirectMap2M_bytes gauge
node_memory_DirectMap2M_bytes 4.211081216e+09
# HELP node_memory_DirectMap4k_bytes Memory information field DirectMap4k_bytes.
# TYPE node_memory_DirectMap4k_bytes gauge
node_memory_DirectMap4k_bytes 8.3689472e+07
# HELP node_memory_Dirty_bytes Memory information field Dirty_bytes.
# TYPE node_memory_Dirty_bytes gauge
node_memory_Dirty_bytes 4.374528e+06
# HELP node_memory_HardwareCorrupted_bytes Memory information field HardwareCorrupted_bytes.
# TYPE node_memory_HardwareCorrupted_bytes gauge
node_memory_HardwareCorrupted_bytes 0
# HELP node_memory_HugePages_Free Memory information field HugePages_Free.
# TYPE node_memory_HugePages_Free gauge
node_memory_HugePages_Free 0
# HELP node_memory_HugePages_Rsvd Memory information field HugePages_Rsvd.
# TYPE node_memory_HugePages_Rsvd gauge
node_memory_HugePages_Rsvd 0
# HELP node_memory_HugePages_Surp Memory information field HugePages_Surp.
# TYPE node_memory_HugePages_Surp gauge
node_memory_HugePages_Surp 0
# HELP node_memory_HugePages_Total Memory information field HugePages_Total.
# TYPE node_memory_HugePages_Total gauge
node_memory_HugePages_Total 0
# HELP node_memory_Hugepagesize_bytes Memory information field Hugepagesize_bytes.
# TYPE node_memory_Hugepagesize_bytes gauge
node_memory_Hugepagesize_bytes 2.097152e+06
# HELP node_memory_Inactive_anon_bytes Memory information field Inactive_anon_bytes.
# TYPE node_memory_Inactive_anon_bytes gauge
node_memory_Inactive_anon_bytes 3.40914176e+08
# HELP node_memory_Inactive_bytes Memory information field Inactive_bytes.
# TYPE node_memory_Inactive_bytes gauge
node_memory_Inactive_bytes 1.164660736e+09
# HELP node_memory_Inactive_file_bytes Memory information field Inactive_file_bytes.
# TYPE node_memory_Inactive_file_bytes gauge
node_memory_Inactive_file_bytes 8.2374656e+08
# HELP node_memory_KernelStack_bytes Memory information field KernelStack_bytes.
# TYPE node_memory_KernelStack_bytes gauge
node_memory_KernelStack_bytes 6.995968e+06
# HELP node_memory_Mapped_bytes Memory information field Mapped_bytes.
# TYPE node_memory_Mapped_bytes gauge
node_memory_Mapped_bytes 9.2192768e+07
# HELP node_memory_MemAvailable_bytes Memory information field MemAvailable_bytes.
# TYPE node_memory_MemAvailable_bytes gauge
node_memory_MemAvailable_bytes 1.817350144e+09
# HELP node_memory_MemFree_bytes Memory information field MemFree_bytes.
# TYPE node_memory_MemFree_bytes gauge
node_memory_MemFree_bytes 1.1429888e+08
# HELP node_memory_MemTotal_bytes Memory information field MemTotal_bytes.
# TYPE node_memory_MemTotal_bytes gauge
node_memory_MemTotal_bytes 3.95804672e+09
# HELP node_memory_Mlocked_bytes Memory information field Mlocked_bytes.
# TYPE node_memory_Mlocked_bytes gauge
node_memory_Mlocked_bytes 0
# HELP node_memory_NFS_Unstable_bytes Memory information field NFS_Unstable_bytes.
# TYPE node_memory_NFS_Unstable_bytes gauge
node_memory_NFS_Unstable_bytes 0
# HELP node_memory_PageTables_bytes Memory information field PageTables_bytes.
# TYPE node_memory_PageTables_bytes gauge
node_memory_PageTables_bytes 1.6457728e+07
# HELP node_memory_SReclaimable_bytes Memory information field SReclaimable_bytes.
# TYPE node_memory_SReclaimable_bytes gauge
node_memory_SReclaimable_bytes 3.39439616e+08
# HELP node_memory_SUnreclaim_bytes Memory information field SUnreclaim_bytes.
# TYPE node_memory_SUnreclaim_bytes gauge
node_memory_SUnreclaim_bytes 3.7535744e+07
# HELP node_memory_Shmem_bytes Memory information field Shmem_bytes.
# TYPE node_memory_Shmem_bytes gauge
node_memory_Shmem_bytes 9.945088e+06
# HELP node_memory_Slab_bytes Memory information field Slab_bytes.
# TYPE node_memory_Slab_bytes gauge
node_memory_Slab_bytes 3.7697536e+08
# HELP node_memory_SwapCached_bytes Memory information field SwapCached_bytes.
# TYPE node_memory_SwapCached_bytes gauge
node_memory_SwapCached_bytes 0
# HELP node_memory_SwapFree_bytes Memory information field SwapFree_bytes.
# TYPE node_memory_SwapFree_bytes gauge
node_memory_SwapFree_bytes 4.190208e+06
# HELP node_memory_SwapTotal_bytes Memory information field SwapTotal_bytes.
# TYPE node_memory_SwapTotal_bytes gauge
node_memory_SwapTotal_bytes 4.190208e+06
# HELP node_memory_Unevictable_bytes Memory information field Unevictable_bytes.
# TYPE node_memory_Unevictable_bytes gauge
node_memory_Unevictable_bytes 0
# HELP node_memory_VmallocChunk_bytes Memory information field VmallocChunk_bytes.
# TYPE node_memory_VmallocChunk_bytes gauge
node_memory_VmallocChunk_bytes 3.5183933779968e+13
# HELP node_memory_VmallocTotal_bytes Memory information field VmallocTotal_bytes.
# TYPE node_memory_VmallocTotal_bytes gauge
node_memory_VmallocTotal_bytes 3.5184372087808e+13
# HELP node_memory_VmallocUsed_bytes Memory information field VmallocUsed_bytes.
# TYPE node_memory_VmallocUsed_bytes gauge
node_memory_VmallocUsed_bytes 1.88870656e+08
# HELP node_memory_WritebackTmp_bytes Memory information field WritebackTmp_bytes.
# TYPE node_memory_WritebackTmp_bytes gauge
node_memory_WritebackTmp_bytes 0
# HELP node_memory_Writeback_bytes Memory information field Writeback_bytes.
# TYPE node_memory_Writeback_bytes gauge
node_memory_Writeback_bytes 0
# HELP node_network_receive_bytes_total Network device statistic receive_bytes.
# TYPE node_network_receive_bytes_total counter
node_network_receive_bytes_total{device="ens33"} 3.773615896e+09
node_network_receive_bytes_total{device="ens34"} 0
node_network_receive_bytes_total{device="lo"} 2.9276118e+07
# HELP node_network_receive_compressed_total Network device statistic receive_compressed.
# TYPE node_network_receive_compressed_total counter
node_network_receive_compressed_total{device="ens33"} 0
node_network_receive_compressed_total{device="ens34"} 0
node_network_receive_compressed_total{device="lo"} 0
# HELP node_network_receive_drop_total Network device statistic receive_drop.
# TYPE node_network_receive_drop_total counter
node_network_receive_drop_total{device="ens33"} 0
node_network_receive_drop_total{device="ens34"} 0
node_network_receive_drop_total{device="lo"} 0
# HELP node_network_receive_errs_total Network device statistic receive_errs.
# TYPE node_network_receive_errs_total counter
node_network_receive_errs_total{device="ens33"} 0
node_network_receive_errs_total{device="ens34"} 0
node_network_receive_errs_total{device="lo"} 0
# HELP node_network_receive_fifo_total Network device statistic receive_fifo.
# TYPE node_network_receive_fifo_total counter
node_network_receive_fifo_total{device="ens33"} 0
node_network_receive_fifo_total{device="ens34"} 0
node_network_receive_fifo_total{device="lo"} 0
# HELP node_network_receive_frame_total Network device statistic receive_frame.
# TYPE node_network_receive_frame_total counter
node_network_receive_frame_total{device="ens33"} 0
node_network_receive_frame_total{device="ens34"} 0
node_network_receive_frame_total{device="lo"} 0
# HELP node_network_receive_multicast_total Network device statistic receive_multicast.
# TYPE node_network_receive_multicast_total counter
node_network_receive_multicast_total{device="ens33"} 0
node_network_receive_multicast_total{device="ens34"} 0
node_network_receive_multicast_total{device="lo"} 0
# HELP node_network_receive_packets_total Network device statistic receive_packets.
# TYPE node_network_receive_packets_total counter
node_network_receive_packets_total{device="ens33"} 7.692141e+06
node_network_receive_packets_total{device="ens34"} 0
node_network_receive_packets_total{device="lo"} 490855
# HELP node_network_transmit_bytes_total Network device statistic transmit_bytes.
# TYPE node_network_transmit_bytes_total counter
node_network_transmit_bytes_total{device="ens33"} 1.079574901e+09
node_network_transmit_bytes_total{device="ens34"} 0
node_network_transmit_bytes_total{device="lo"} 2.9276118e+07
# HELP node_network_transmit_carrier_total Network device statistic transmit_carrier.
# TYPE node_network_transmit_carrier_total counter
node_network_transmit_carrier_total{device="ens33"} 0
node_network_transmit_carrier_total{device="ens34"} 0
node_network_transmit_carrier_total{device="lo"} 0
# HELP node_network_transmit_colls_total Network device statistic transmit_colls.
# TYPE node_network_transmit_colls_total counter
node_network_transmit_colls_total{device="ens33"} 0
node_network_transmit_colls_total{device="ens34"} 0
node_network_transmit_colls_total{device="lo"} 0
# HELP node_network_transmit_compressed_total Network device statistic transmit_compressed.
# TYPE node_network_transmit_compressed_total counter
node_network_transmit_compressed_total{device="ens33"} 0
node_network_transmit_compressed_total{device="ens34"} 0
node_network_transmit_compressed_total{device="lo"} 0
# HELP node_network_transmit_drop_total Network device statistic transmit_drop.
# TYPE node_network_transmit_drop_total counter
node_network_transmit_drop_total{device="ens33"} 0
node_network_transmit_drop_total{device="ens34"} 0
node_network_transmit_drop_total{device="lo"} 0
# HELP node_network_transmit_errs_total Network device statistic transmit_errs.
# TYPE node_network_transmit_errs_total counter
node_network_transmit_errs_total{device="ens33"} 0
node_network_transmit_errs_total{device="ens34"} 0
node_network_transmit_errs_total{device="lo"} 0
# HELP node_network_transmit_fifo_total Network device statistic transmit_fifo.
# TYPE node_network_transmit_fifo_total counter
node_network_transmit_fifo_total{device="ens33"} 0
node_network_transmit_fifo_total{device="ens34"} 0
node_network_transmit_fifo_total{device="lo"} 0
# HELP node_network_transmit_packets_total Network device statistic transmit_packets.
# TYPE node_network_transmit_packets_total counter
node_network_transmit_packets_total{device="ens33"} 5.880282e+06
node_network_transmit_packets_total{device="ens34"} 0
node_network_transmit_packets_total{device="lo"} 490855
# HELP node_scrape_collector_duration_seconds node_exporter: Duration of a collector scrape.
# TYPE node_scrape_collector_duration_seconds gauge
node_scrape_collector_duration_seconds{collector="cpu"} 0.00022418
node_scrape_collector_duration_seconds{collector="diskstats"} 0.000150278
node_scrape_collector_duration_seconds{collector="filefd"} 2.0333e-05
node_scrape_collector_duration_seconds{collector="filesystem"} 0.000141861
node_scrape_collector_duration_seconds{collector="meminfo"} 9.9877e-05
node_scrape_collector_duration_seconds{collector="netdev"} 9.8296e-05
node_scrape_collector_duration_seconds{collector="systemd"} 0.008461932
node_scrape_collector_duration_seconds{collector="xfs"} 0.000365428
# HELP node_scrape_collector_success node_exporter: Whether a collector succeeded.
# TYPE node_scrape_collector_success gauge
node_scrape_collector_success{collector="cpu"} 1
node_scrape_collector_success{collector="diskstats"} 1
node_scrape_collector_success{collector="filefd"} 1
node_scrape_collector_success{collector="filesystem"} 1
node_scrape_collector_success{collector="meminfo"} 1
node_scrape_collector_success{collector="netdev"} 1
node_scrape_collector_success{collector="systemd"} 1
node_scrape_collector_success{collector="xfs"} 1
# HELP node_systemd_system_running Whether the system is operational (see 'systemctl is-system-running')
# TYPE node_systemd_system_running gauge
node_systemd_system_running 1
# HELP node_systemd_unit_state Systemd unit
# TYPE node_systemd_unit_state gauge
node_systemd_unit_state{name="rsyslog.service",state="activating"} 0
node_systemd_unit_state{name="rsyslog.service",state="active"} 1
node_systemd_unit_state{name="rsyslog.service",state="deactivating"} 0
node_systemd_unit_state{name="rsyslog.service",state="failed"} 0
node_systemd_unit_state{name="rsyslog.service",state="inactive"} 0
# HELP node_systemd_units Summary of systemd unit states
# TYPE node_systemd_units gauge
node_systemd_units{state="activating"} 0
node_systemd_units{state="active"} 154
node_systemd_units{state="deactivating"} 0
node_systemd_units{state="failed"} 0
node_systemd_units{state="inactive"} 74
# HELP node_xfs_allocation_btree_compares_total Number of allocation B-tree compares for a filesystem.
# TYPE node_xfs_allocation_btree_compares_total counter
node_xfs_allocation_btree_compares_total{device="dm-0"} 0
node_xfs_allocation_btree_compares_total{device="sda1"} 0
# HELP node_xfs_allocation_btree_lookups_total Number of allocation B-tree lookups for a filesystem.
# TYPE node_xfs_allocation_btree_lookups_total counter
node_xfs_allocation_btree_lookups_total{device="dm-0"} 0
node_xfs_allocation_btree_lookups_total{device="sda1"} 0
# HELP node_xfs_allocation_btree_records_deleted_total Number of allocation B-tree records deleted for a filesystem.
# TYPE node_xfs_allocation_btree_records_deleted_total counter
node_xfs_allocation_btree_records_deleted_total{device="dm-0"} 0
node_xfs_allocation_btree_records_deleted_total{device="sda1"} 0
# HELP node_xfs_allocation_btree_records_inserted_total Number of allocation B-tree records inserted for a filesystem.
# TYPE node_xfs_allocation_btree_records_inserted_total counter
node_xfs_allocation_btree_records_inserted_total{device="dm-0"} 0
node_xfs_allocation_btree_records_inserted_total{device="sda1"} 0
# HELP node_xfs_block_map_btree_compares_total Number of block map B-tree compares for a filesystem.
# TYPE node_xfs_block_map_btree_compares_total counter
node_xfs_block_map_btree_compares_total{device="dm-0"} 0
node_xfs_block_map_btree_compares_total{device="sda1"} 0
# HELP node_xfs_block_map_btree_lookups_total Number of block map B-tree lookups for a filesystem.
# TYPE node_xfs_block_map_btree_lookups_total counter
node_xfs_block_map_btree_lookups_total{device="dm-0"} 0
node_xfs_block_map_btree_lookups_total{device="sda1"} 0
# HELP node_xfs_block_map_btree_records_deleted_total Number of block map B-tree records deleted for a filesystem.
# TYPE node_xfs_block_map_btree_records_deleted_total counter
node_xfs_block_map_btree_records_deleted_total{device="dm-0"} 0
node_xfs_block_map_btree_records_deleted_total{device="sda1"} 0
# HELP node_xfs_block_map_btree_records_inserted_total Number of block map B-tree records inserted for a filesystem.
# TYPE node_xfs_block_map_btree_records_inserted_total counter
node_xfs_block_map_btree_records_inserted_total{device="dm-0"} 0
node_xfs_block_map_btree_records_inserted_total{device="sda1"} 0
# HELP node_xfs_block_mapping_extent_list_compares_total Number of extent list compares for a filesystem.
# TYPE node_xfs_block_mapping_extent_list_compares_total counter
node_xfs_block_mapping_extent_list_compares_total{device="dm-0"} 0
node_xfs_block_mapping_extent_list_compares_total{device="sda1"} 0
# HELP node_xfs_block_mapping_extent_list_deletions_total Number of extent list deletions for a filesystem.
# TYPE node_xfs_block_mapping_extent_list_deletions_total counter
node_xfs_block_mapping_extent_list_deletions_total{device="dm-0"} 1.988396e+06
node_xfs_block_mapping_extent_list_deletions_total{device="sda1"} 0
# HELP node_xfs_block_mapping_extent_list_insertions_total Number of extent list insertions for a filesystem.
# TYPE node_xfs_block_mapping_extent_list_insertions_total counter
node_xfs_block_mapping_extent_list_insertions_total{device="dm-0"} 191678
node_xfs_block_mapping_extent_list_insertions_total{device="sda1"} 0
# HELP node_xfs_block_mapping_extent_list_lookups_total Number of extent list lookups for a filesystem.
# TYPE node_xfs_block_mapping_extent_list_lookups_total counter
node_xfs_block_mapping_extent_list_lookups_total{device="dm-0"} 4.843281e+07
node_xfs_block_mapping_extent_list_lookups_total{device="sda1"} 164
# HELP node_xfs_block_mapping_reads_total Number of block map for read operations for a filesystem.
# TYPE node_xfs_block_mapping_reads_total counter
node_xfs_block_mapping_reads_total{device="dm-0"} 3.2221106e+07
node_xfs_block_mapping_reads_total{device="sda1"} 164
# HELP node_xfs_block_mapping_unmaps_total Number of block unmaps (deletes) for a filesystem.
# TYPE node_xfs_block_mapping_unmaps_total counter
node_xfs_block_mapping_unmaps_total{device="dm-0"} 3.77095e+06
node_xfs_block_mapping_unmaps_total{device="sda1"} 0
# HELP node_xfs_block_mapping_writes_total Number of block map for write operations for a filesystem.
# TYPE node_xfs_block_mapping_writes_total counter
node_xfs_block_mapping_writes_total{device="dm-0"} 1.2439528e+07
node_xfs_block_mapping_writes_total{device="sda1"} 0
# HELP node_xfs_extent_allocation_blocks_allocated_total Number of blocks allocated for a filesystem.
# TYPE node_xfs_extent_allocation_blocks_allocated_total counter
node_xfs_extent_allocation_blocks_allocated_total{device="dm-0"} 8.194099e+06
node_xfs_extent_allocation_blocks_allocated_total{device="sda1"} 0
# HELP node_xfs_extent_allocation_blocks_freed_total Number of blocks freed for a filesystem.
# TYPE node_xfs_extent_allocation_blocks_freed_total counter
node_xfs_extent_allocation_blocks_freed_total{device="dm-0"} 8.042035e+06
node_xfs_extent_allocation_blocks_freed_total{device="sda1"} 0
# HELP node_xfs_extent_allocation_extents_allocated_total Number of extents allocated for a filesystem.
# TYPE node_xfs_extent_allocation_extents_allocated_total counter
node_xfs_extent_allocation_extents_allocated_total{device="dm-0"} 191698
node_xfs_extent_allocation_extents_allocated_total{device="sda1"} 0
# HELP node_xfs_extent_allocation_extents_freed_total Number of extents freed for a filesystem.
# TYPE node_xfs_extent_allocation_extents_freed_total counter
node_xfs_extent_allocation_extents_freed_total{device="dm-0"} 191572
node_xfs_extent_allocation_extents_freed_total{device="sda1"} 0
# HELP process_cpu_seconds_total Total user and system CPU time spent in seconds.
# TYPE process_cpu_seconds_total counter
process_cpu_seconds_total 0.75
# HELP process_max_fds Maximum number of open file descriptors.
# TYPE process_max_fds gauge
process_max_fds 65535
# HELP process_open_fds Number of open file descriptors.
# TYPE process_open_fds gauge
process_open_fds 9
# HELP process_resident_memory_bytes Resident memory size in bytes.
# TYPE process_resident_memory_bytes gauge
process_resident_memory_bytes 1.3766656e+07
# HELP process_start_time_seconds Start time of the process since unix epoch in seconds.
# TYPE process_start_time_seconds gauge
process_start_time_seconds 1.70674908932e+09
# HELP process_virtual_memory_bytes Virtual memory size in bytes.
# TYPE process_virtual_memory_bytes gauge
process_virtual_memory_bytes 3.8486016e+07
# HELP promhttp_metric_handler_requests_in_flight Current number of scrapes being served.
# TYPE promhttp_metric_handler_requests_in_flight gauge
promhttp_metric_handler_requests_in_flight 1
# HELP promhttp_metric_handler_requests_total Total number of scrapes by HTTP status code.
# TYPE promhttp_metric_handler_requests_total counter
promhttp_metric_handler_requests_total{code="200"} 0
promhttp_metric_handler_requests_total{code="500"} 0
promhttp_metric_handler_requests_total{code="503"} 0
开启只收集cpu的,
[root@mcw03 prometheus]# vim /etc/prometheus.yml
[root@mcw03 prometheus]# grep -A 14 agent /etc/prometheus.yml
  - job_name: 'agent1'
    static_configs:
    - targets: ['10.0.0.14:9100','10.0.0.12:9100']
    params:
      collect[]:
        - cpu
        - meminfo
        - diskstats
        - netdev
        - filefd
        - filesystem
        - xfs
        - systemd
  - job_name: 'promserver'
    static_configs:
[root@mcw03 prometheus]# vim /etc/prometheus.yml
[root@mcw03 prometheus]# grep -A 7 agent /etc/prometheus.yml
  - job_name: 'agent1'
    static_configs:
    - targets: ['10.0.0.14:9100','10.0.0.12:9100']
    params:
      collect[]:
        - cpu
  - job_name: 'promserver'
    static_configs:
[root@mcw03 prometheus]# curl -X POST http://localhost:9090/-/reload
[root@mcw03 prometheus]#
指标变少了很多,不过好像不只有cpu的,不过大部分都是
# HELP go_gc_duration_seconds A summary of the GC invocation durations.
# TYPE go_gc_duration_seconds summary
go_gc_duration_seconds{quantile="0"} 3.723e-06
go_gc_duration_seconds{quantile="0.25"} 7.176e-06
go_gc_duration_seconds{quantile="0.5"} 1.0807e-05
go_gc_duration_seconds{quantile="0.75"} 1.61e-05
go_gc_duration_seconds{quantile="1"} 4.0677e-05
go_gc_duration_seconds_sum 0.001449453
go_gc_duration_seconds_count 120
# HELP go_goroutines Number of goroutines that currently exist.
# TYPE go_goroutines gauge
go_goroutines 8
# HELP go_info Information about the Go environment.
# TYPE go_info gauge
go_info{version="go1.9.6"} 1
# HELP go_memstats_alloc_bytes Number of bytes allocated and still in use.
# TYPE go_memstats_alloc_bytes gauge
go_memstats_alloc_bytes 3.018344e+06
# HELP go_memstats_alloc_bytes_total Total number of bytes allocated, even if freed.
# TYPE go_memstats_alloc_bytes_total counter
go_memstats_alloc_bytes_total 3.24942824e+08
# HELP go_memstats_buck_hash_sys_bytes Number of bytes used by the profiling bucket hash table.
# TYPE go_memstats_buck_hash_sys_bytes gauge
go_memstats_buck_hash_sys_bytes 1.485336e+06
# HELP go_memstats_frees_total Total number of frees.
# TYPE go_memstats_frees_total counter
go_memstats_frees_total 2.415574e+06
# HELP go_memstats_gc_cpu_fraction The fraction of this program's available CPU time used by the GC since the program started.
# TYPE go_memstats_gc_cpu_fraction gauge
go_memstats_gc_cpu_fraction 0.00015807999406808746
# HELP go_memstats_gc_sys_bytes Number of bytes used for garbage collection system metadata.
# TYPE go_memstats_gc_sys_bytes gauge
go_memstats_gc_sys_bytes 495616
# HELP go_memstats_heap_alloc_bytes Number of heap bytes allocated and still in use.
# TYPE go_memstats_heap_alloc_bytes gauge
go_memstats_heap_alloc_bytes 3.018344e+06
# HELP go_memstats_heap_idle_bytes Number of heap bytes waiting to be used.
# TYPE go_memstats_heap_idle_bytes gauge
go_memstats_heap_idle_bytes 3.637248e+06
# HELP go_memstats_heap_inuse_bytes Number of heap bytes that are in use.
# TYPE go_memstats_heap_inuse_bytes gauge
go_memstats_heap_inuse_bytes 3.93216e+06
# HELP go_memstats_heap_objects Number of allocated objects.
# TYPE go_memstats_heap_objects gauge
go_memstats_heap_objects 21415
# HELP go_memstats_heap_released_bytes Number of heap bytes released to OS.
# TYPE go_memstats_heap_released_bytes gauge
go_memstats_heap_released_bytes 0
# HELP go_memstats_heap_sys_bytes Number of heap bytes obtained from system.
# TYPE go_memstats_heap_sys_bytes gauge
go_memstats_heap_sys_bytes 7.569408e+06
# HELP go_memstats_last_gc_time_seconds Number of seconds since 1970 of last garbage collection.
# TYPE go_memstats_last_gc_time_seconds gauge
go_memstats_last_gc_time_seconds 1.7067499480999463e+09
# HELP go_memstats_lookups_total Total number of pointer lookups.
# TYPE go_memstats_lookups_total counter
go_memstats_lookups_total 3476
# HELP go_memstats_mallocs_total Total number of mallocs.
# TYPE go_memstats_mallocs_total counter
go_memstats_mallocs_total 2.436989e+06
# HELP go_memstats_mcache_inuse_bytes Number of bytes in use by mcache structures.
# TYPE go_memstats_mcache_inuse_bytes gauge
go_memstats_mcache_inuse_bytes 1736
# HELP go_memstats_mcache_sys_bytes Number of bytes used for mcache structures obtained from system.
# TYPE go_memstats_mcache_sys_bytes gauge
go_memstats_mcache_sys_bytes 16384
# HELP go_memstats_mspan_inuse_bytes Number of bytes in use by mspan structures.
# TYPE go_memstats_mspan_inuse_bytes gauge
go_memstats_mspan_inuse_bytes 46360
# HELP go_memstats_mspan_sys_bytes Number of bytes used for mspan structures obtained from system.
# TYPE go_memstats_mspan_sys_bytes gauge
go_memstats_mspan_sys_bytes 65536
# HELP go_memstats_next_gc_bytes Number of heap bytes when next garbage collection will take place.
# TYPE go_memstats_next_gc_bytes gauge
go_memstats_next_gc_bytes 4.194304e+06
# HELP go_memstats_other_sys_bytes Number of bytes used for other system allocations.
# TYPE go_memstats_other_sys_bytes gauge
go_memstats_other_sys_bytes 458464
# HELP go_memstats_stack_inuse_bytes Number of bytes in use by the stack allocator.
# TYPE go_memstats_stack_inuse_bytes gauge
go_memstats_stack_inuse_bytes 327680
# HELP go_memstats_stack_sys_bytes Number of bytes obtained from system for stack allocator.
# TYPE go_memstats_stack_sys_bytes gauge
go_memstats_stack_sys_bytes 327680
# HELP go_memstats_sys_bytes Number of bytes obtained from system.
# TYPE go_memstats_sys_bytes gauge
go_memstats_sys_bytes 1.0418424e+07
# HELP go_threads Number of OS threads created.
# TYPE go_threads gauge
go_threads 4
# HELP node_cpu_guest_seconds_total Seconds the cpus spent in guests (VMs) for each mode.
# TYPE node_cpu_guest_seconds_total counter
node_cpu_guest_seconds_total{cpu="0",mode="nice"} 0
node_cpu_guest_seconds_total{cpu="0",mode="user"} 0
# HELP node_cpu_seconds_total Seconds the cpus spent in each mode.
# TYPE node_cpu_seconds_total counter
node_cpu_seconds_total{cpu="0",mode="idle"} 318496.33
node_cpu_seconds_total{cpu="0",mode="iowait"} 160.78
node_cpu_seconds_total{cpu="0",mode="irq"} 0
node_cpu_seconds_total{cpu="0",mode="nice"} 0.09
node_cpu_seconds_total{cpu="0",mode="softirq"} 118.89
node_cpu_seconds_total{cpu="0",mode="steal"} 0
node_cpu_seconds_total{cpu="0",mode="system"} 2120.31
node_cpu_seconds_total{cpu="0",mode="user"} 2842.33
# HELP node_exporter_build_info A metric with a constant '1' value labeled by version, revision, branch, and goversion from which node_exporter was built.
# TYPE node_exporter_build_info gauge
node_exporter_build_info{branch="HEAD",goversion="go1.9.6",revision="d42bd70f4363dced6b77d8fc311ea57b63387e4f",version="0.16.0"} 1
# HELP node_scrape_collector_duration_seconds node_exporter: Duration of a collector scrape.
# TYPE node_scrape_collector_duration_seconds gauge
node_scrape_collector_duration_seconds{collector="cpu"} 0.000506129
# HELP node_scrape_collector_success node_exporter: Whether a collector succeeded.
# TYPE node_scrape_collector_success gauge
node_scrape_collector_success{collector="cpu"} 1
# HELP process_cpu_seconds_total Total user and system CPU time spent in seconds.
# TYPE process_cpu_seconds_total counter
process_cpu_seconds_total 0.93
# HELP process_max_fds Maximum number of open file descriptors.
# TYPE process_max_fds gauge
process_max_fds 65535
# HELP process_open_fds Number of open file descriptors.
# TYPE process_open_fds gauge
process_open_fds 9
# HELP process_resident_memory_bytes Resident memory size in bytes.
# TYPE process_resident_memory_bytes gauge
process_resident_memory_bytes 1.3914112e+07
# HELP process_start_time_seconds Start time of the process since unix epoch in seconds.
# TYPE process_start_time_seconds gauge
process_start_time_seconds 1.70674908932e+09
# HELP process_virtual_memory_bytes Virtual memory size in bytes.
# TYPE process_virtual_memory_bytes gauge
process_virtual_memory_bytes 3.8486016e+07
# HELP promhttp_metric_handler_requests_in_flight Current number of scrapes being served.
# TYPE promhttp_metric_handler_requests_in_flight gauge
promhttp_metric_handler_requests_in_flight 1
# HELP promhttp_metric_handler_requests_total Total number of scrapes by HTTP status code.
# TYPE promhttp_metric_handler_requests_total counter
promhttp_metric_handler_requests_total{code="200"} 0
promhttp_metric_handler_requests_total{code="500"} 0
promhttp_metric_handler_requests_total{code="503"} 0
命令指定获取cpu和内存的信息,但是内存没有过滤收集里面配置
[root@mcw03 prometheus]# curl -g -X GET http://10.0.12:9100/metrics?collect[]=cpu
# HELP go_gc_duration_seconds A summary of the GC invocation durations.
# TYPE go_gc_duration_seconds summary
go_gc_duration_seconds{quantile="0"} 3.723e-06
go_gc_duration_seconds{quantile="0.25"} 7.29e-06
go_gc_duration_seconds{quantile="0.5"} 1.0836e-05
go_gc_duration_seconds{quantile="0.75"} 1.6577e-05
go_gc_duration_seconds{quantile="1"} 4.0677e-05
go_gc_duration_seconds_sum 0.001566895
go_gc_duration_seconds_count 127
# HELP go_goroutines Number of goroutines that currently exist.
# TYPE go_goroutines gauge
go_goroutines 9
# HELP go_info Information about the Go environment.
# TYPE go_info gauge
go_info{version="go1.9.6"} 1
# HELP go_memstats_alloc_bytes Number of bytes allocated and still in use.
# TYPE go_memstats_alloc_bytes gauge
go_memstats_alloc_bytes 1.920992e+06
# HELP go_memstats_alloc_bytes_total Total number of bytes allocated, even if freed.
# TYPE go_memstats_alloc_bytes_total counter
go_memstats_alloc_bytes_total 3.44081256e+08
# HELP go_memstats_buck_hash_sys_bytes Number of bytes used by the profiling bucket hash table.
# TYPE go_memstats_buck_hash_sys_bytes gauge
go_memstats_buck_hash_sys_bytes 1.48816e+06
# HELP go_memstats_frees_total Total number of frees.
# TYPE go_memstats_frees_total counter
go_memstats_frees_total 2.492023e+06
# HELP go_memstats_gc_cpu_fraction The fraction of this program's available CPU time used by the GC since the program started.
# TYPE go_memstats_gc_cpu_fraction gauge
go_memstats_gc_cpu_fraction 0.00013440931461542317
# HELP go_memstats_gc_sys_bytes Number of bytes used for garbage collection system metadata.
# TYPE go_memstats_gc_sys_bytes gauge
go_memstats_gc_sys_bytes 462848
# HELP go_memstats_heap_alloc_bytes Number of heap bytes allocated and still in use.
# TYPE go_memstats_heap_alloc_bytes gauge
go_memstats_heap_alloc_bytes 1.920992e+06
# HELP go_memstats_heap_idle_bytes Number of heap bytes waiting to be used.
# TYPE go_memstats_heap_idle_bytes gauge
go_memstats_heap_idle_bytes 4.75136e+06
# HELP go_memstats_heap_inuse_bytes Number of heap bytes that are in use.
# TYPE go_memstats_heap_inuse_bytes gauge
go_memstats_heap_inuse_bytes 2.818048e+06
# HELP go_memstats_heap_objects Number of allocated objects.
# TYPE go_memstats_heap_objects gauge
go_memstats_heap_objects 9004
# HELP go_memstats_heap_released_bytes Number of heap bytes released to OS.
# TYPE go_memstats_heap_released_bytes gauge
go_memstats_heap_released_bytes 0
# HELP go_memstats_heap_sys_bytes Number of heap bytes obtained from system.
# TYPE go_memstats_heap_sys_bytes gauge
go_memstats_heap_sys_bytes 7.569408e+06
# HELP go_memstats_last_gc_time_seconds Number of seconds since 1970 of last garbage collection.
# TYPE go_memstats_last_gc_time_seconds gauge
go_memstats_last_gc_time_seconds 1.7067501551743171e+09
# HELP go_memstats_lookups_total Total number of pointer lookups.
# TYPE go_memstats_lookups_total counter
go_memstats_lookups_total 3719
# HELP go_memstats_mallocs_total Total number of mallocs.
# TYPE go_memstats_mallocs_total counter
go_memstats_mallocs_total 2.501027e+06
# HELP go_memstats_mcache_inuse_bytes Number of bytes in use by mcache structures.
# TYPE go_memstats_mcache_inuse_bytes gauge
go_memstats_mcache_inuse_bytes 1736
# HELP go_memstats_mcache_sys_bytes Number of bytes used for mcache structures obtained from system.
# TYPE go_memstats_mcache_sys_bytes gauge
go_memstats_mcache_sys_bytes 16384
# HELP go_memstats_mspan_inuse_bytes Number of bytes in use by mspan structures.
# TYPE go_memstats_mspan_inuse_bytes gauge
go_memstats_mspan_inuse_bytes 31160
# HELP go_memstats_mspan_sys_bytes Number of bytes used for mspan structures obtained from system.
# TYPE go_memstats_mspan_sys_bytes gauge
go_memstats_mspan_sys_bytes 65536
# HELP go_memstats_next_gc_bytes Number of heap bytes when next garbage collection will take place.
# TYPE go_memstats_next_gc_bytes gauge
go_memstats_next_gc_bytes 4.194304e+06
# HELP go_memstats_other_sys_bytes Number of bytes used for other system allocations.
# TYPE go_memstats_other_sys_bytes gauge
go_memstats_other_sys_bytes 455640
# HELP go_memstats_stack_inuse_bytes Number of bytes in use by the stack allocator.
# TYPE go_memstats_stack_inuse_bytes gauge
go_memstats_stack_inuse_bytes 360448
# HELP go_memstats_stack_sys_bytes Number of bytes obtained from system for stack allocator.
# TYPE go_memstats_stack_sys_bytes gauge
go_memstats_stack_sys_bytes 360448
# HELP go_memstats_sys_bytes Number of bytes obtained from system.
# TYPE go_memstats_sys_bytes gauge
go_memstats_sys_bytes 1.0418424e+07
# HELP go_threads Number of OS threads created.
# TYPE go_threads gauge
go_threads 4
# HELP node_cpu_guest_seconds_total Seconds the cpus spent in guests (VMs) for each mode.
# TYPE node_cpu_guest_seconds_total counter
node_cpu_guest_seconds_total{cpu="0",mode="nice"} 0
node_cpu_guest_seconds_total{cpu="0",mode="user"} 0
# HELP node_cpu_seconds_total Seconds the cpus spent in each mode.
# TYPE node_cpu_seconds_total counter
node_cpu_seconds_total{cpu="0",mode="idle"} 318702.73
node_cpu_seconds_total{cpu="0",mode="iowait"} 160.8
node_cpu_seconds_total{cpu="0",mode="irq"} 0
node_cpu_seconds_total{cpu="0",mode="nice"} 0.09
node_cpu_seconds_total{cpu="0",mode="softirq"} 118.97
node_cpu_seconds_total{cpu="0",mode="steal"} 0
node_cpu_seconds_total{cpu="0",mode="system"} 2121.79
node_cpu_seconds_total{cpu="0",mode="user"} 2844.46
# HELP node_exporter_build_info A metric with a constant '1' value labeled by version, revision, branch, and goversion from which node_exporter was built.
# TYPE node_exporter_build_info gauge
node_exporter_build_info{branch="HEAD",goversion="go1.9.6",revision="d42bd70f4363dced6b77d8fc311ea57b63387e4f",version="0.16.0"} 1
# HELP node_scrape_collector_duration_seconds node_exporter: Duration of a collector scrape.
# TYPE node_scrape_collector_duration_seconds gauge
node_scrape_collector_duration_seconds{collector="cpu"} 0.000387279
# HELP node_scrape_collector_success node_exporter: Whether a collector succeeded.
# TYPE node_scrape_collector_success gauge
node_scrape_collector_success{collector="cpu"} 1
# HELP process_cpu_seconds_total Total user and system CPU time spent in seconds.
# TYPE process_cpu_seconds_total counter
process_cpu_seconds_total 0.97
# HELP process_max_fds Maximum number of open file descriptors.
# TYPE process_max_fds gauge
process_max_fds 65535
# HELP process_open_fds Number of open file descriptors.
# TYPE process_open_fds gauge
process_open_fds 10
# HELP process_resident_memory_bytes Resident memory size in bytes.
# TYPE process_resident_memory_bytes gauge
process_resident_memory_bytes 1.3914112e+07
# HELP process_start_time_seconds Start time of the process since unix epoch in seconds.
# TYPE process_start_time_seconds gauge
process_start_time_seconds 1.70674908932e+09
# HELP process_virtual_memory_bytes Virtual memory size in bytes.
# TYPE process_virtual_memory_bytes gauge
process_virtual_memory_bytes 3.8486016e+07
# HELP promhttp_metric_handler_requests_in_flight Current number of scrapes being served.
# TYPE promhttp_metric_handler_requests_in_flight gauge
promhttp_metric_handler_requests_in_flight 1
# HELP promhttp_metric_handler_requests_total Total number of scrapes by HTTP status code.
# TYPE promhttp_metric_handler_requests_total counter
promhttp_metric_handler_requests_total{code="200"} 0
promhttp_metric_handler_requests_total{code="500"} 0
promhttp_metric_handler_requests_total{code="503"} 0
[root@mcw03 prometheus]#
[root@mcw03 prometheus]#
[root@mcw03 prometheus]# curl -g -X GET http://10.0.12:9100/metrics?collect[]=meminfo
# HELP go_gc_duration_seconds A summary of the GC invocation durations.
# TYPE go_gc_duration_seconds summary
go_gc_duration_seconds{quantile="0"} 3.723e-06
go_gc_duration_seconds{quantile="0.25"} 7.445e-06
go_gc_duration_seconds{quantile="0.5"} 1.0836e-05
go_gc_duration_seconds{quantile="0.75"} 1.6577e-05
go_gc_duration_seconds{quantile="1"} 4.0677e-05
go_gc_duration_seconds_sum 0.001577441
go_gc_duration_seconds_count 128
# HELP go_goroutines Number of goroutines that currently exist.
# TYPE go_goroutines gauge
go_goroutines 9
# HELP go_info Information about the Go environment.
# TYPE go_info gauge
go_info{version="go1.9.6"} 1
# HELP go_memstats_alloc_bytes Number of bytes allocated and still in use.
# TYPE go_memstats_alloc_bytes gauge
go_memstats_alloc_bytes 3.20192e+06
# HELP go_memstats_alloc_bytes_total Total number of bytes allocated, even if freed.
# TYPE go_memstats_alloc_bytes_total counter
go_memstats_alloc_bytes_total 3.48386552e+08
# HELP go_memstats_buck_hash_sys_bytes Number of bytes used by the profiling bucket hash table.
# TYPE go_memstats_buck_hash_sys_bytes gauge
go_memstats_buck_hash_sys_bytes 1.4884e+06
# HELP go_memstats_frees_total Total number of frees.
# TYPE go_memstats_frees_total counter
go_memstats_frees_total 2.505375e+06
# HELP go_memstats_gc_cpu_fraction The fraction of this program's available CPU time used by the GC since the program started.
# TYPE go_memstats_gc_cpu_fraction gauge
go_memstats_gc_cpu_fraction 0.0001313802212349837
# HELP go_memstats_gc_sys_bytes Number of bytes used for garbage collection system metadata.
# TYPE go_memstats_gc_sys_bytes gauge
go_memstats_gc_sys_bytes 462848
# HELP go_memstats_heap_alloc_bytes Number of heap bytes allocated and still in use.
# TYPE go_memstats_heap_alloc_bytes gauge
go_memstats_heap_alloc_bytes 3.20192e+06
# HELP go_memstats_heap_idle_bytes Number of heap bytes waiting to be used.
# TYPE go_memstats_heap_idle_bytes gauge
go_memstats_heap_idle_bytes 3.56352e+06
# HELP go_memstats_heap_inuse_bytes Number of heap bytes that are in use.
# TYPE go_memstats_heap_inuse_bytes gauge
go_memstats_heap_inuse_bytes 4.005888e+06
# HELP go_memstats_heap_objects Number of allocated objects.
# TYPE go_memstats_heap_objects gauge
go_memstats_heap_objects 12674
# HELP go_memstats_heap_released_bytes Number of heap bytes released to OS.
# TYPE go_memstats_heap_released_bytes gauge
go_memstats_heap_released_bytes 0
# HELP go_memstats_heap_sys_bytes Number of heap bytes obtained from system.
# TYPE go_memstats_heap_sys_bytes gauge
go_memstats_heap_sys_bytes 7.569408e+06
# HELP go_memstats_last_gc_time_seconds Number of seconds since 1970 of last garbage collection.
# TYPE go_memstats_last_gc_time_seconds gauge
go_memstats_last_gc_time_seconds 1.7067501851701531e+09
# HELP go_memstats_lookups_total Total number of pointer lookups.
# TYPE go_memstats_lookups_total counter
go_memstats_lookups_total 3785
# HELP go_memstats_mallocs_total Total number of mallocs.
# TYPE go_memstats_mallocs_total counter
go_memstats_mallocs_total 2.518049e+06
# HELP go_memstats_mcache_inuse_bytes Number of bytes in use by mcache structures.
# TYPE go_memstats_mcache_inuse_bytes gauge
go_memstats_mcache_inuse_bytes 1736
# HELP go_memstats_mcache_sys_bytes Number of bytes used for mcache structures obtained from system.
# TYPE go_memstats_mcache_sys_bytes gauge
go_memstats_mcache_sys_bytes 16384
# HELP go_memstats_mspan_inuse_bytes Number of bytes in use by mspan structures.
# TYPE go_memstats_mspan_inuse_bytes gauge
go_memstats_mspan_inuse_bytes 34352
# HELP go_memstats_mspan_sys_bytes Number of bytes used for mspan structures obtained from system.
# TYPE go_memstats_mspan_sys_bytes gauge
go_memstats_mspan_sys_bytes 65536
# HELP go_memstats_next_gc_bytes Number of heap bytes when next garbage collection will take place.
# TYPE go_memstats_next_gc_bytes gauge
go_memstats_next_gc_bytes 4.194304e+06
# HELP go_memstats_other_sys_bytes Number of bytes used for other system allocations.
# TYPE go_memstats_other_sys_bytes gauge
go_memstats_other_sys_bytes 455400
# HELP go_memstats_stack_inuse_bytes Number of bytes in use by the stack allocator.
# TYPE go_memstats_stack_inuse_bytes gauge
go_memstats_stack_inuse_bytes 360448
# HELP go_memstats_stack_sys_bytes Number of bytes obtained from system for stack allocator.
# TYPE go_memstats_stack_sys_bytes gauge
go_memstats_stack_sys_bytes 360448
# HELP go_memstats_sys_bytes Number of bytes obtained from system.
# TYPE go_memstats_sys_bytes gauge
go_memstats_sys_bytes 1.0418424e+07
# HELP go_threads Number of OS threads created.
# TYPE go_threads gauge
go_threads 4
# HELP node_exporter_build_info A metric with a constant '1' value labeled by version, revision, branch, and goversion from which node_exporter was built.
# TYPE node_exporter_build_info gauge
node_exporter_build_info{branch="HEAD",goversion="go1.9.6",revision="d42bd70f4363dced6b77d8fc311ea57b63387e4f",version="0.16.0"} 1
# HELP node_memory_Active_anon_bytes Memory information field Active_anon_bytes.
# TYPE node_memory_Active_anon_bytes gauge
node_memory_Active_anon_bytes 1.358667776e+09
# HELP node_memory_Active_bytes Memory information field Active_bytes.
# TYPE node_memory_Active_bytes gauge
node_memory_Active_bytes 2.179166208e+09
# HELP node_memory_Active_file_bytes Memory information field Active_file_bytes.
# TYPE node_memory_Active_file_bytes gauge
node_memory_Active_file_bytes 8.20498432e+08
# HELP node_memory_AnonHugePages_bytes Memory information field AnonHugePages_bytes.
# TYPE node_memory_AnonHugePages_bytes gauge
node_memory_AnonHugePages_bytes 1.430257664e+09
# HELP node_memory_AnonPages_bytes Memory information field AnonPages_bytes.
# TYPE node_memory_AnonPages_bytes gauge
node_memory_AnonPages_bytes 1.690554368e+09
# HELP node_memory_Bounce_bytes Memory information field Bounce_bytes.
# TYPE node_memory_Bounce_bytes gauge
node_memory_Bounce_bytes 0
# HELP node_memory_Buffers_bytes Memory information field Buffers_bytes.
# TYPE node_memory_Buffers_bytes gauge
node_memory_Buffers_bytes 73728
# HELP node_memory_Cached_bytes Memory information field Cached_bytes.
# TYPE node_memory_Cached_bytes gauge
node_memory_Cached_bytes 1.651683328e+09
# HELP node_memory_CommitLimit_bytes Memory information field CommitLimit_bytes.
# TYPE node_memory_CommitLimit_bytes gauge
node_memory_CommitLimit_bytes 1.983213568e+09
# HELP node_memory_Committed_AS_bytes Memory information field Committed_AS_bytes.
# TYPE node_memory_Committed_AS_bytes gauge
node_memory_Committed_AS_bytes 2.837794816e+09
# HELP node_memory_DirectMap1G_bytes Memory information field DirectMap1G_bytes.
# TYPE node_memory_DirectMap1G_bytes gauge
node_memory_DirectMap1G_bytes 2.147483648e+09
# HELP node_memory_DirectMap2M_bytes Memory information field DirectMap2M_bytes.
# TYPE node_memory_DirectMap2M_bytes gauge
node_memory_DirectMap2M_bytes 4.211081216e+09
# HELP node_memory_DirectMap4k_bytes Memory information field DirectMap4k_bytes.
# TYPE node_memory_DirectMap4k_bytes gauge
node_memory_DirectMap4k_bytes 8.3689472e+07
# HELP node_memory_Dirty_bytes Memory information field Dirty_bytes.
# TYPE node_memory_Dirty_bytes gauge
node_memory_Dirty_bytes 5.505024e+06
# HELP node_memory_HardwareCorrupted_bytes Memory information field HardwareCorrupted_bytes.
# TYPE node_memory_HardwareCorrupted_bytes gauge
node_memory_HardwareCorrupted_bytes 0
# HELP node_memory_HugePages_Free Memory information field HugePages_Free.
# TYPE node_memory_HugePages_Free gauge
node_memory_HugePages_Free 0
# HELP node_memory_HugePages_Rsvd Memory information field HugePages_Rsvd.
# TYPE node_memory_HugePages_Rsvd gauge
node_memory_HugePages_Rsvd 0
# HELP node_memory_HugePages_Surp Memory information field HugePages_Surp.
# TYPE node_memory_HugePages_Surp gauge
node_memory_HugePages_Surp 0
# HELP node_memory_HugePages_Total Memory information field HugePages_Total.
# TYPE node_memory_HugePages_Total gauge
node_memory_HugePages_Total 0
# HELP node_memory_Hugepagesize_bytes Memory information field Hugepagesize_bytes.
# TYPE node_memory_Hugepagesize_bytes gauge
node_memory_Hugepagesize_bytes 2.097152e+06
# HELP node_memory_Inactive_anon_bytes Memory information field Inactive_anon_bytes.
# TYPE node_memory_Inactive_anon_bytes gauge
node_memory_Inactive_anon_bytes 3.4183168e+08
# HELP node_memory_Inactive_bytes Memory information field Inactive_bytes.
# TYPE node_memory_Inactive_bytes gauge
node_memory_Inactive_bytes 1.163145216e+09
# HELP node_memory_Inactive_file_bytes Memory information field Inactive_file_bytes.
# TYPE node_memory_Inactive_file_bytes gauge
node_memory_Inactive_file_bytes 8.21313536e+08
# HELP node_memory_KernelStack_bytes Memory information field KernelStack_bytes.
# TYPE node_memory_KernelStack_bytes gauge
node_memory_KernelStack_bytes 6.995968e+06
# HELP node_memory_Mapped_bytes Memory information field Mapped_bytes.
# TYPE node_memory_Mapped_bytes gauge
node_memory_Mapped_bytes 9.238528e+07
# HELP node_memory_MemAvailable_bytes Memory information field MemAvailable_bytes.
# TYPE node_memory_MemAvailable_bytes gauge
node_memory_MemAvailable_bytes 1.817935872e+09
# HELP node_memory_MemFree_bytes Memory information field MemFree_bytes.
# TYPE node_memory_MemFree_bytes gauge
node_memory_MemFree_bytes 1.36241152e+08
# HELP node_memory_MemTotal_bytes Memory information field MemTotal_bytes.
# TYPE node_memory_MemTotal_bytes gauge
node_memory_MemTotal_bytes 3.95804672e+09
# HELP node_memory_Mlocked_bytes Memory information field Mlocked_bytes.
# TYPE node_memory_Mlocked_bytes gauge
node_memory_Mlocked_bytes 0
# HELP node_memory_NFS_Unstable_bytes Memory information field NFS_Unstable_bytes.
# TYPE node_memory_NFS_Unstable_bytes gauge
node_memory_NFS_Unstable_bytes 0
# HELP node_memory_PageTables_bytes Memory information field PageTables_bytes.
# TYPE node_memory_PageTables_bytes gauge
node_memory_PageTables_bytes 1.646592e+07
# HELP node_memory_SReclaimable_bytes Memory information field SReclaimable_bytes.
# TYPE node_memory_SReclaimable_bytes gauge
node_memory_SReclaimable_bytes 3.35925248e+08
# HELP node_memory_SUnreclaim_bytes Memory information field SUnreclaim_bytes.
# TYPE node_memory_SUnreclaim_bytes gauge
node_memory_SUnreclaim_bytes 3.7568512e+07
# HELP node_memory_Shmem_bytes Memory information field Shmem_bytes.
# TYPE node_memory_Shmem_bytes gauge
node_memory_Shmem_bytes 9.945088e+06
# HELP node_memory_Slab_bytes Memory information field Slab_bytes.
# TYPE node_memory_Slab_bytes gauge
node_memory_Slab_bytes 3.7349376e+08
# HELP node_memory_SwapCached_bytes Memory information field SwapCached_bytes.
# TYPE node_memory_SwapCached_bytes gauge
node_memory_SwapCached_bytes 0
# HELP node_memory_SwapFree_bytes Memory information field SwapFree_bytes.
# TYPE node_memory_SwapFree_bytes gauge
node_memory_SwapFree_bytes 4.190208e+06
# HELP node_memory_SwapTotal_bytes Memory information field SwapTotal_bytes.
# TYPE node_memory_SwapTotal_bytes gauge
node_memory_SwapTotal_bytes 4.190208e+06
# HELP node_memory_Unevictable_bytes Memory information field Unevictable_bytes.
# TYPE node_memory_Unevictable_bytes gauge
node_memory_Unevictable_bytes 0
# HELP node_memory_VmallocChunk_bytes Memory information field VmallocChunk_bytes.
# TYPE node_memory_VmallocChunk_bytes gauge
node_memory_VmallocChunk_bytes 3.5183933779968e+13
# HELP node_memory_VmallocTotal_bytes Memory information field VmallocTotal_bytes.
# TYPE node_memory_VmallocTotal_bytes gauge
node_memory_VmallocTotal_bytes 3.5184372087808e+13
# HELP node_memory_VmallocUsed_bytes Memory information field VmallocUsed_bytes.
# TYPE node_memory_VmallocUsed_bytes gauge
node_memory_VmallocUsed_bytes 1.88870656e+08
# HELP node_memory_WritebackTmp_bytes Memory information field WritebackTmp_bytes.
# TYPE node_memory_WritebackTmp_bytes gauge
node_memory_WritebackTmp_bytes 0
# HELP node_memory_Writeback_bytes Memory information field Writeback_bytes.
# TYPE node_memory_Writeback_bytes gauge
node_memory_Writeback_bytes 0
# HELP node_scrape_collector_duration_seconds node_exporter: Duration of a collector scrape.
# TYPE node_scrape_collector_duration_seconds gauge
node_scrape_collector_duration_seconds{collector="meminfo"} 0.000119864
# HELP node_scrape_collector_success node_exporter: Whether a collector succeeded.
# TYPE node_scrape_collector_success gauge
node_scrape_collector_success{collector="meminfo"} 1
# HELP process_cpu_seconds_total Total user and system CPU time spent in seconds.
# TYPE process_cpu_seconds_total counter
process_cpu_seconds_total 0.98
# HELP process_max_fds Maximum number of open file descriptors.
# TYPE process_max_fds gauge
process_max_fds 65535
# HELP process_open_fds Number of open file descriptors.
# TYPE process_open_fds gauge
process_open_fds 10
# HELP process_resident_memory_bytes Resident memory size in bytes.
# TYPE process_resident_memory_bytes gauge
process_resident_memory_bytes 1.3914112e+07
# HELP process_start_time_seconds Start time of the process since unix epoch in seconds.
# TYPE process_start_time_seconds gauge
process_start_time_seconds 1.70674908932e+09
# HELP process_virtual_memory_bytes Virtual memory size in bytes.
# TYPE process_virtual_memory_bytes gauge
process_virtual_memory_bytes 3.8486016e+07
# HELP promhttp_metric_handler_requests_in_flight Current number of scrapes being served.
# TYPE promhttp_metric_handler_requests_in_flight gauge
promhttp_metric_handler_requests_in_flight 1
# HELP promhttp_metric_handler_requests_total Total number of scrapes by HTTP status code.
# TYPE promhttp_metric_handler_requests_total counter
promhttp_metric_handler_requests_total{code="200"} 0
promhttp_metric_handler_requests_total{code="500"} 0
promhttp_metric_handler_requests_total{code="503"} 0
[root@mcw03 prometheus]#
监控docker容器
运行cADvisor
docker run \
--volume=/:/rootfs:ro \
--volume=/var/run:/var/run:rw \
--volume=/sys:/sys:ro \
--volume=/var/lib/docker/:/var/lib/docker:ro \
--publish=8080:8080 \
--detach=true \
--name=cadvisor \
google/cadvisor:latest
[root@mcw02 ~]# docker run --volume=/:/rootfs:ro --volume=/var/run:/var/run:rw --volume=/sys:/sys:ro --volume=/var/lib/docker/:/var/lib/docker:ro --publish=8080:8080 --detach=true --name=cadvisor google/cadvisor:latest
Unable to find image 'google/cadvisor:latest' locally
latest: Pulling from google/cadvisor
ff3a5c916c92: Pull complete
44a45bb65cdf: Pull complete
0bbe1a2fe2a6: Pull complete
Digest: sha256:815386ebbe9a3490f38785ab11bda34ec8dacf4634af77b8912832d4f85dca04
Status: Downloaded newer image for google/cadvisor:latest
ec02f883cb004c22168526425494104d8900b31df522e48a0e467a4dad15c699
[root@mcw02 ~]# docker ps
CONTAINER ID   IMAGE                    COMMAND                  CREATED          STATUS          PORTS                                       NAMES
ec02f883cb00   google/cadvisor:latest   "/usr/bin/cadvisor -…"   48 seconds ago   Up 44 seconds   0.0.0.0:8080->8080/tcp, :::8080->8080/tcp   cadvisor
[root@mcw02 ~]#
访问容器服务
http://10.0.0.12:8080/

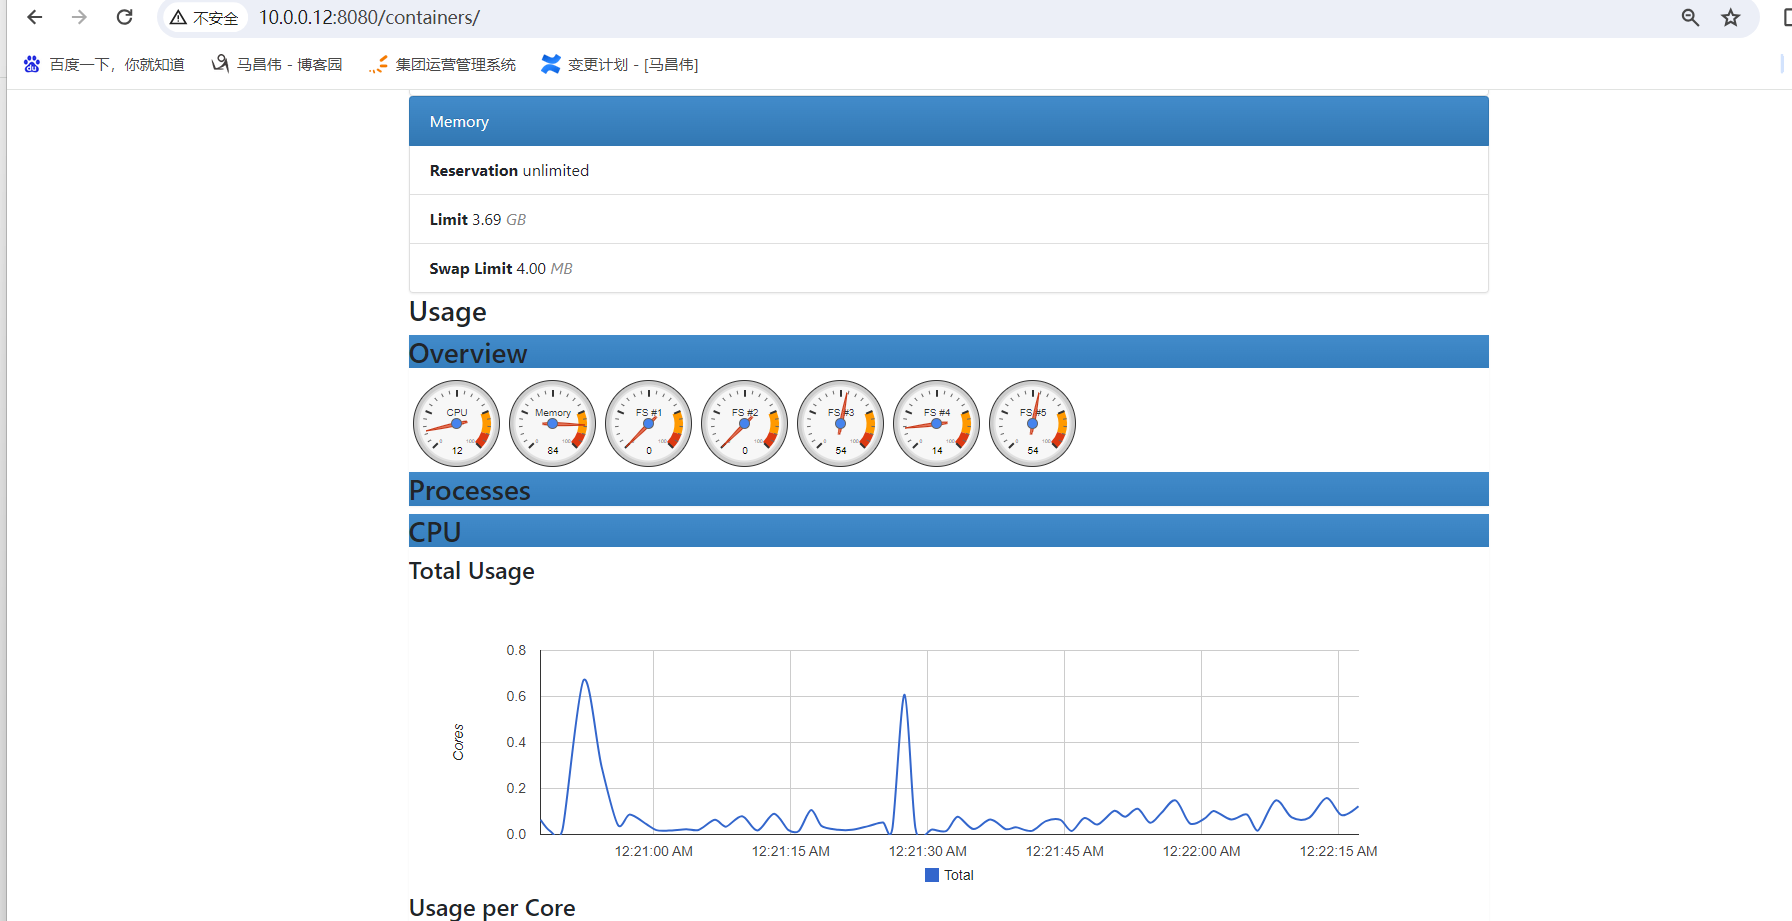
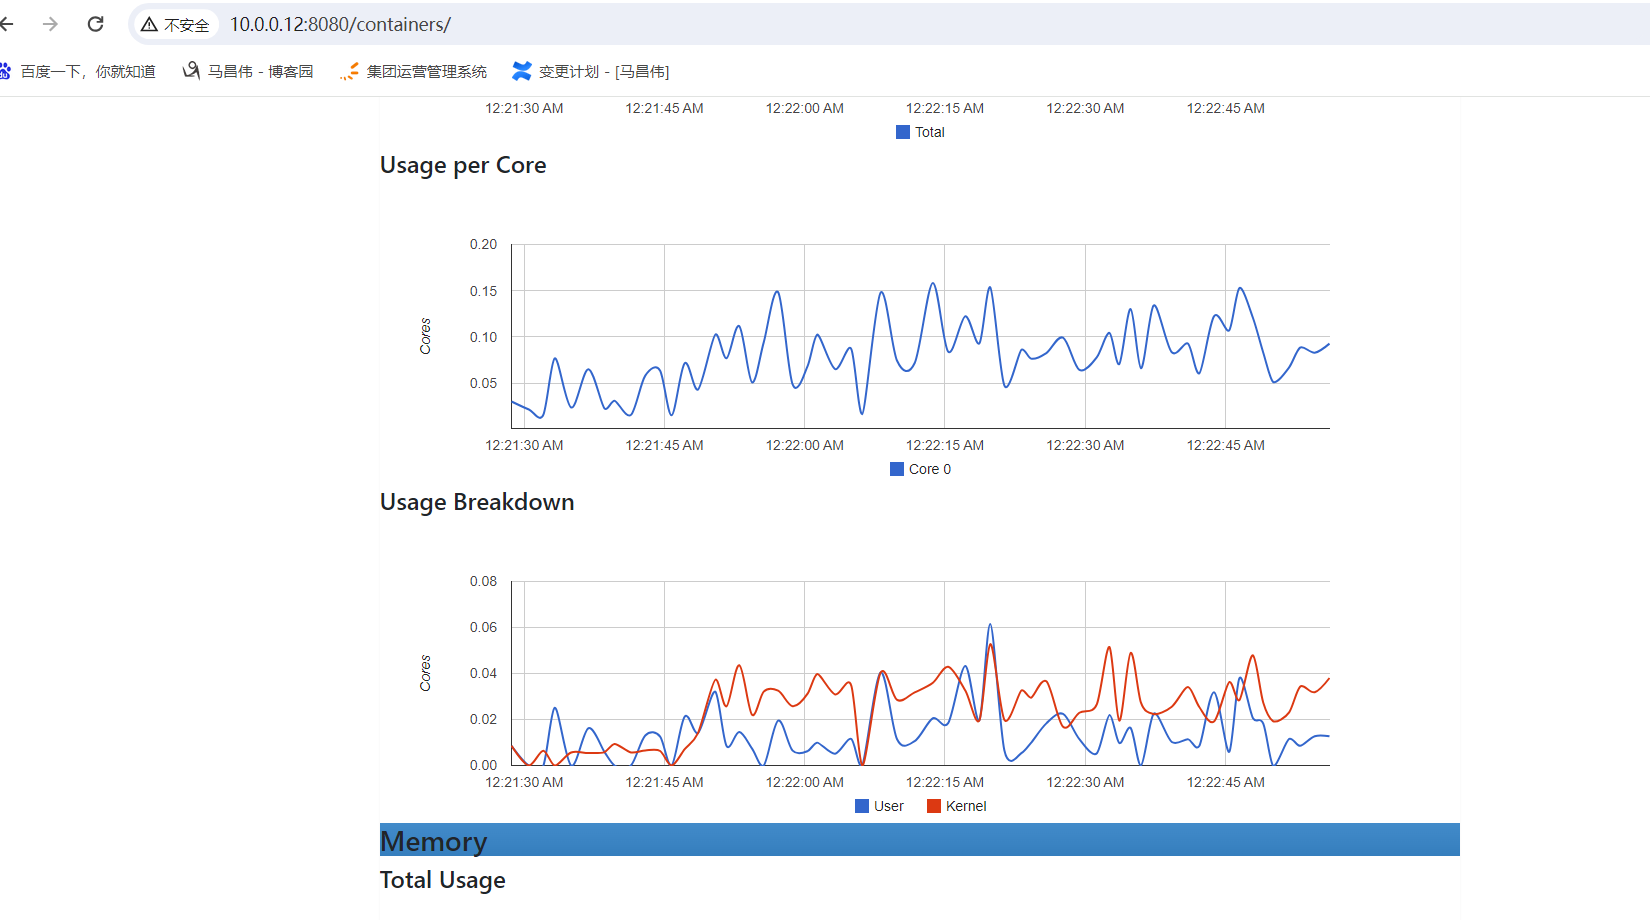
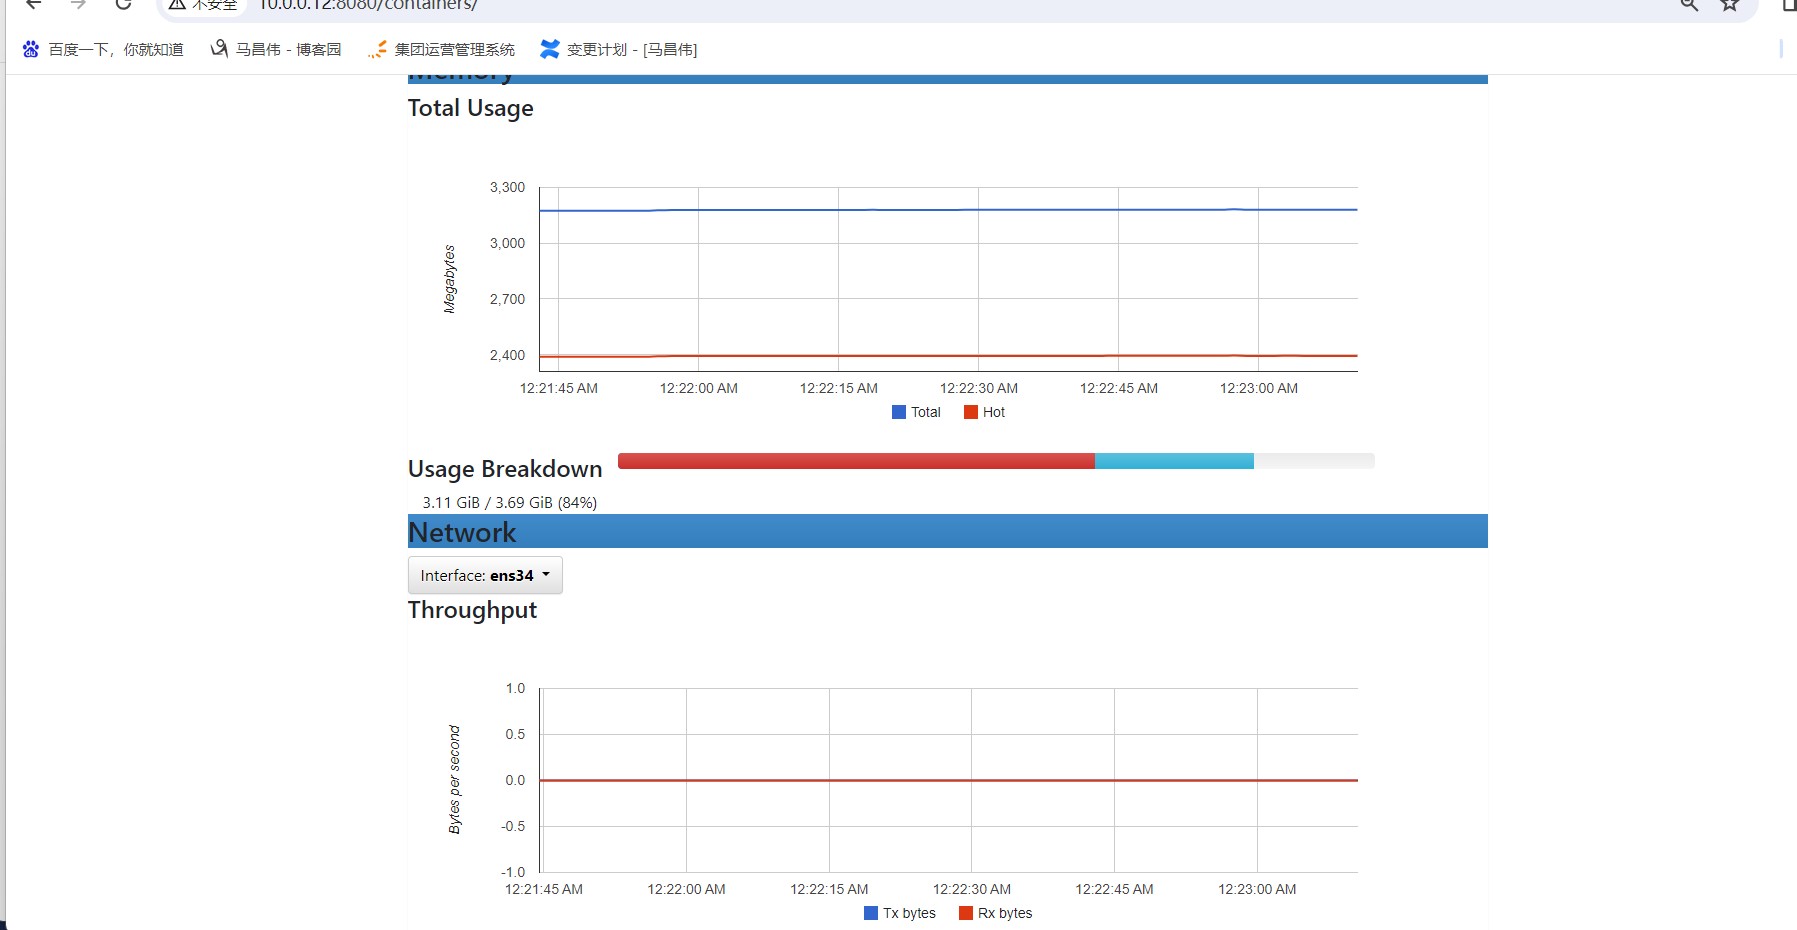
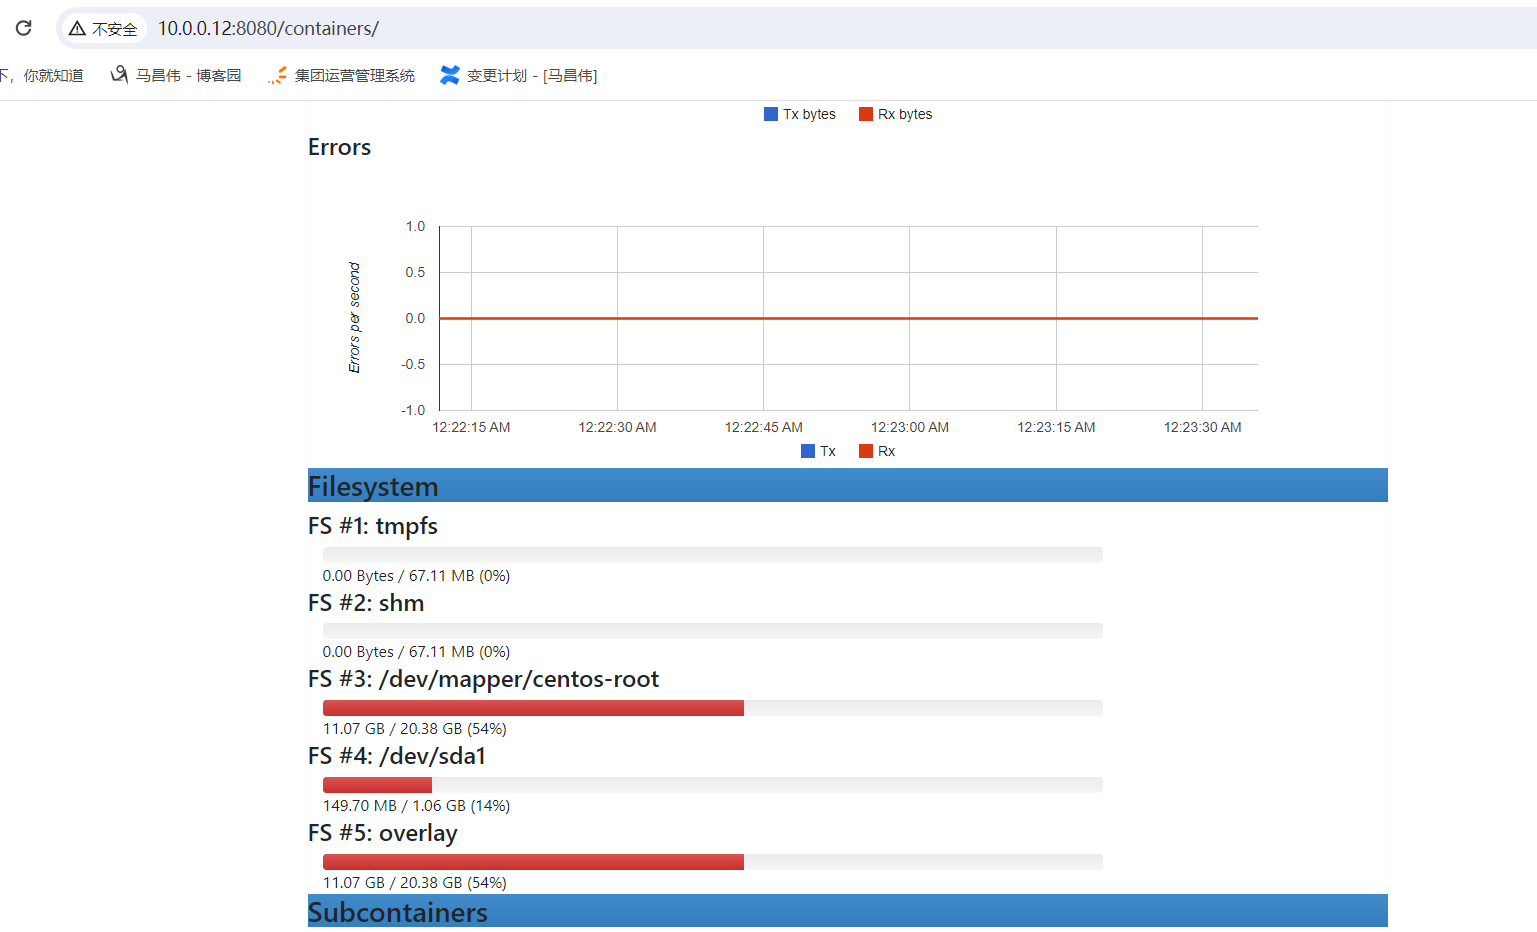

再次启动一个容器
[root@mcw02 ~]# docker ps
CONTAINER ID   IMAGE                    COMMAND                  CREATED          STATUS              PORTS                                       NAMES
ec02f883cb00   google/cadvisor:latest   "/usr/bin/cadvisor -…"   11 minutes ago   Up 11 minutes       0.0.0.0:8080->8080/tcp, :::8080->8080/tcp   cadvisor
958cbce17718   jenkins/jenkins          "/usr/bin/tini -- /u…"   12 months ago    Up About a minute   8080/tcp, 50000/tcp                         cool_kirch
[root@mcw02 ~]#
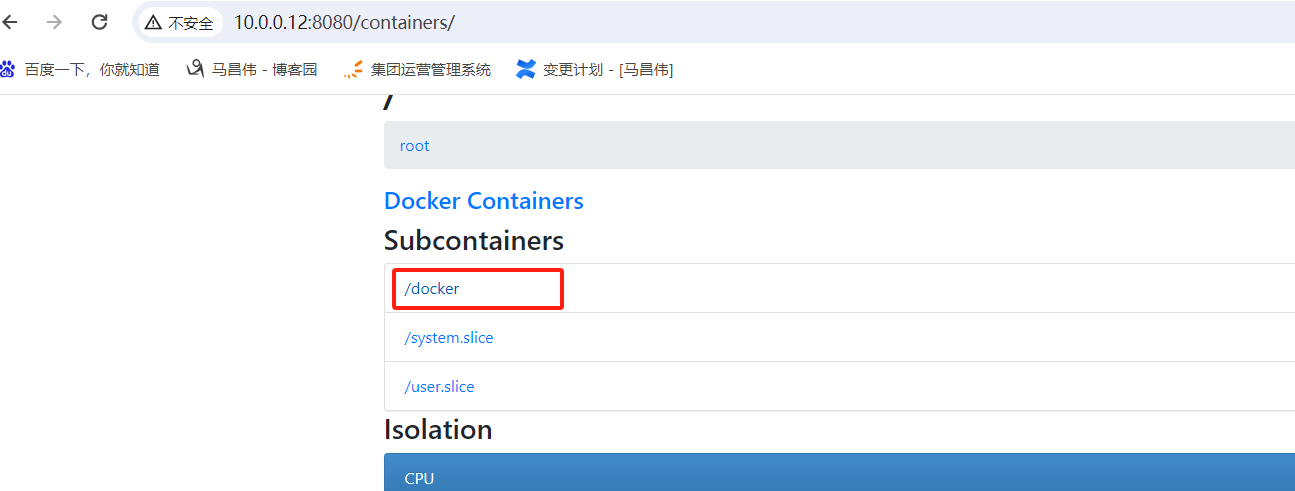
进了子容器,就是我们启动的两个容器
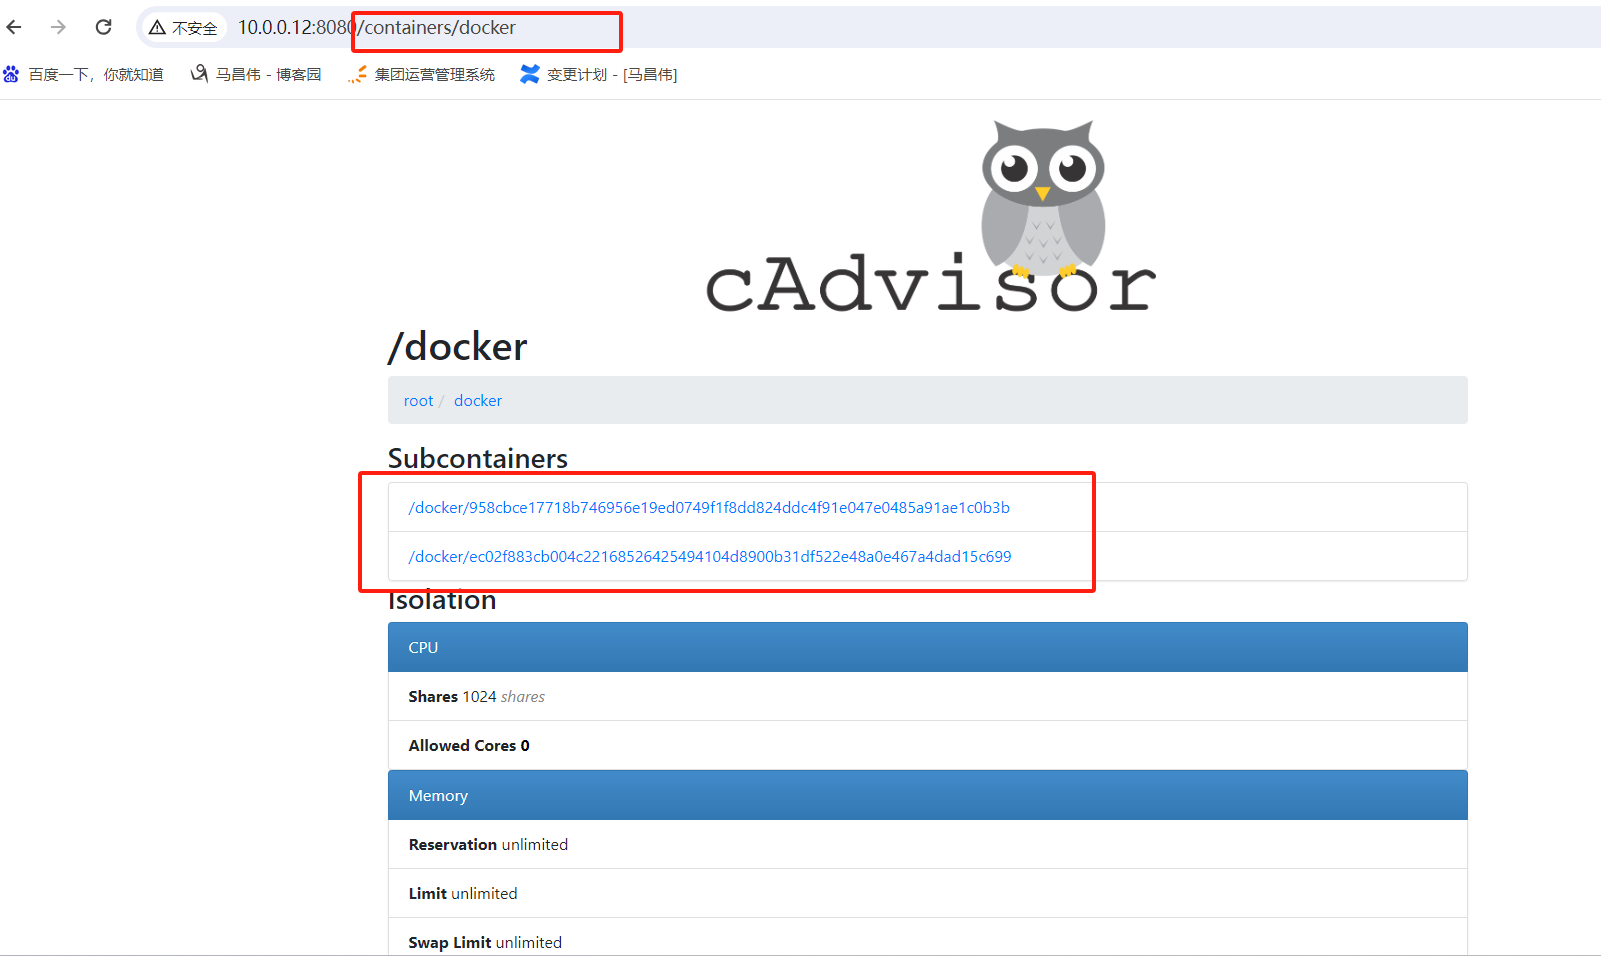
点击进入第一个容器
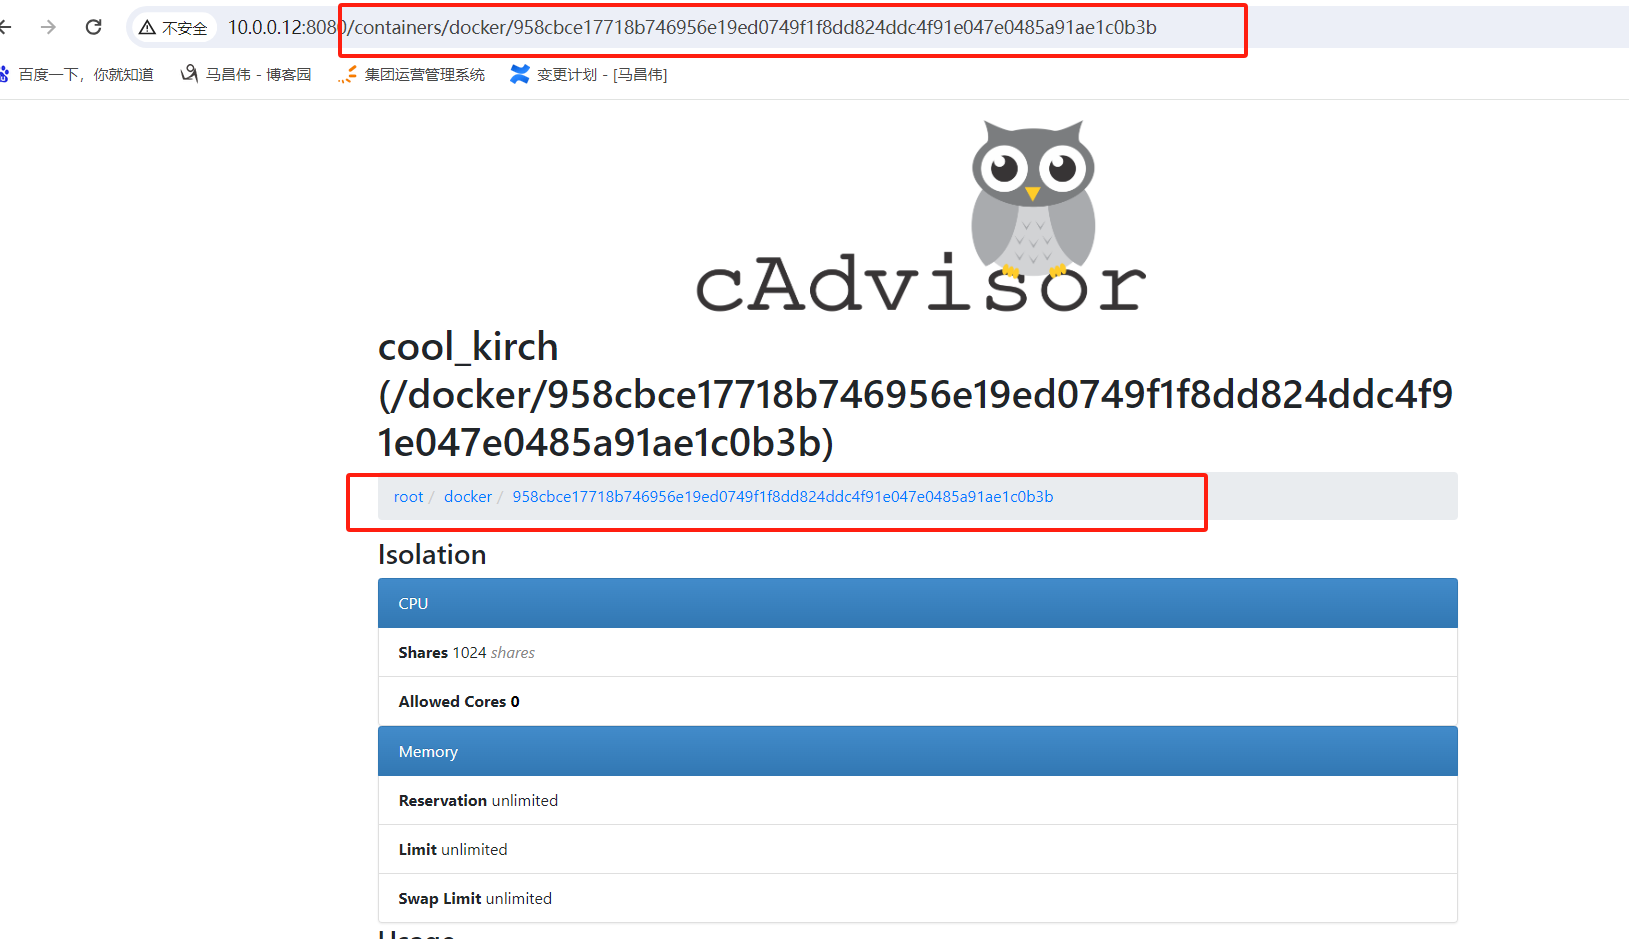
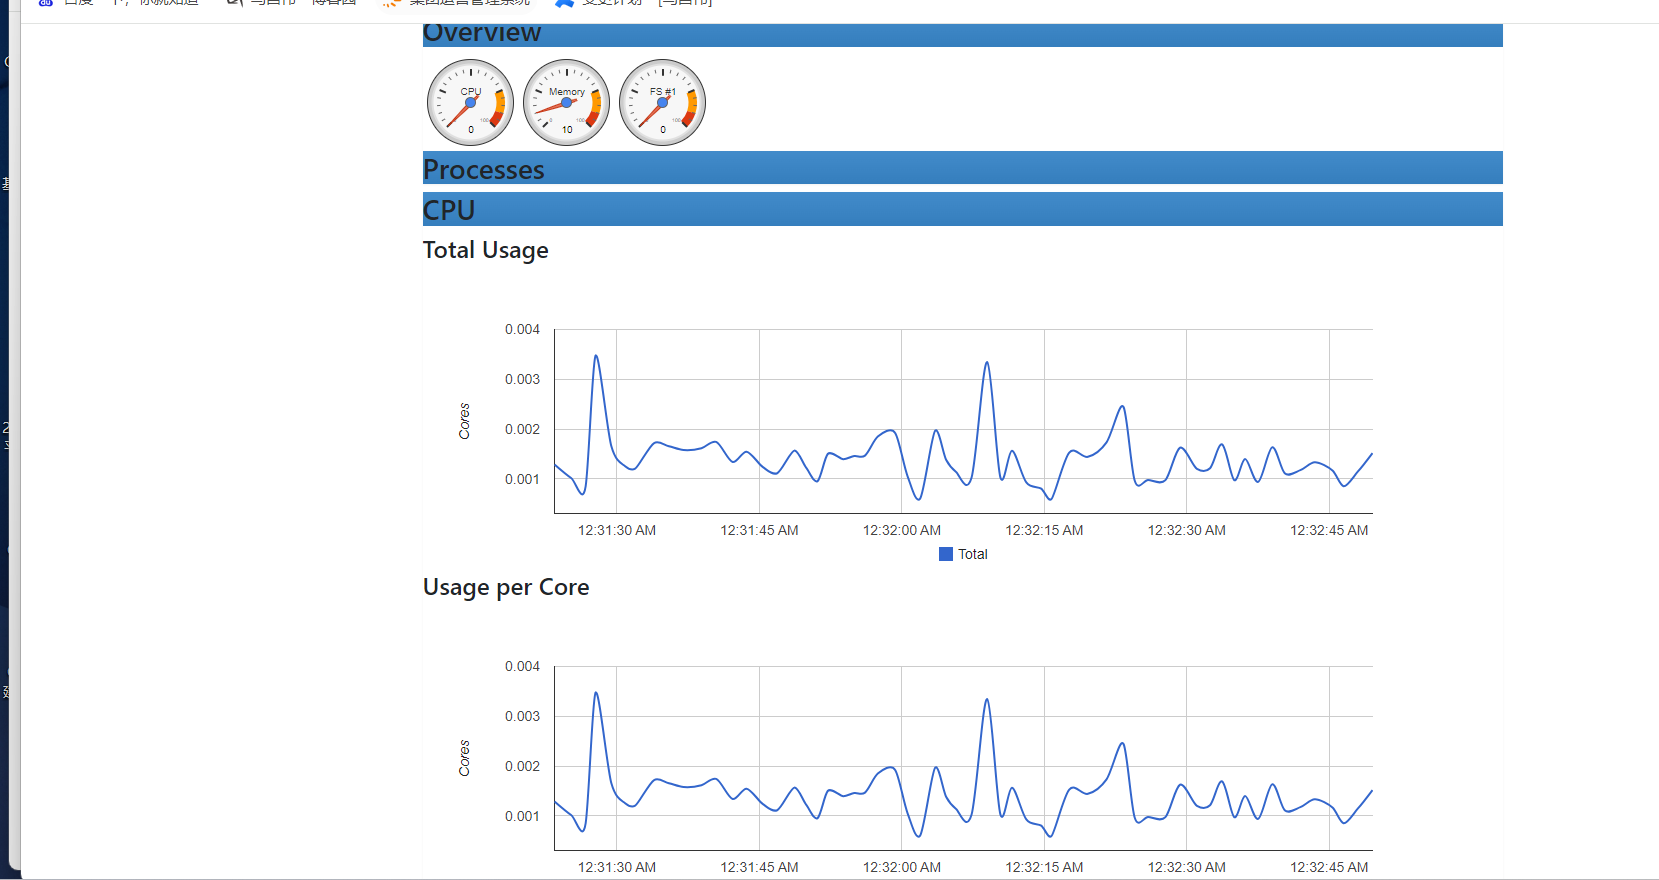
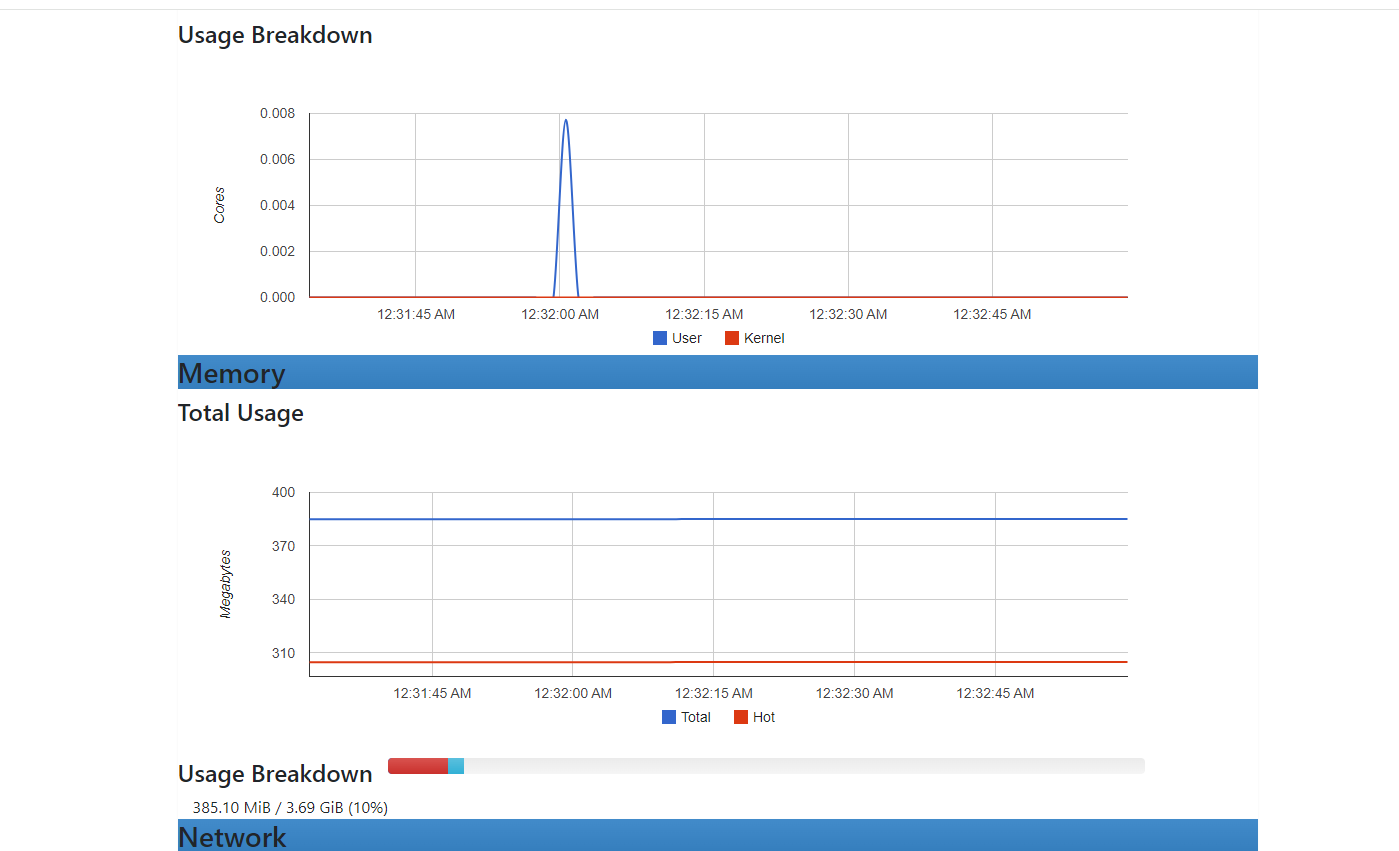
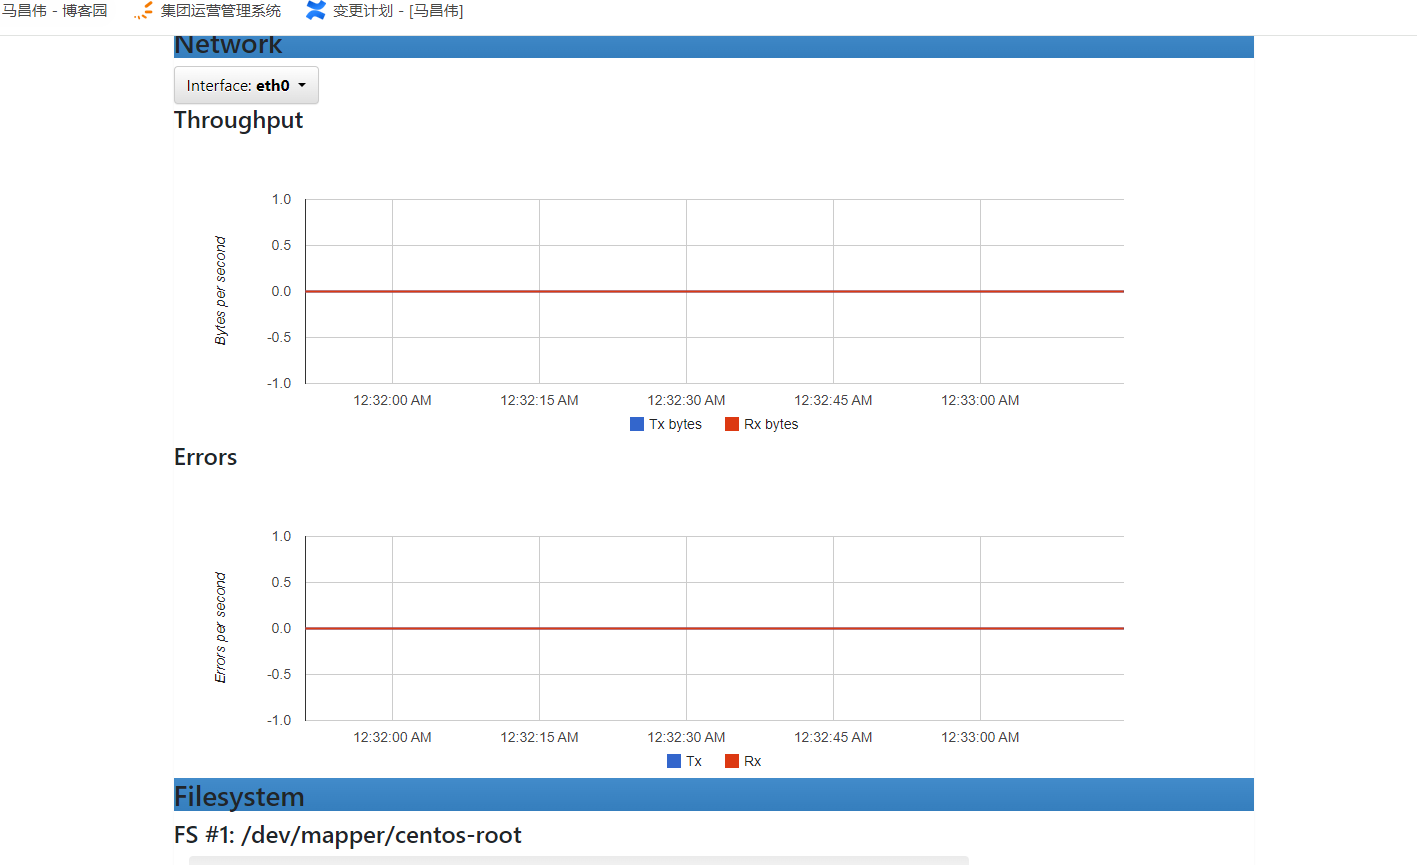

查看容器相关的指标

cadvisor容器指标访问案例http://10.0.0.12:8080/metrics
抓取cadvisor
cadvisor容器的8080端口,机器的 8080端口
[root@mcw02 ~]# docker ps
CONTAINER ID   IMAGE                    COMMAND                  CREATED         STATUS        PORTS                                       NAMES
ec02f883cb00   google/cadvisor:latest   "/usr/bin/cadvisor -…"   25 hours ago    Up 25 hours   0.0.0.0:8080->8080/tcp, :::8080->8080/tcp   cadvisor
958cbce17718   jenkins/jenkins          "/usr/bin/tini -- /u…"   12 months ago   Up 24 hours   8080/tcp, 50000/tcp                         cool_kirch
[root@mcw02 ~]#
添加这个客户端,重启
[root@mcw03 prometheus]# vim /etc/prometheus.yml
[root@mcw03 prometheus]# tail -3 /etc/prometheus.yml
  - job_name: 'docker'
    static_configs:
    - targets: ['10.0.0.12:8080']
[root@mcw03 prometheus]# curl -X POST http://localhost:9090/-/reload
[root@mcw03 prometheus]#
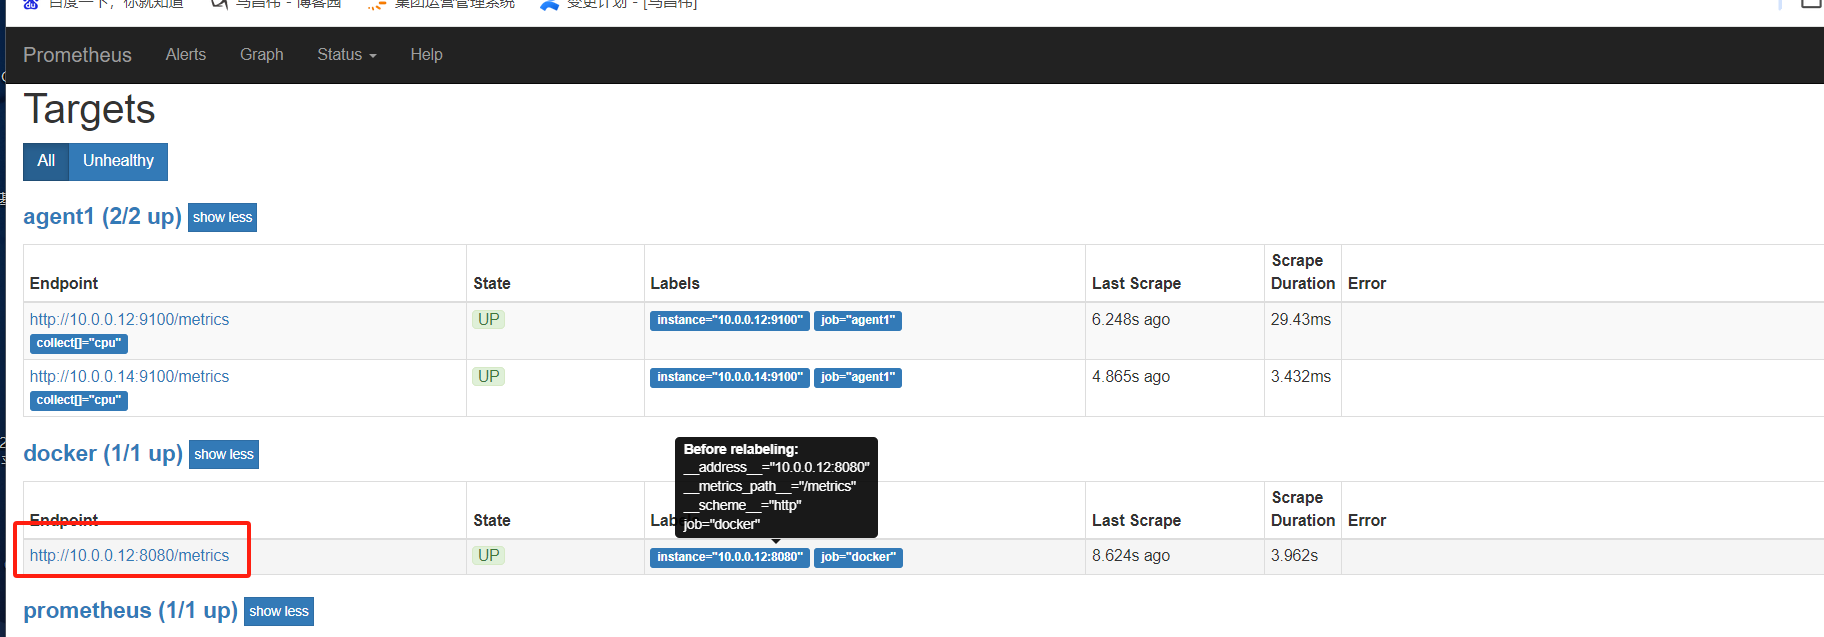
抓取的生命周期
默认是每15s一次
[root@mcw03 prometheus]# cat /etc/prometheus.yml
# my global config
global:
  scrape_interval:     15s # Set the scrape interval to every 15 seconds. Default is every 1 minute.
修改这两个的值
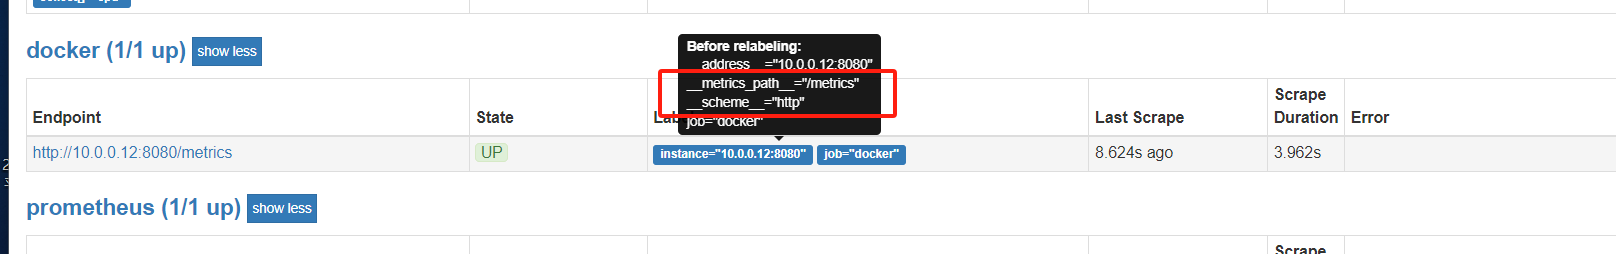
[root@mcw03 prometheus]# tail -5 /etc/prometheus.yml
  - job_name: 'docker'
    scheme: https
    metrics_path: /moremetrics
    static_configs:
    - targets: ['10.0.0.12:8080']
[root@mcw03 prometheus]# curl -X POST http://localhost:9090/-/reload
[root@mcw03 prometheus]#
已经被修改,只是报错了
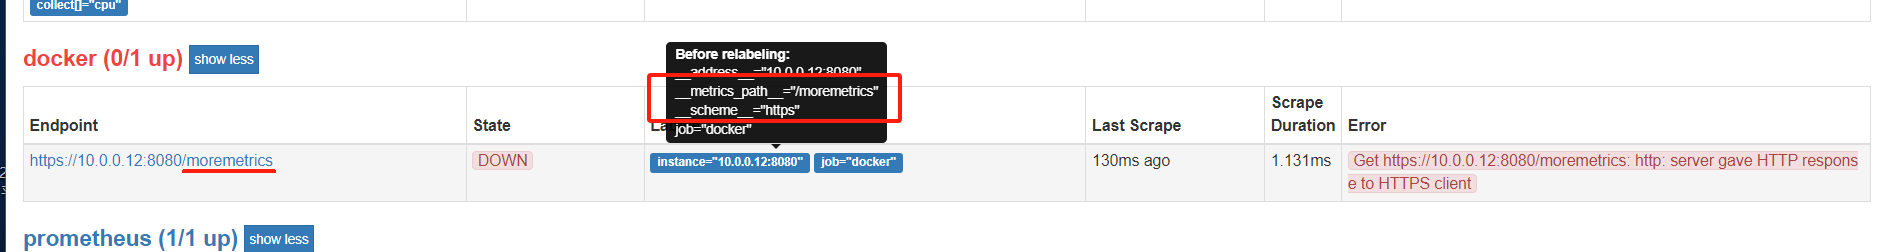
Get https://10.0.0.12:8080/moremetrics: http: server gave HTTP response to HTTPS client
修改去掉https
[root@mcw03 prometheus]# vim /etc/prometheus.yml
[root@mcw03 prometheus]# tail -4 /etc/prometheus.yml
  - job_name: 'docker'
    metrics_path: /moremetrics
    static_configs:
    - targets: ['10.0.0.12:8080']
[root@mcw03 prometheus]# curl -X POST http://localhost:9090/-/reload
[root@mcw03 prometheus]#
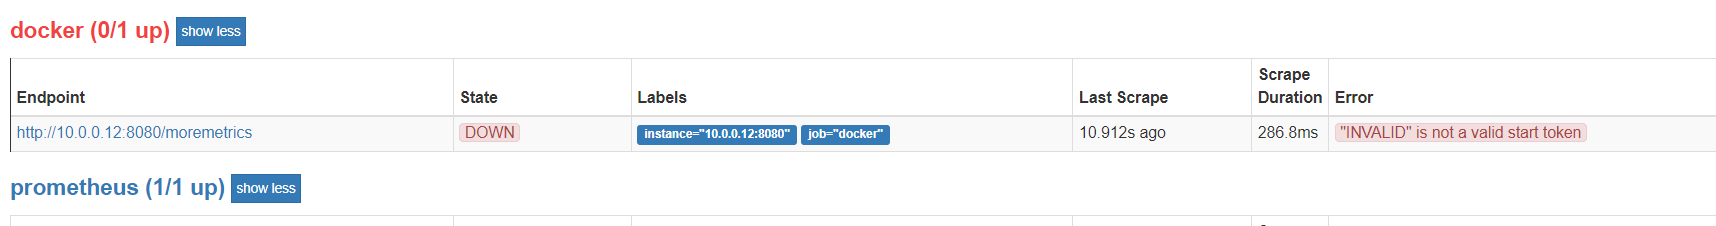
修改使用默认的路径
[root@mcw03 prometheus]# tail -4 /etc/prometheus.yml
  - job_name: 'docker'
    metrics_path: /moremetrics
    static_configs:
    - targets: ['10.0.0.12:8080']
[root@mcw03 prometheus]# vim /etc/prometheus.yml
[root@mcw03 prometheus]# tail -3 /etc/prometheus.yml
    metrics_path: /metrics
    static_configs:
    - targets: ['10.0.0.12:8080']
[root@mcw03 prometheus]# curl -X POST http://localhost:9090/-/reload
[root@mcw03 prometheus]#
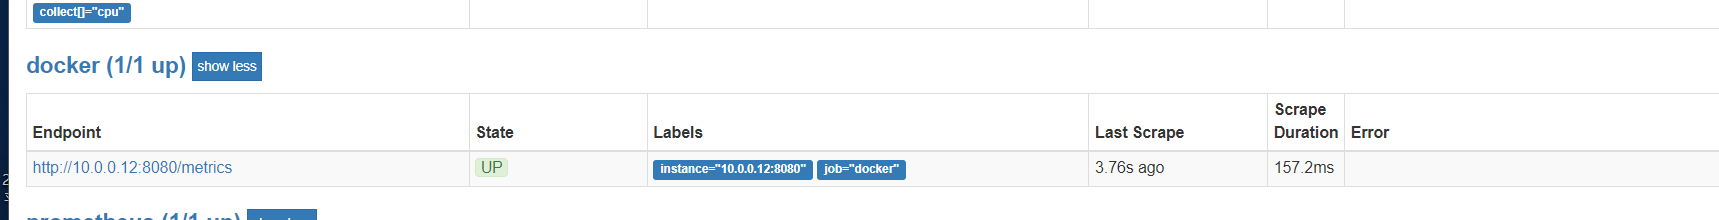
标签
操作之前
[root@mcw03 prometheus]# tail -3 /etc/prometheus.yml
  - job_name: 'docker'
    static_configs:
    - targets: ['10.0.0.12:8080']
[root@mcw03 prometheus]#

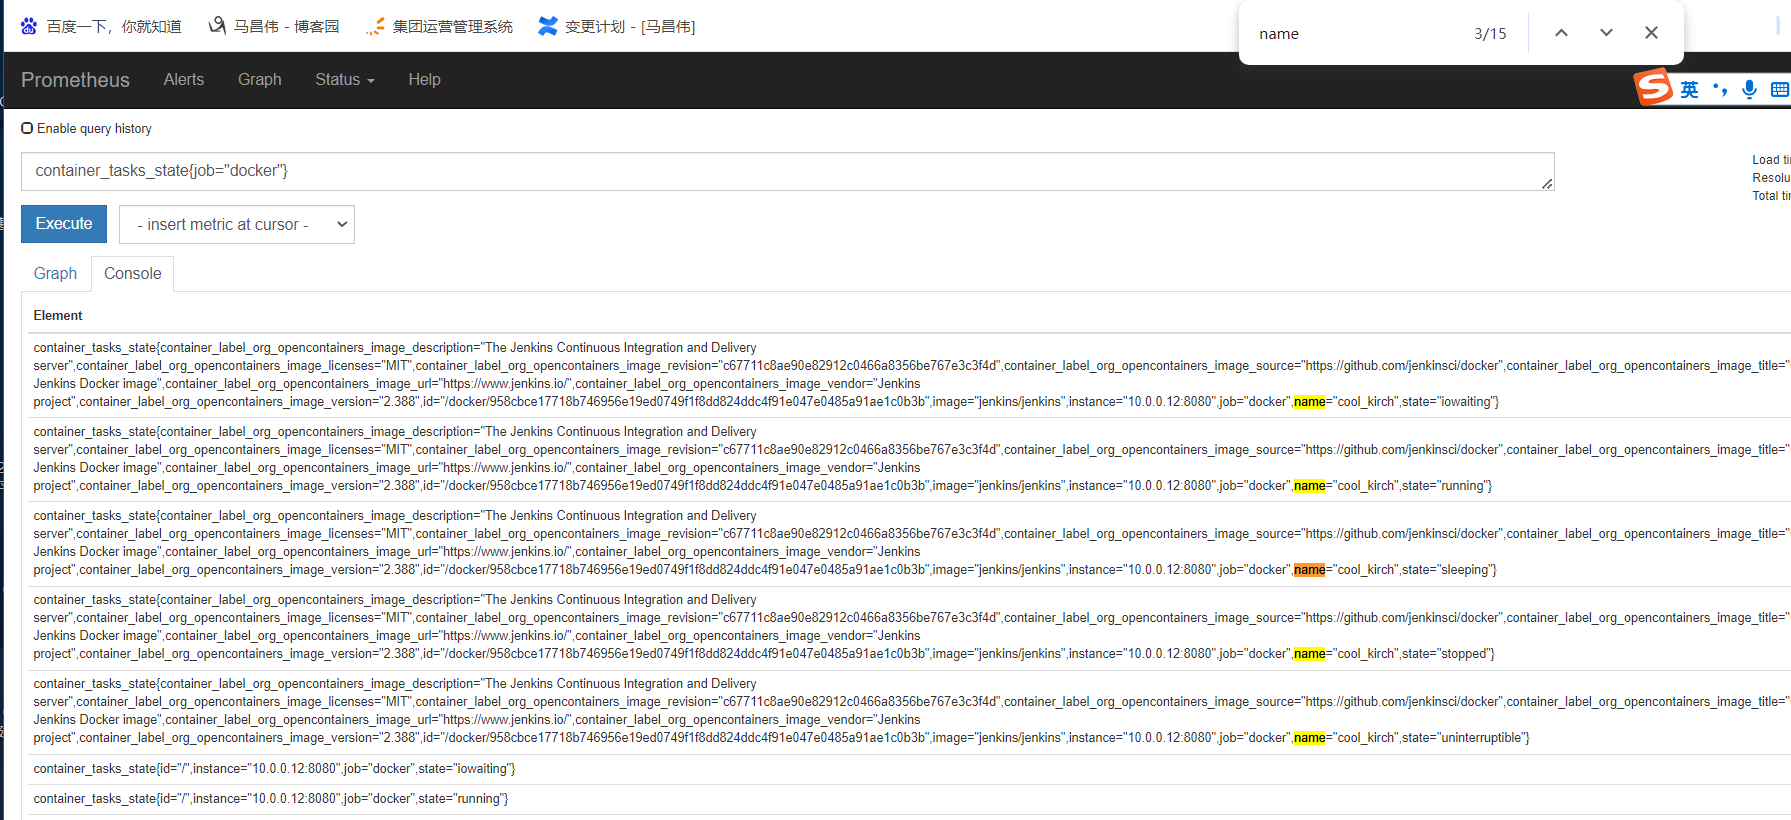
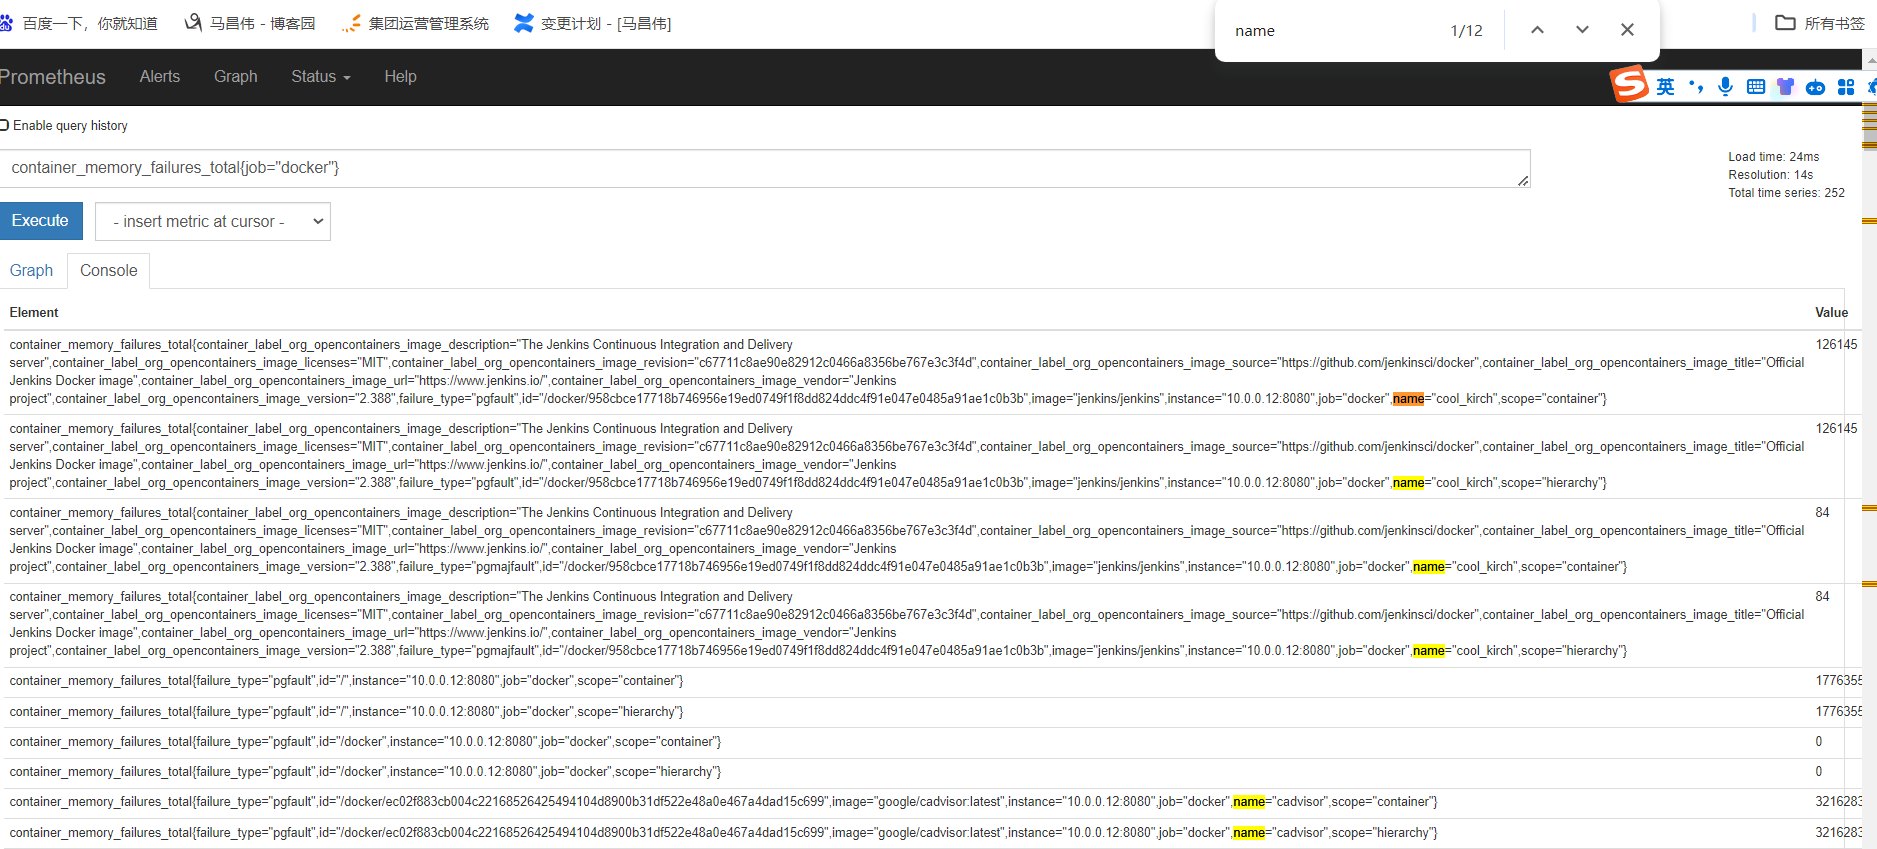
配置写错了会报错
[root@mcw03 prometheus]# tail -3 /etc/prometheus.yml
  - job_name: 'docker'
    static_configs:
    - targets: ['10.0.0.12:8080']
[root@mcw03 prometheus]# vim /etc/prometheus.yml
[root@mcw03 prometheus]# tail -8 /etc/prometheus.yml
  - job_name: 'docker'
    static_configs:
    - targets: ['10.0.0.12:8080']
    metric_telabel_configs:
    - source_labels: [__name__]
      sepatator: ','
      regex: '(container_tasks_state|container_memory_failures_total)'
      action: drop
[root@mcw03 prometheus]# curl -X POST http://localhost:9090/-/reload
failed to reload config: couldn't load configuration (--config.file="/etc/prometheus.yml"): parsing YAML file /etc/prometheus.yml: yaml: unmarshal errors:
  line 45: field metric_telabel_configs not found in type config.plain
[root@mcw03 prometheus]#
[root@mcw03 prometheus]#
[root@mcw03 prometheus]# vim /etc/prometheus.yml
[root@mcw03 prometheus]# vim /etc/prometheus.yml
[root@mcw03 prometheus]# tail -8 /etc/prometheus.yml
  - job_name: 'docker'
    static_configs:
    - targets: ['10.0.0.12:8080']
    metric_relabel_configs:
    - source_labels: [__name__]
      sepatator: ','
      regex: '(container_tasks_state|container_memory_failures_total)'
      action: drop
[root@mcw03 prometheus]# curl -X POST http://localhost:9090/-/reload
failed to reload config: couldn't load configuration (--config.file="/etc/prometheus.yml"): parsing YAML file /etc/prometheus.yml: yaml: unmarshal errors:
  line 47: field sepatator not found in type config.plain
[root@mcw03 prometheus]#
写对之后,删除指标了
[root@mcw03 prometheus]# vim /etc/prometheus.yml
[root@mcw03 prometheus]# tail -8 /etc/prometheus.yml
  - job_name: 'docker'
    static_configs:
    - targets: ['10.0.0.12:8080']
    metric_relabel_configs:
    - source_labels: [__name__]
      separator: ','
      regex: '(container_tasks_state|container_memory_failures_total)'
      action: drop
[root@mcw03 prometheus]# curl -X POST http://localhost:9090/-/reload
[root@mcw03 prometheus]#

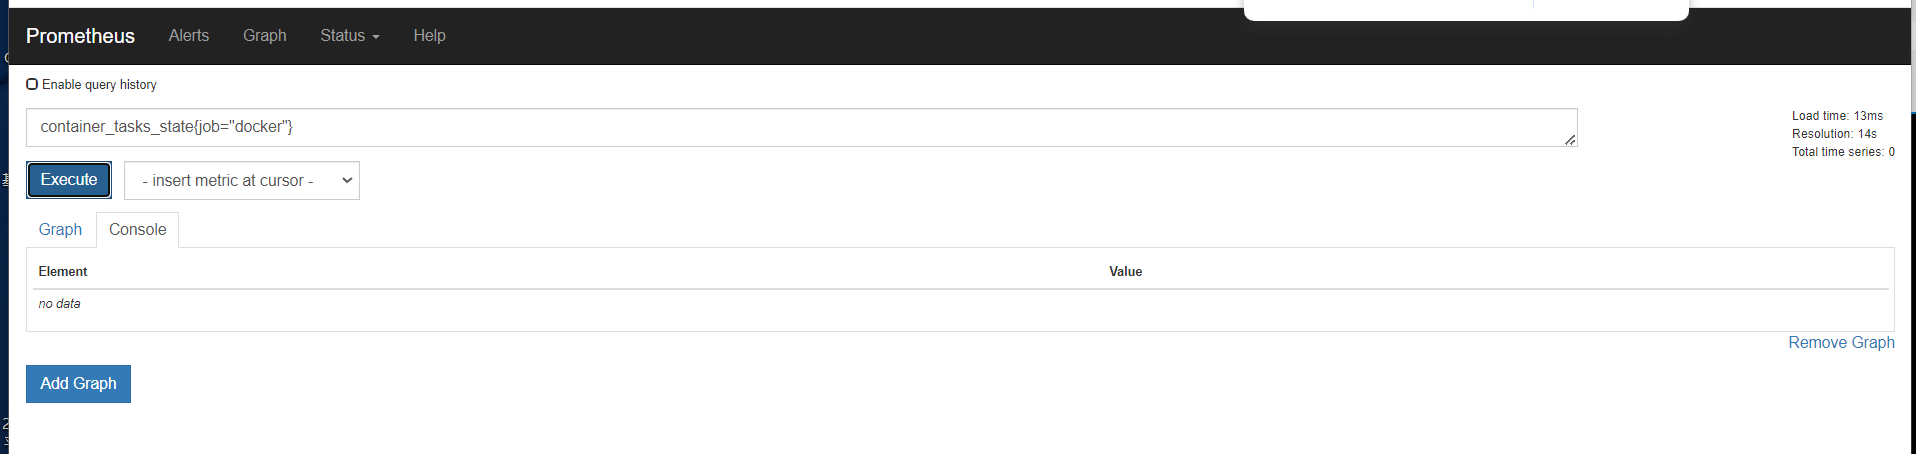
指标还是有的,被采集过来了,只是浏览器表达式上找不到了
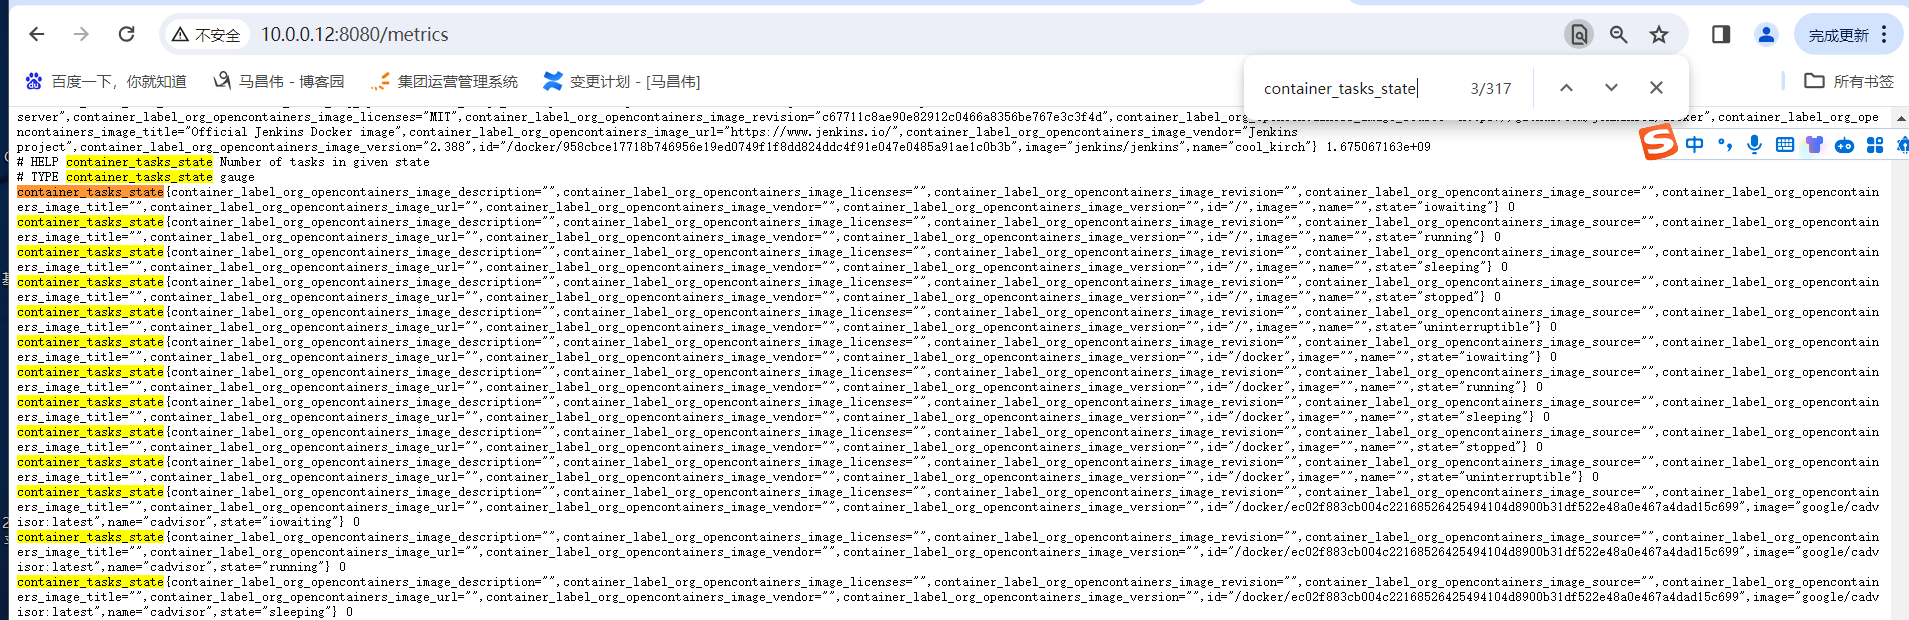
把分隔符去掉,效果还是删除指标了
[root@mcw03 prometheus]# vim /etc/prometheus.yml
[root@mcw03 prometheus]# tail -8 /etc/prometheus.yml
    - targets: ['10.0.0.13:9104']
  - job_name: 'docker'
    static_configs:
    - targets: ['10.0.0.12:8080']
    metric_relabel_configs:
    - source_labels: [__name__]
      regex: '(container_tasks_state|container_memory_failures_total)'
      action: drop
[root@mcw03 prometheus]# curl -X POST http://localhost:9090/-/reload
[root@mcw03 prometheus]#
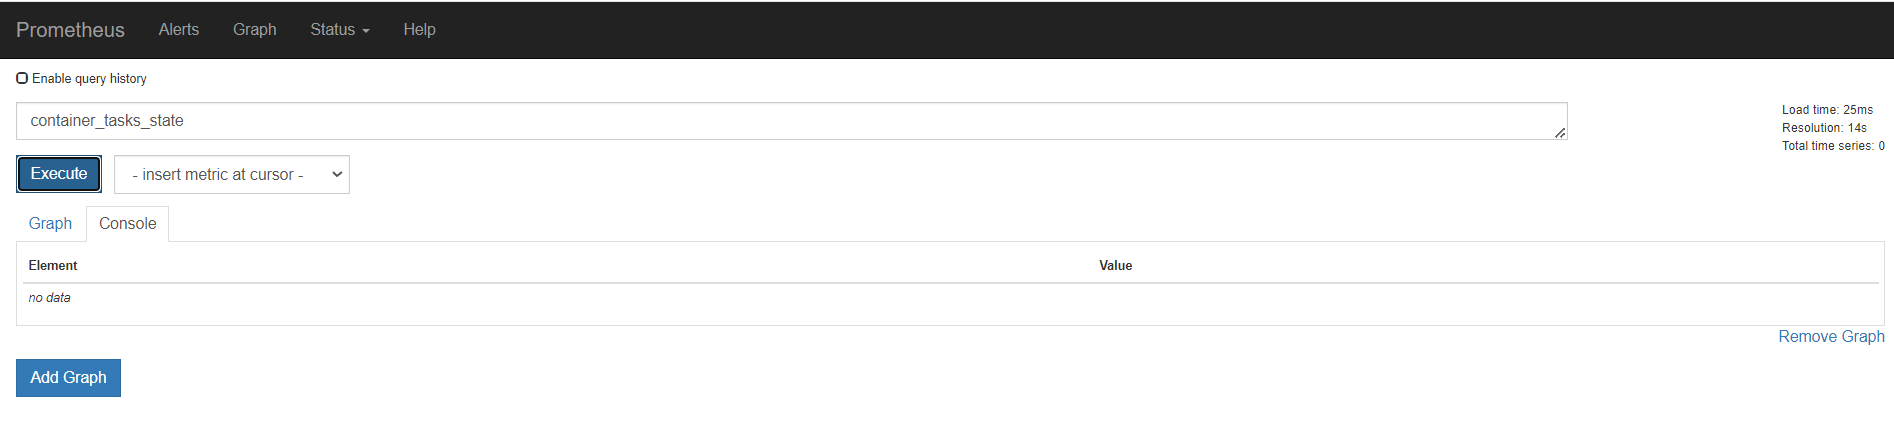
将删除指标的配置去掉
[root@mcw03 prometheus]# tail -7 /etc/prometheus.yml
  - job_name: 'docker'
    static_configs:
    - targets: ['10.0.0.12:8080']
    metric_relabel_configs:
    - source_labels: [__name__]
      regex: '(container_tasks_state|container_memory_failures_total)'
      action: drop
[root@mcw03 prometheus]# vim /etc/prometheus.yml
[root@mcw03 prometheus]# tail -7 /etc/prometheus.yml
    - targets: ['10.0.0.13:9100']
  - job_name: 'server_mariadb'
    static_configs:
    - targets: ['10.0.0.13:9104']
  - job_name: 'docker'
    static_configs:
    - targets: ['10.0.0.12:8080']
[root@mcw03 prometheus]# curl -X POST http://localhost:9090/-/reload
[root@mcw03 prometheus]#
表达式浏览器上又可以搜索到了
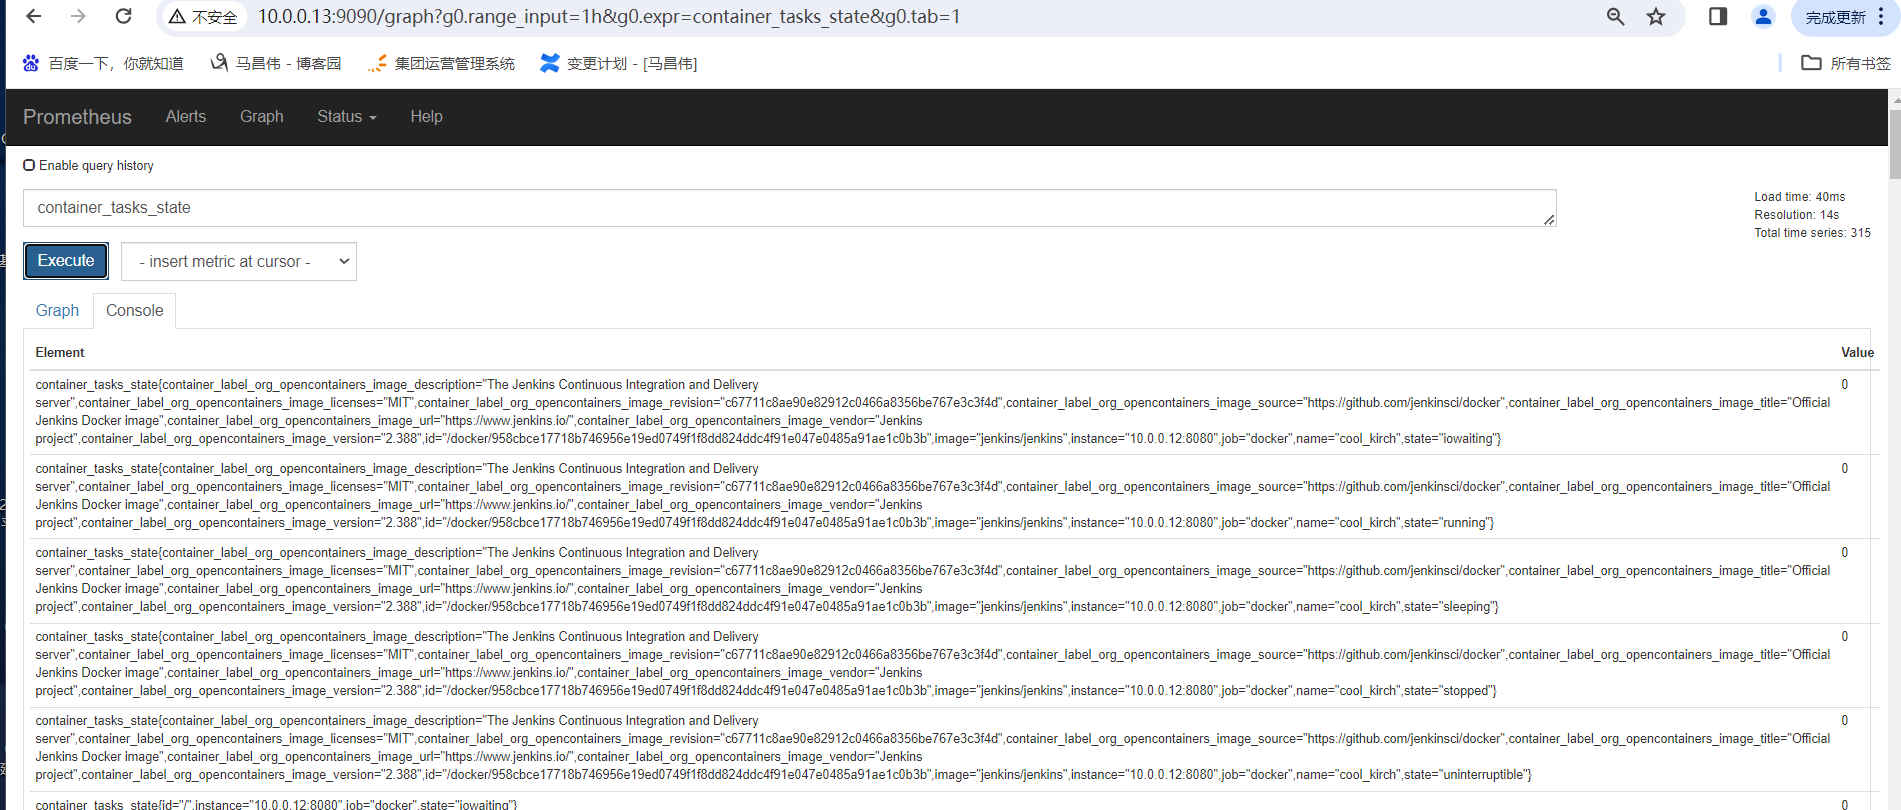
使用keep
使用之前
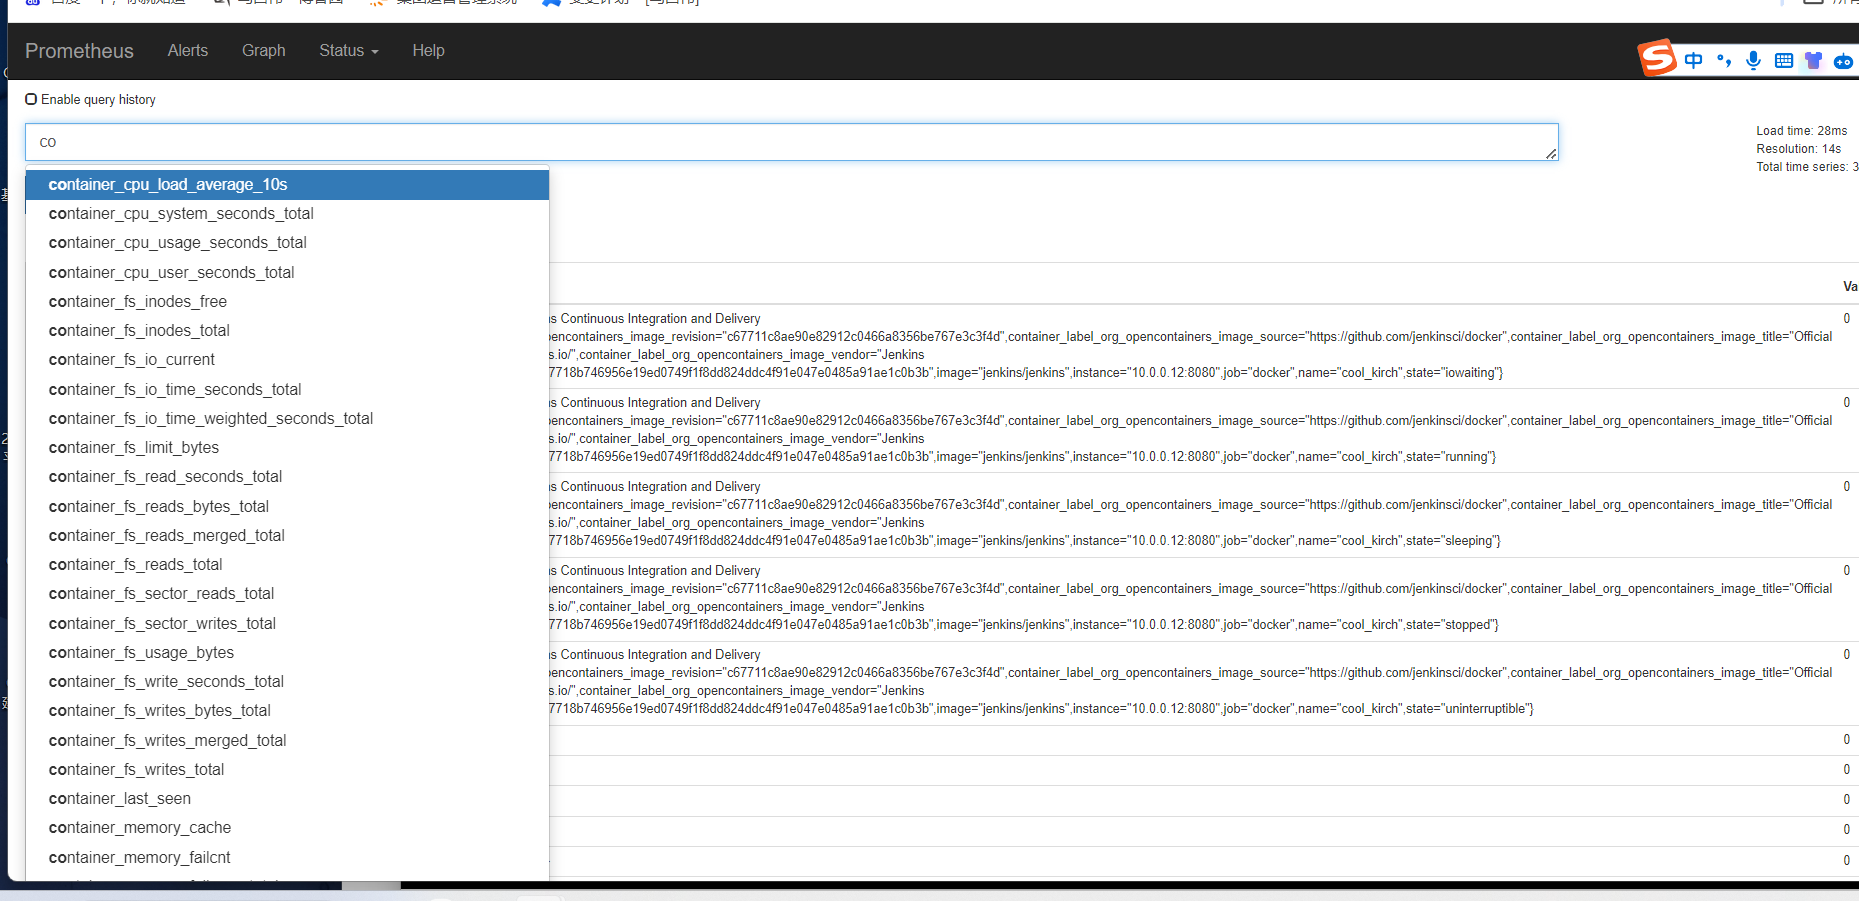
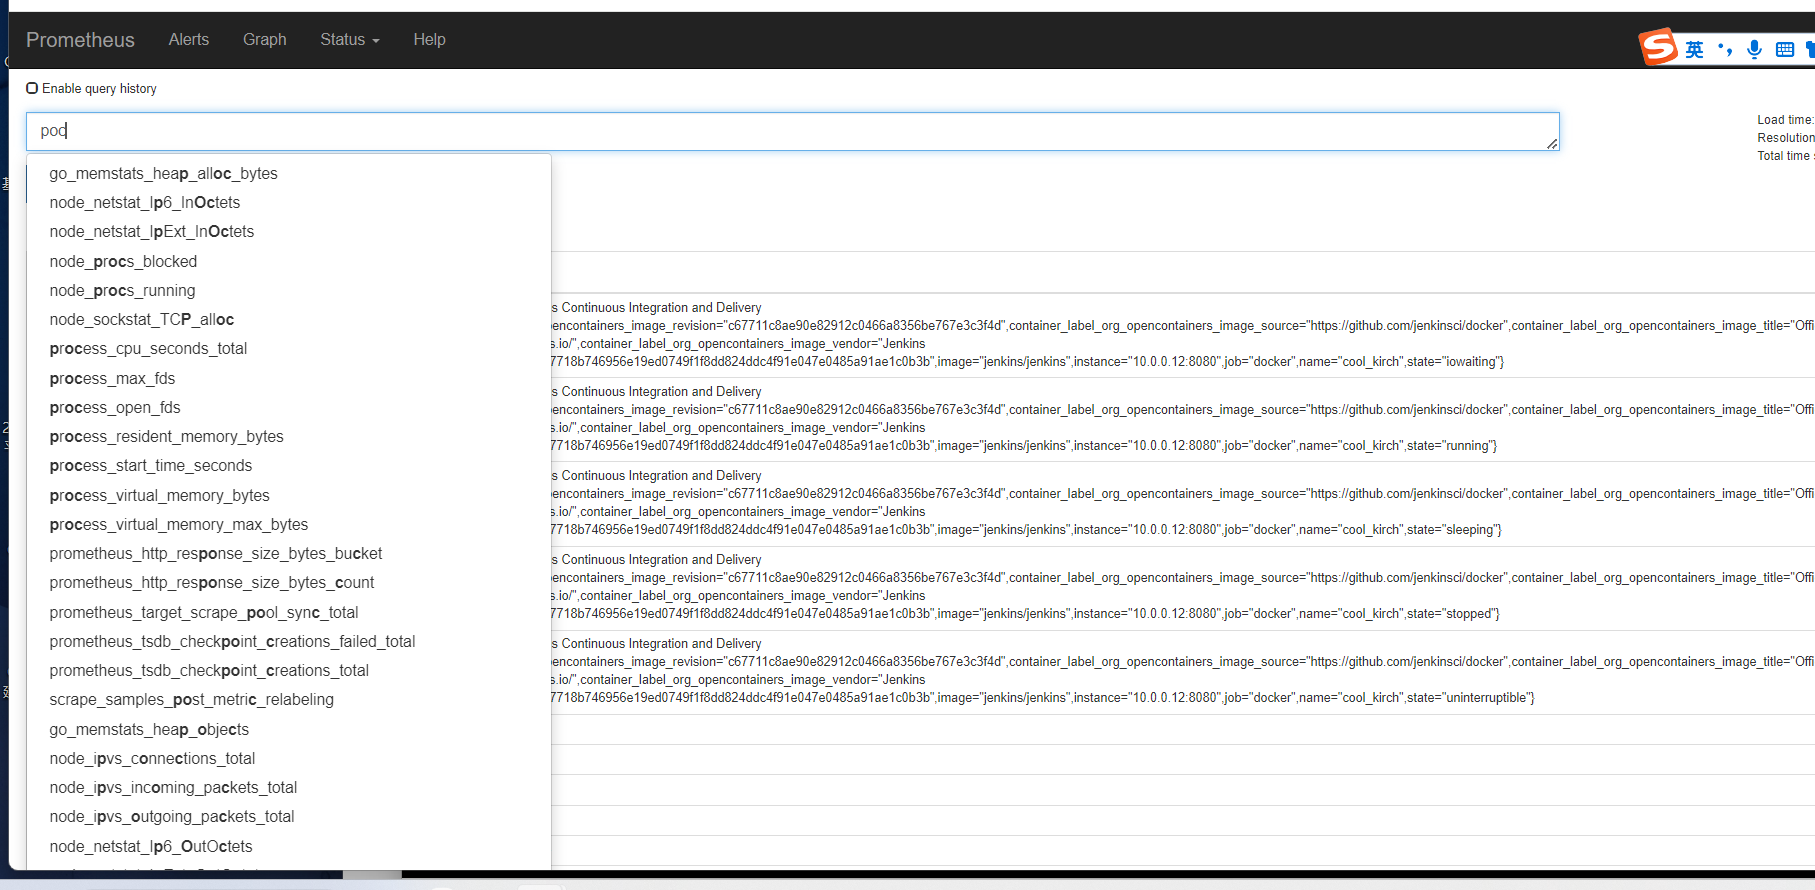
使用之后
[root@mcw03 prometheus]# tail -3 /etc/prometheus.yml
  - job_name: 'docker'
    static_configs:
    - targets: ['10.0.0.12:8080']
[root@mcw03 prometheus]# vim /etc/prometheus.yml
[root@mcw03 prometheus]# vim /etc/prometheus.yml
[root@mcw03 prometheus]# tail -7 /etc/prometheus.yml
  - job_name: 'docker'
    static_configs:
    - targets: ['10.0.0.12:8080']
    metric_relabel_configs:
    - source_labels: [__name__]
      regex: '(process_resident_memory_bytes;container_tasks_state)'
      action: keep
[root@mcw03 prometheus]# curl -X POST http://localhost:9090/-/reload
[root@mcw03 prometheus]#
使用之后,这里能看到指标,但是没有数据
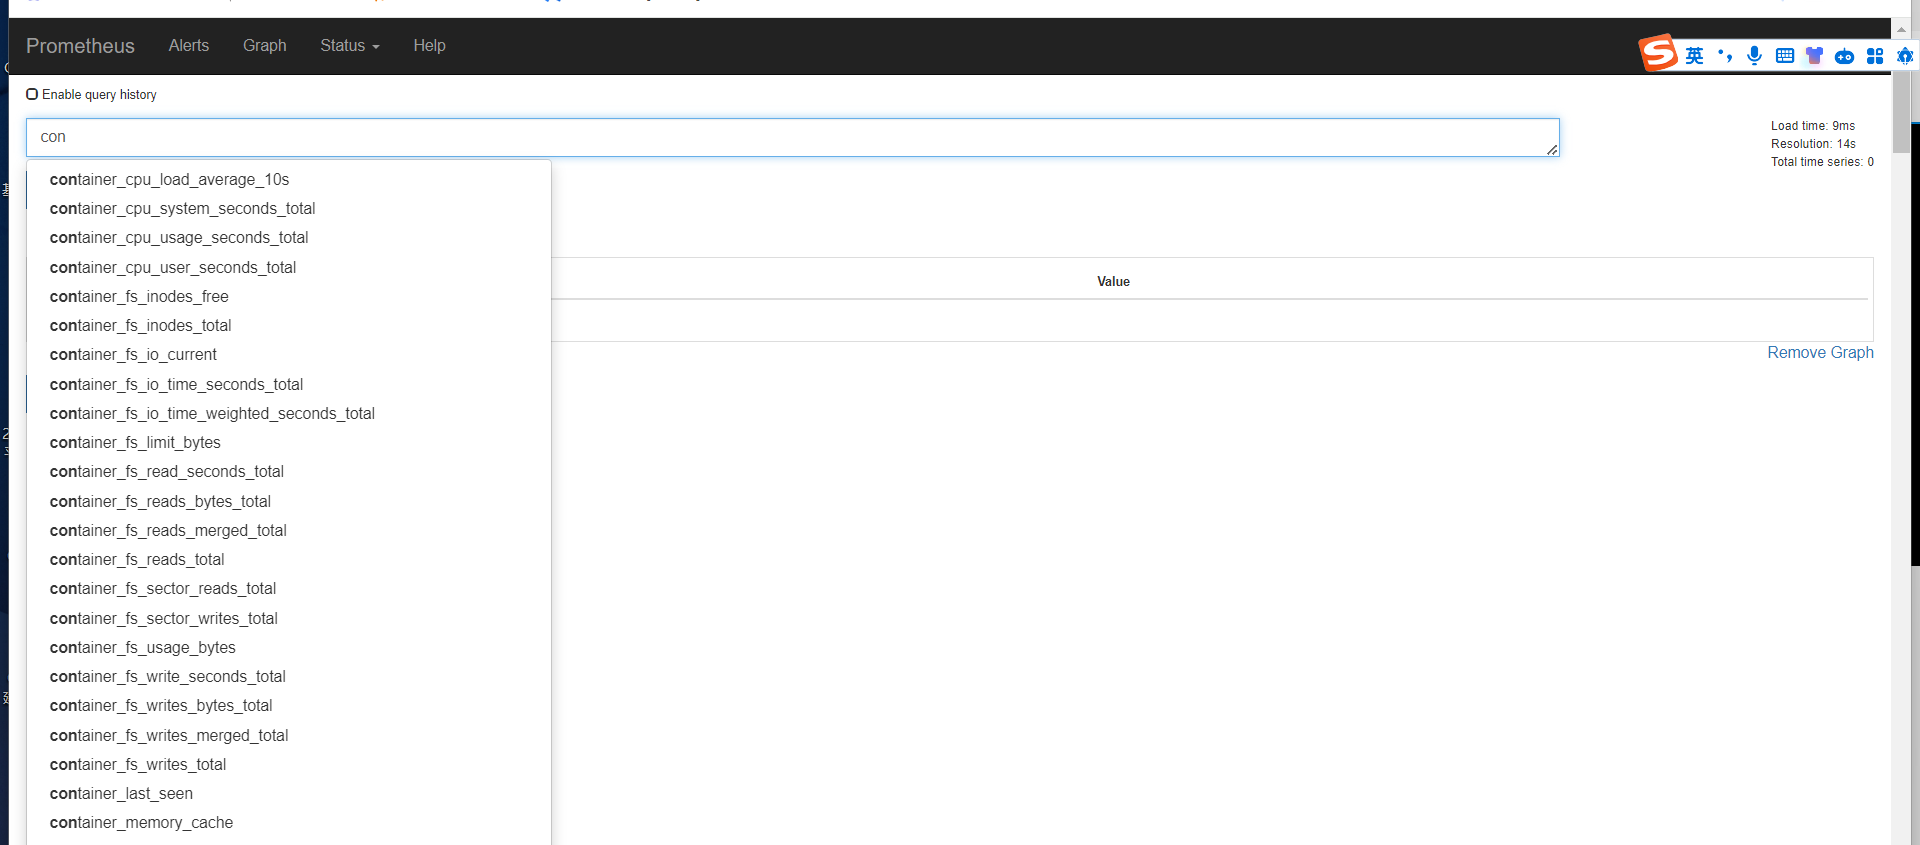
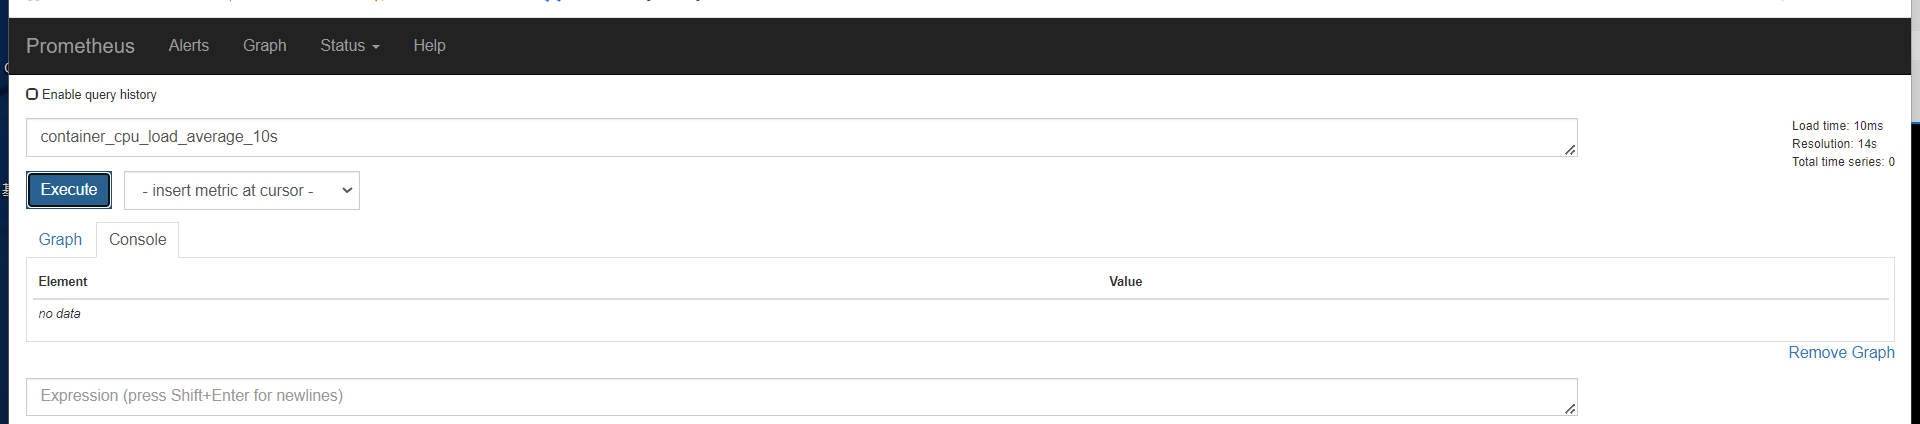
上面符合正则表达式的也没有数据
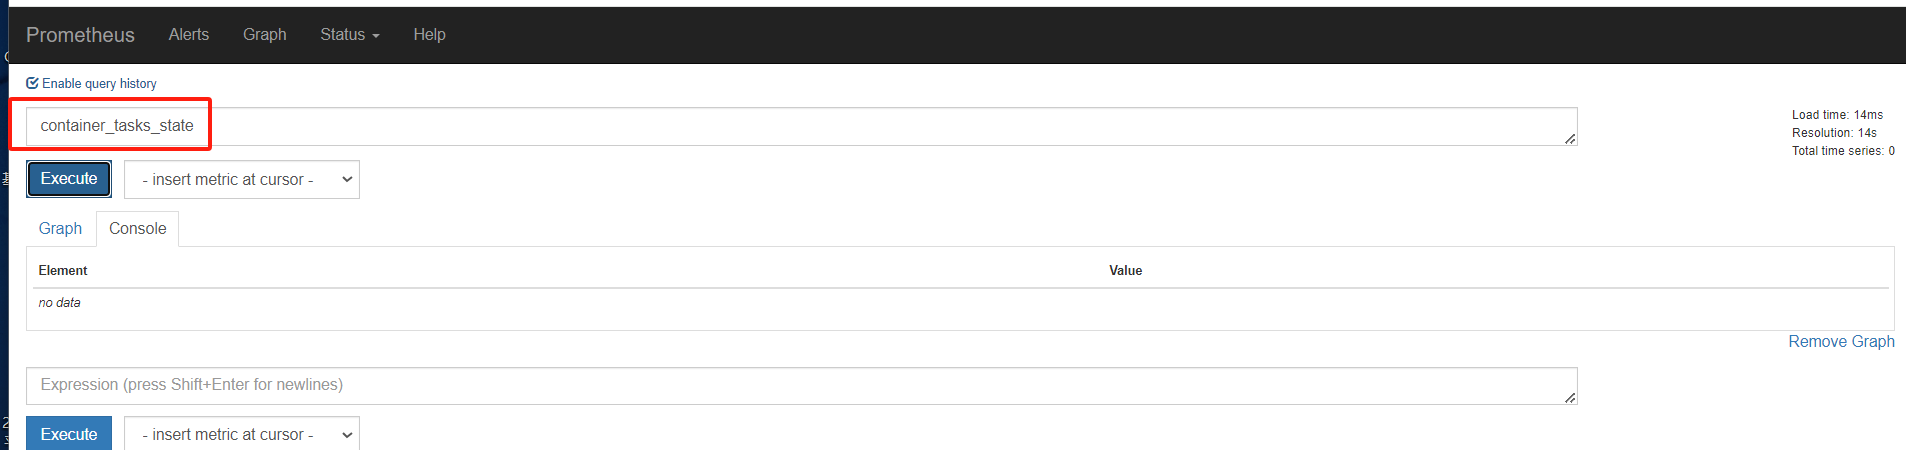
把正则分号换成|,是符合预期的,只保留正则匹配到的指标数值
[root@mcw03 prometheus]# tail -7 /etc/prometheus.yml
  - job_name: 'docker'
    static_configs:
    - targets: ['10.0.0.12:8080']
    metric_relabel_configs:
    - source_labels: [__name__]
      regex: '(process_resident_memory_bytes;container_tasks_state)'
      action: keep
[root@mcw03 prometheus]# vim /etc/prometheus.yml
[root@mcw03 prometheus]# tail -7 /etc/prometheus.yml
  - job_name: 'docker'
    static_configs:
    - targets: ['10.0.0.12:8080']
    metric_relabel_configs:
    - source_labels: [__name__]
      regex: '(process_resident_memory_bytes|container_tasks_state)'
      action: keep
[root@mcw03 prometheus]# curl -X POST http://localhost:9090/-/reload
[root@mcw03 prometheus]#
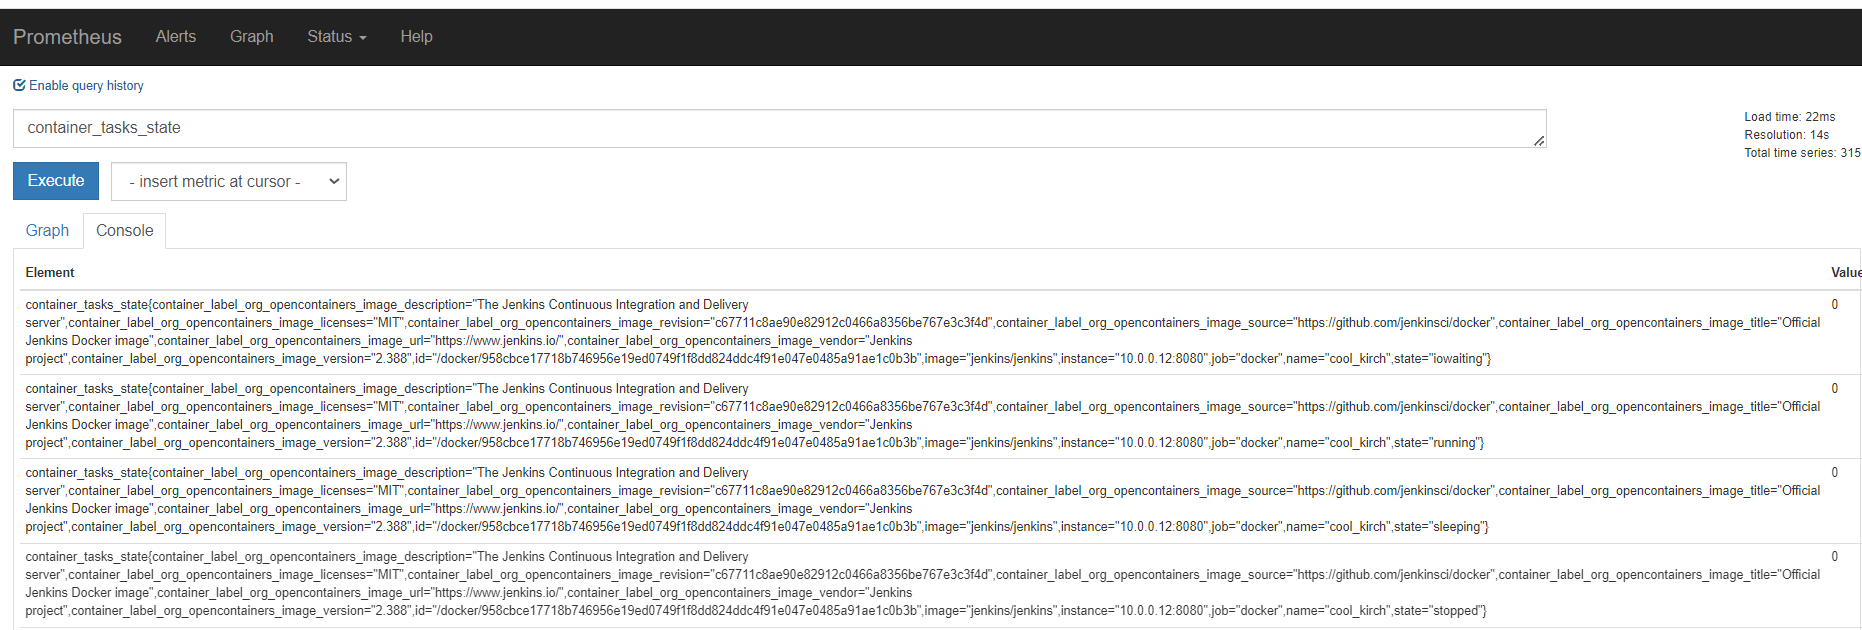
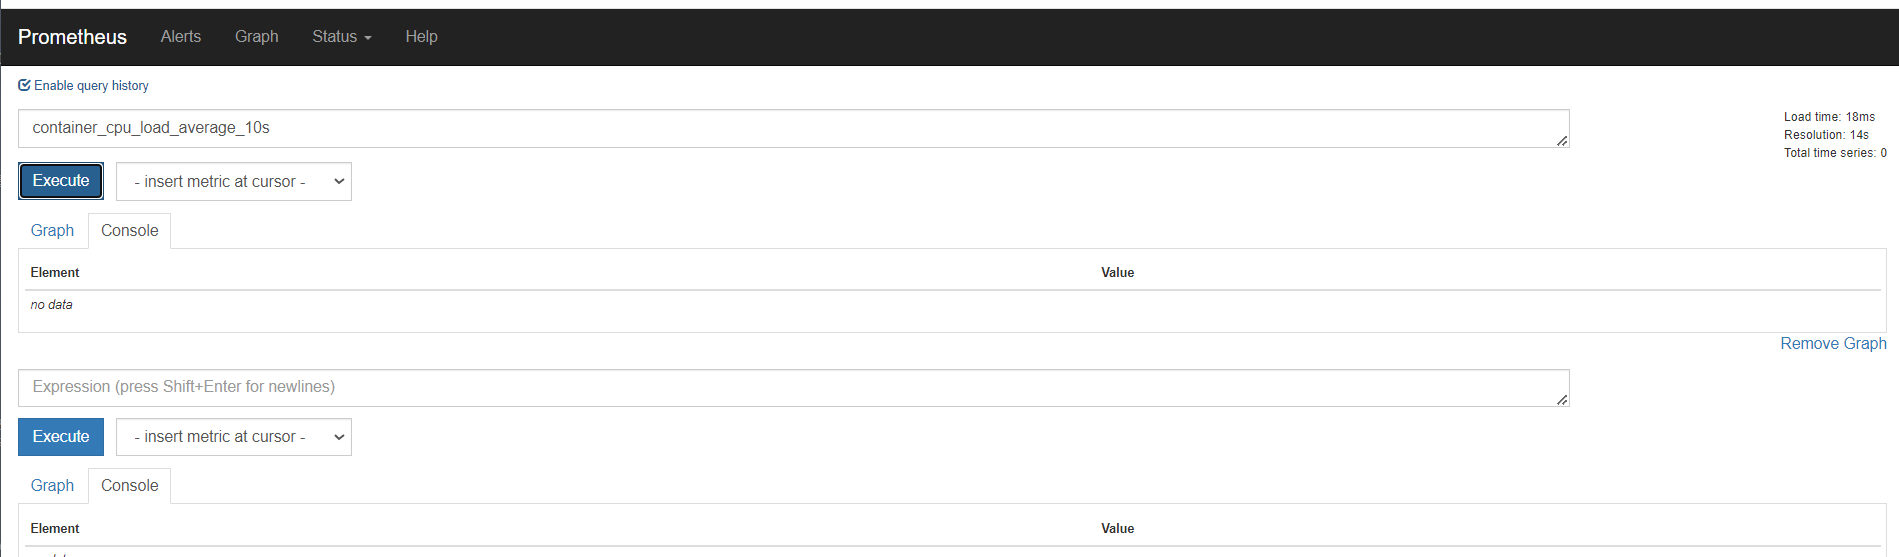
其它值只是这里不能获取到了,而不是没有采集
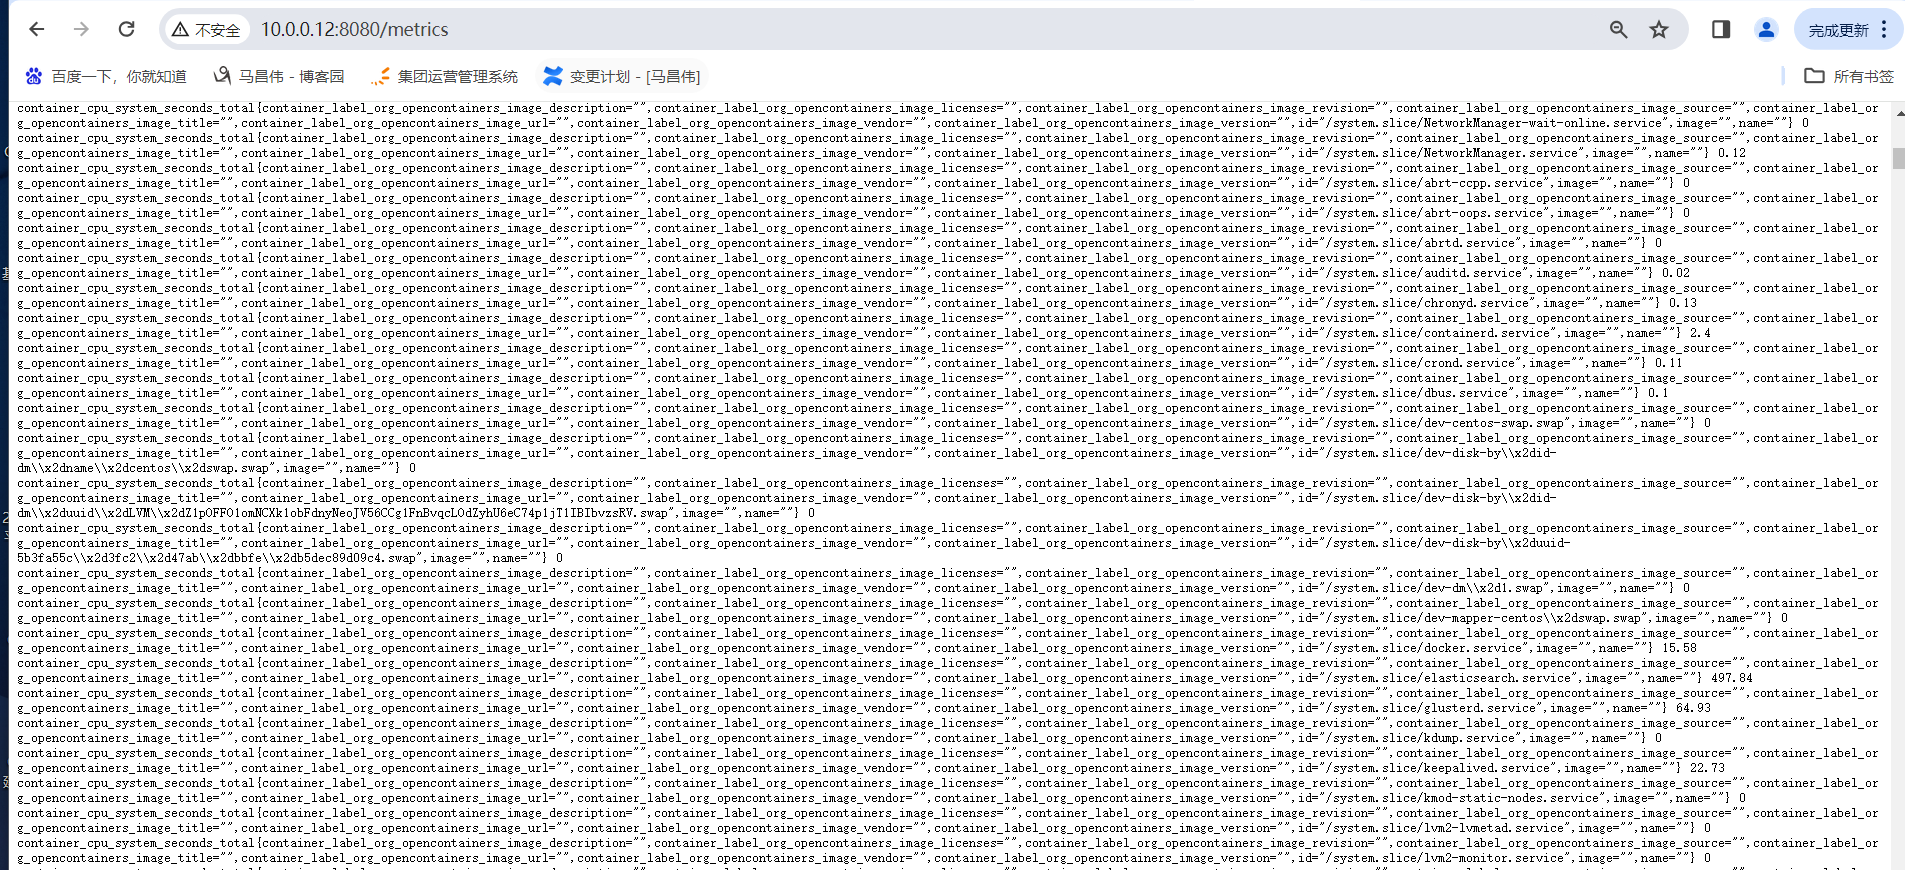
要想用逗号,在regex里分开多个指标的话,那就需要指定分隔符separator是逗号,不然不生效。默认用|就可以
[root@mcw03 prometheus]# tail -7 /etc/prometheus.yml
  - job_name: 'docker'
    static_configs:
    - targets: ['10.0.0.12:8080']
    metric_relabel_configs:
    - source_labels: [__name__]
      regex: '(process_resident_memory_bytes|container_tasks_state)'
      action: keep
[root@mcw03 prometheus]# curl -X POST http://localhost:9090/-/reload
[root@mcw03 prometheus]#
[root@mcw03 prometheus]#
[root@mcw03 prometheus]# vim /etc/prometheus.yml
[root@mcw03 prometheus]# tail -7 /etc/prometheus.yml
    static_configs:
    - targets: ['10.0.0.12:8080']
    metric_relabel_configs:
    - source_labels: [__name__]
      separator: ','
      regex: '(process_resident_memory_bytes,container_tasks_state)'
      action: keep
[root@mcw03 prometheus]# curl -X POST http://localhost:9090/-/reload
[root@mcw03 prometheus]#
恢复去掉keep配置
[root@mcw03 prometheus]# tail -7 /etc/prometheus.yml
  - job_name: 'docker'
    static_configs:
    - targets: ['10.0.0.12:8080']
    metric_relabel_configs:
    - source_labels: [__name__]
      regex: '(process_resident_memory_bytes;container_tasks_state)'
      action: keep
[root@mcw03 prometheus]# vim /etc/prometheus.yml
[root@mcw03 prometheus]# tail -3 /etc/prometheus.yml
  - job_name: 'docker'
    static_configs:
    - targets: ['10.0.0.12:8080']
[root@mcw03 prometheus]# tail -4 /etc/prometheus.yml
    - targets: ['10.0.0.13:9104']
  - job_name: 'docker'
    static_configs:
    - targets: ['10.0.0.12:8080']
[root@mcw03 prometheus]# curl -X POST http://localhost:9090/-/reload
[root@mcw03 prometheus]#
浏览器表达式又能找到数据了
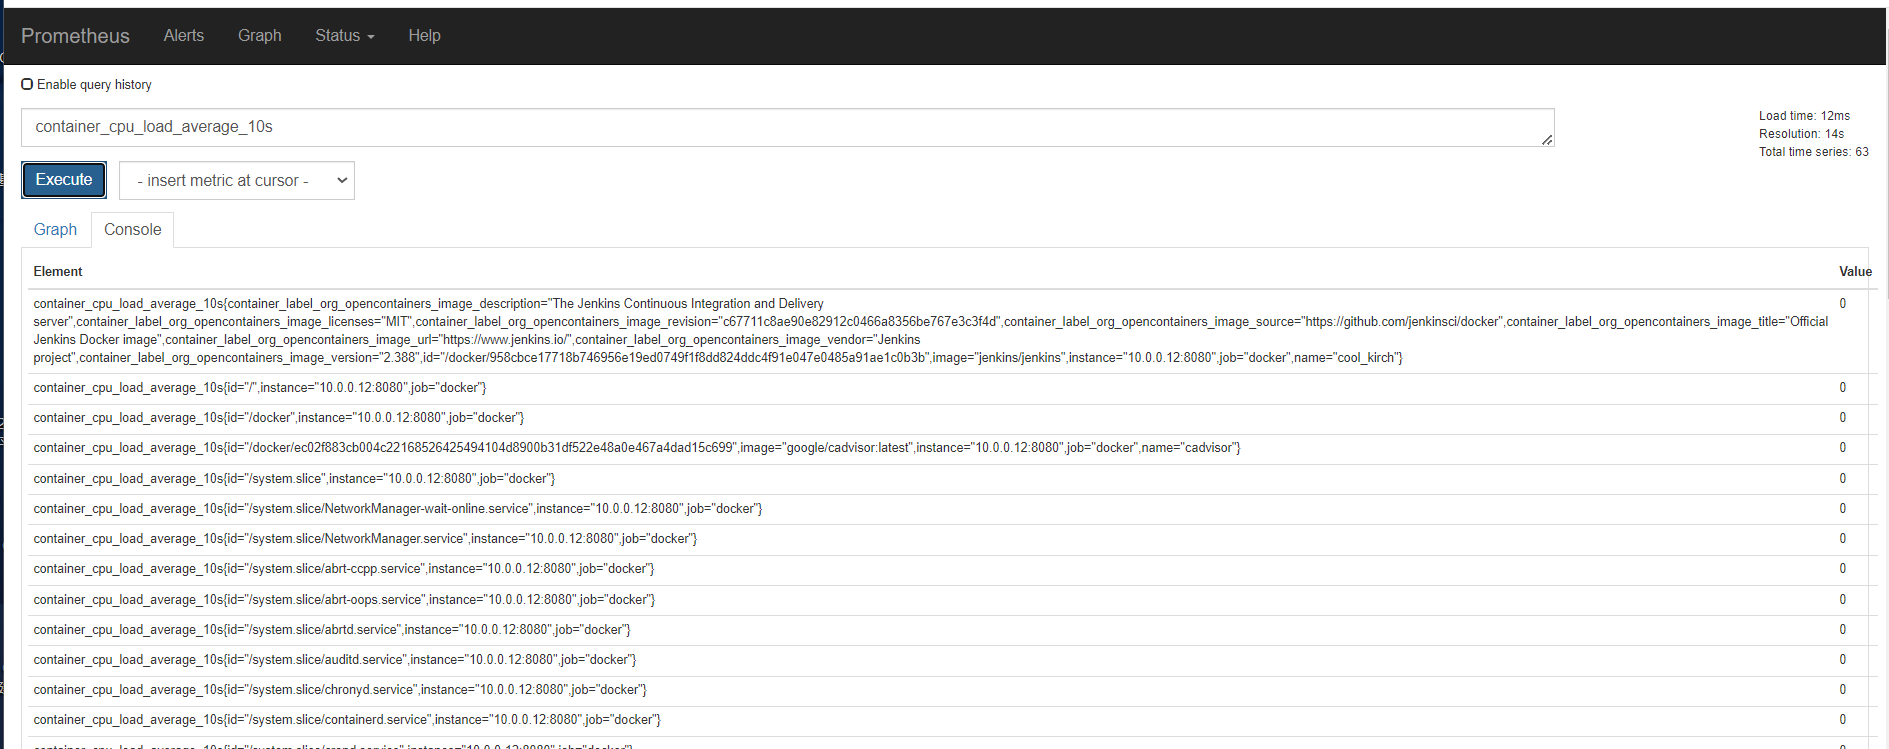
替换标签值
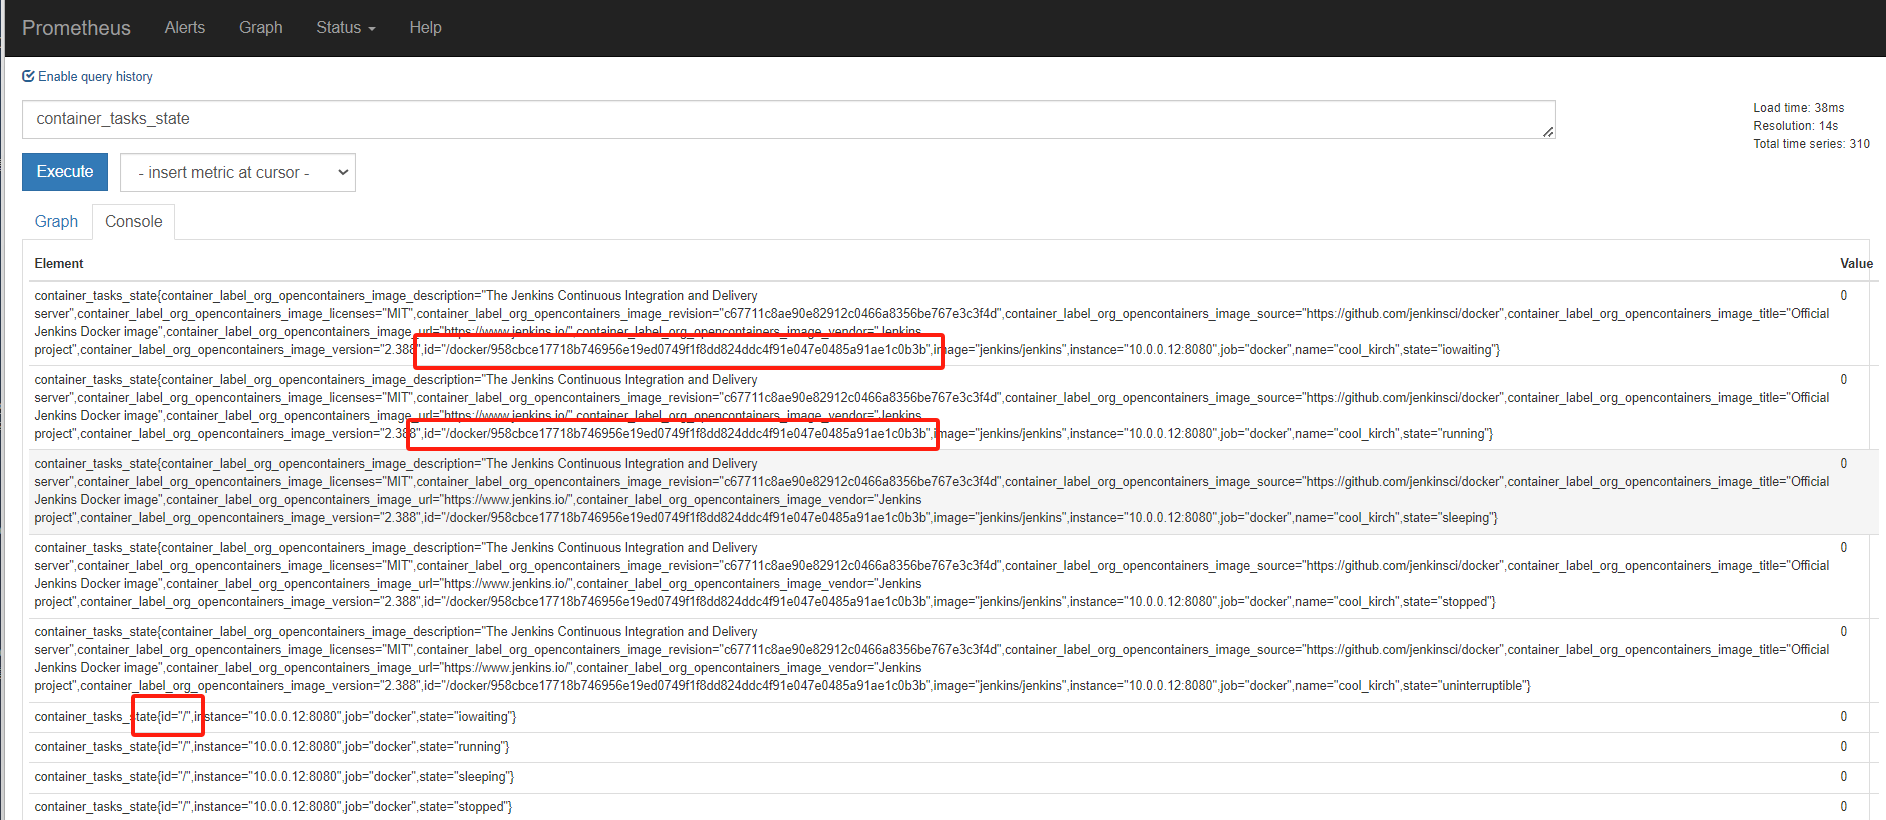
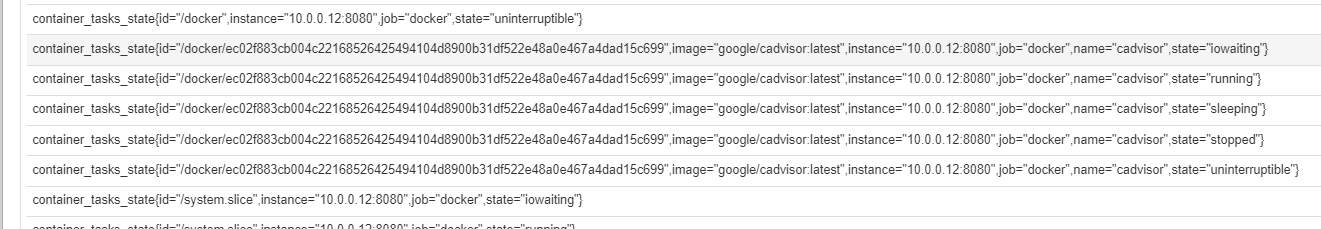
cadvisor指标里面有标签id,包含正在运行的进程名称,如果进程是容器,那么id是容器id的长字符串
[root@mcw02 ~]# docker ps
CONTAINER ID   IMAGE                    COMMAND                  CREATED         STATUS      PORTS                                       NAMES
ec02f883cb00   google/cadvisor:latest   "/usr/bin/cadvisor -…"   3 days ago      Up 3 days   0.0.0.0:8080->8080/tcp, :::8080->8080/tcp   cadvisor
958cbce17718   jenkins/jenkins          "/usr/bin/tini -- /u…"   12 months ago   Up 3 days   8080/tcp, 50000/tcp                         cool_kirch
[root@mcw02 ~]#
上面的指标中容器id太长了,替换为docker ps获取的容器短id
操作前
[root@mcw03 prometheus]# tail -3 /etc/prometheus.yml
  - job_name: 'docker'
    static_configs:
    - targets: ['10.0.0.12:8080']
[root@mcw03 prometheus]#
操作后,默认action是替换,但是加不加好像这里都没有生效,有时间再研究下
意思是源标签中带有id的标签,使用正则匹配到标签,正则第一个括号里面的是变量1,指定替换的是变量1,然后目标标签也就是用哪个标签去替换变量1 这里是用容器id去替换,行为是替换,默认是替换
[root@mcw03 prometheus]# tail -8 /etc/prometheus.yml
  - job_name: 'docker'
    static_configs:
    - targets: ['10.0.0.12:8080']
    metric_relabel_configs:
    - source_labels: [id]
      regex: '/docker/([a-z0-9]+);'
      replacement: '$1'
      target_label: container_id
[root@mcw03 prometheus]# curl -X POST http://localhost:9090/-/reload
[root@mcw03 prometheus]# vim /etc/prometheus.yml
[root@mcw03 prometheus]# tail -9 /etc/prometheus.yml
  - job_name: 'docker'
    static_configs:
    - targets: ['10.0.0.12:8080']
    metric_relabel_configs:
    - source_labels: [id]
      regex: '/docker/([a-z0-9]+);'
      replacement: '$1'
      target_label: container_id
      action: replace
[root@mcw03 prometheus]# curl -X POST http://localhost:9090/-/reload
[root@mcw03 prometheus]#
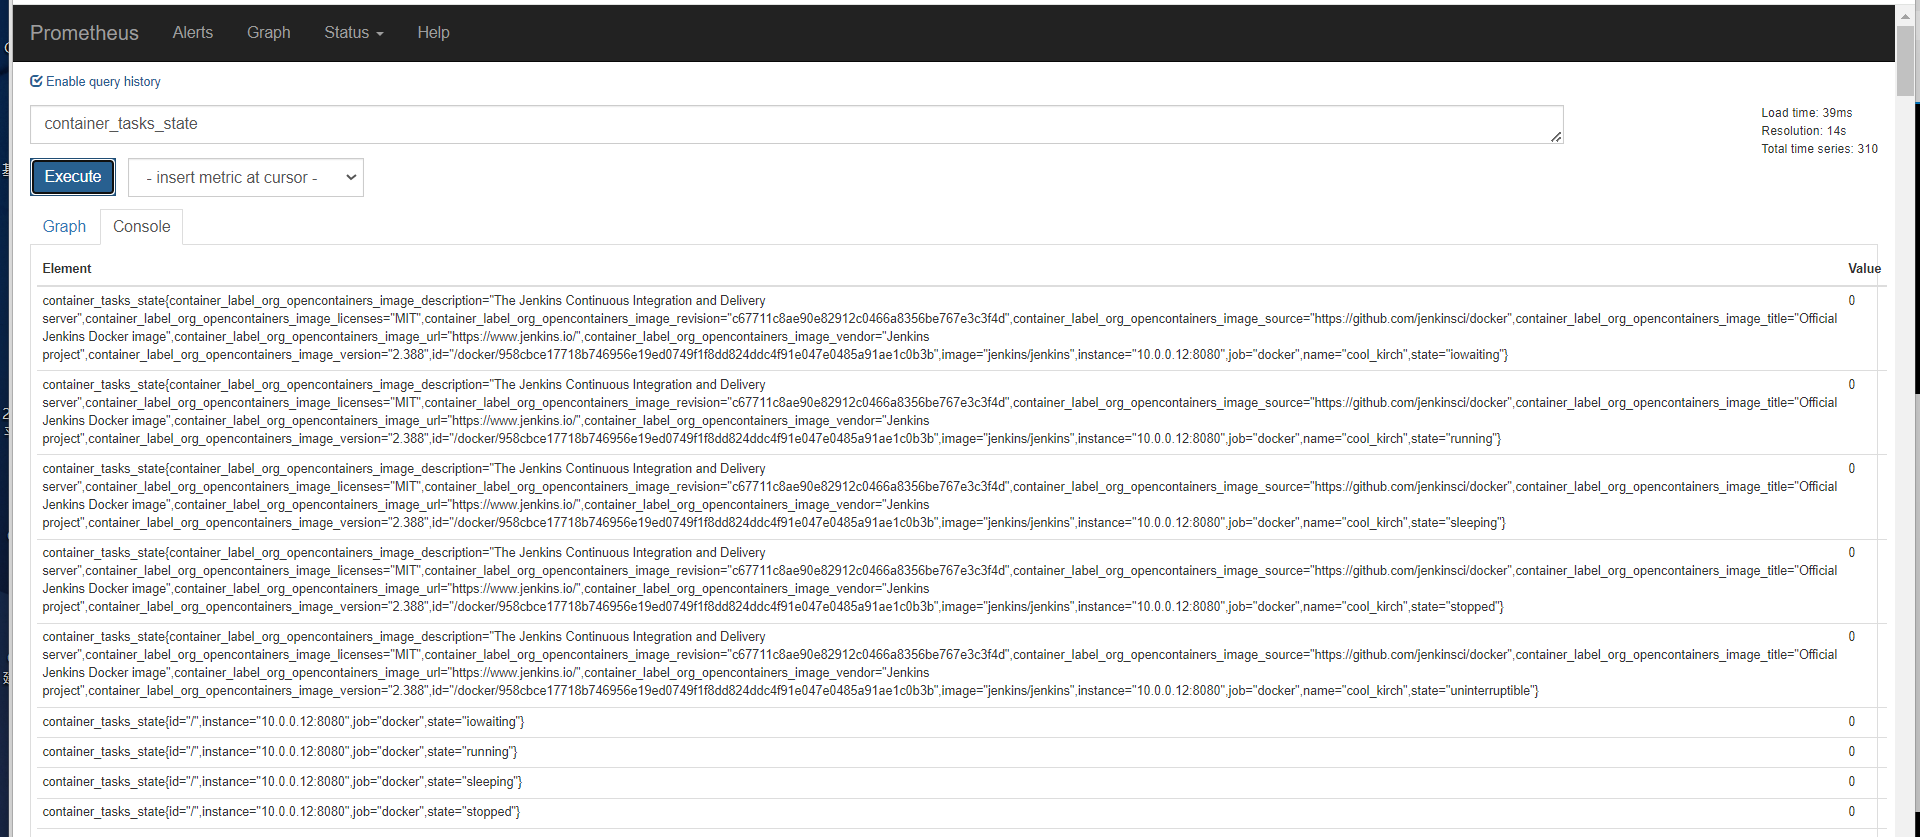
删除标签,隐藏敏感信息,简化时间序列
删除下面标签
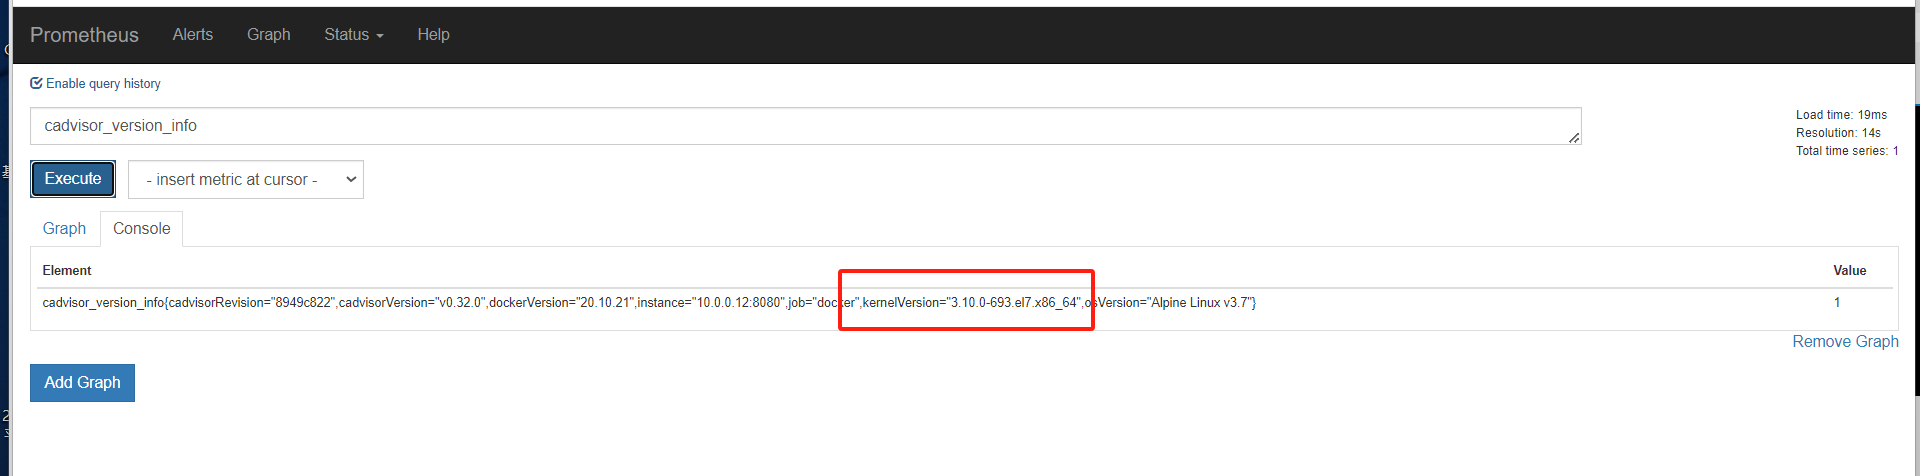
删除之前配置
[root@mcw03 prometheus]# tail -4 /etc/prometheus.yml
    - targets: ['10.0.0.13:9104']
  - job_name: 'docker'
    static_configs:
    - targets: ['10.0.0.12:8080']
[root@mcw03 prometheus]#
删除配置
[root@mcw03 prometheus]# vim /etc/prometheus.yml
[root@mcw03 prometheus]# tail -6 /etc/prometheus.yml
  - job_name: 'docker'
    static_configs:
    - targets: ['10.0.0.12:8080']
    metric_relabel_configs:
    - regex: 'kernelVersion'
      action: labeldrop
[root@mcw03 prometheus]# curl -X POST http://localhost:9090/-/reload
[root@mcw03 prometheus]#
如下,执行重载配置后,先是变成两条。后来旧的那条就看不到了,内核版本标签已经被删除
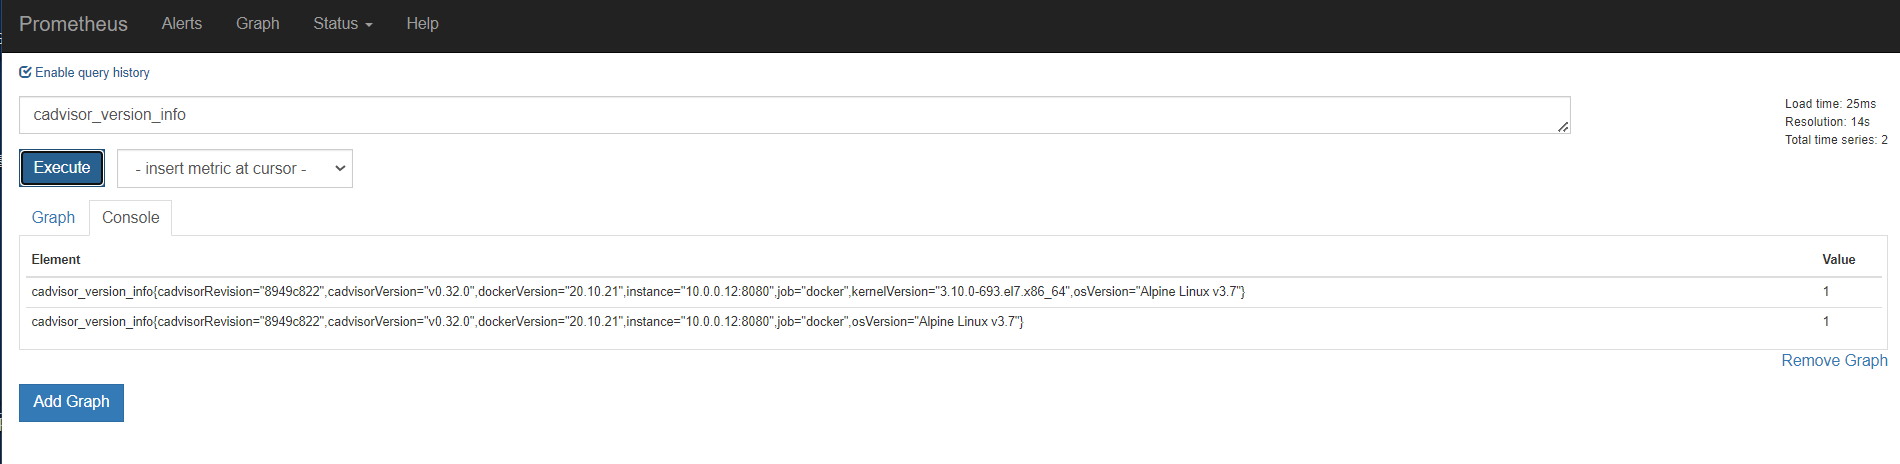
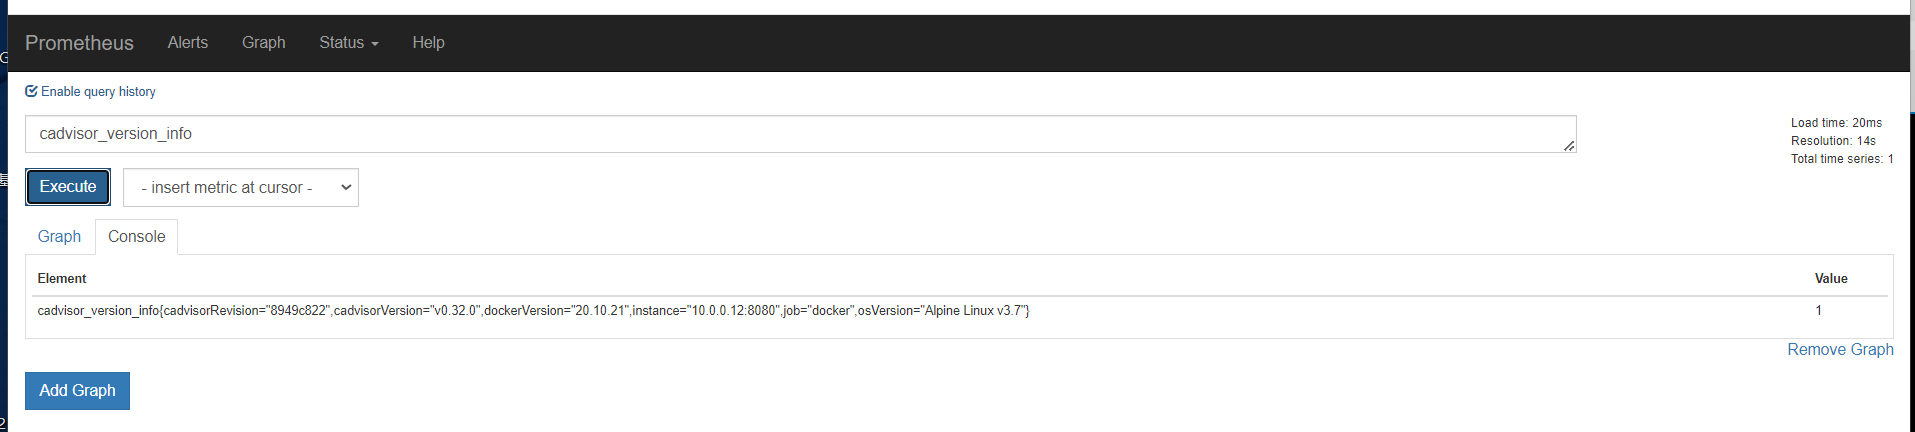
node exporter和cadvisor指标
@ use方法
cpu使用率avg 分组求平均值
avg() by (分组)
下面是哪个cpu,哪个监控的节点,哪个作业,以及采集是哪个cpu的模式,是用户态还是系统态等等,是多少s时间,后面
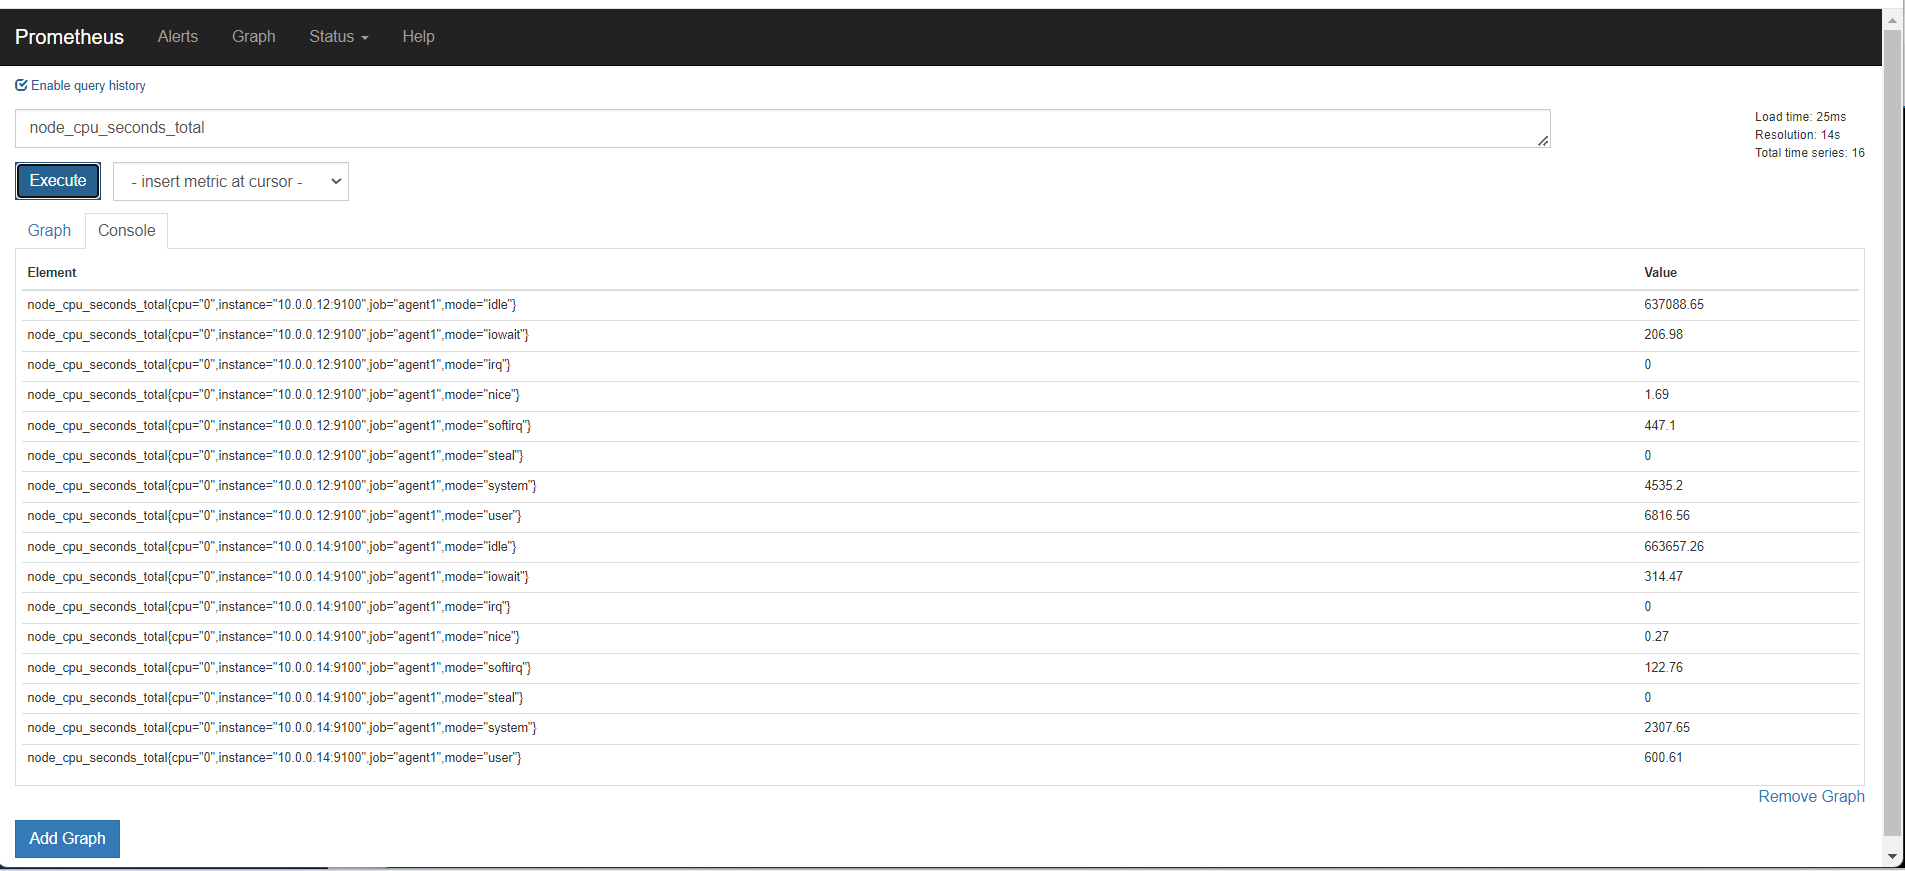
node_cpu_seconds_total{cpu="0",instance="10.0.0.12:9100",job="agent1",mode="idle"}
下面计算每种cpu模式的每秒使用率,使用ireate
irate(node_cpu_seconds_total[5m]) #从node作业返回每个cpu在没咋模式下的列表,表示5分钟范围内的每秒速率。
下面每一条都是,某个机器的某个cpu的某个模式下,最近5分钟内的平均使用率。也就是这个返回的是所有机器的所有cpu的每个模式下最近5分钟内的平均使用率(使用占比)
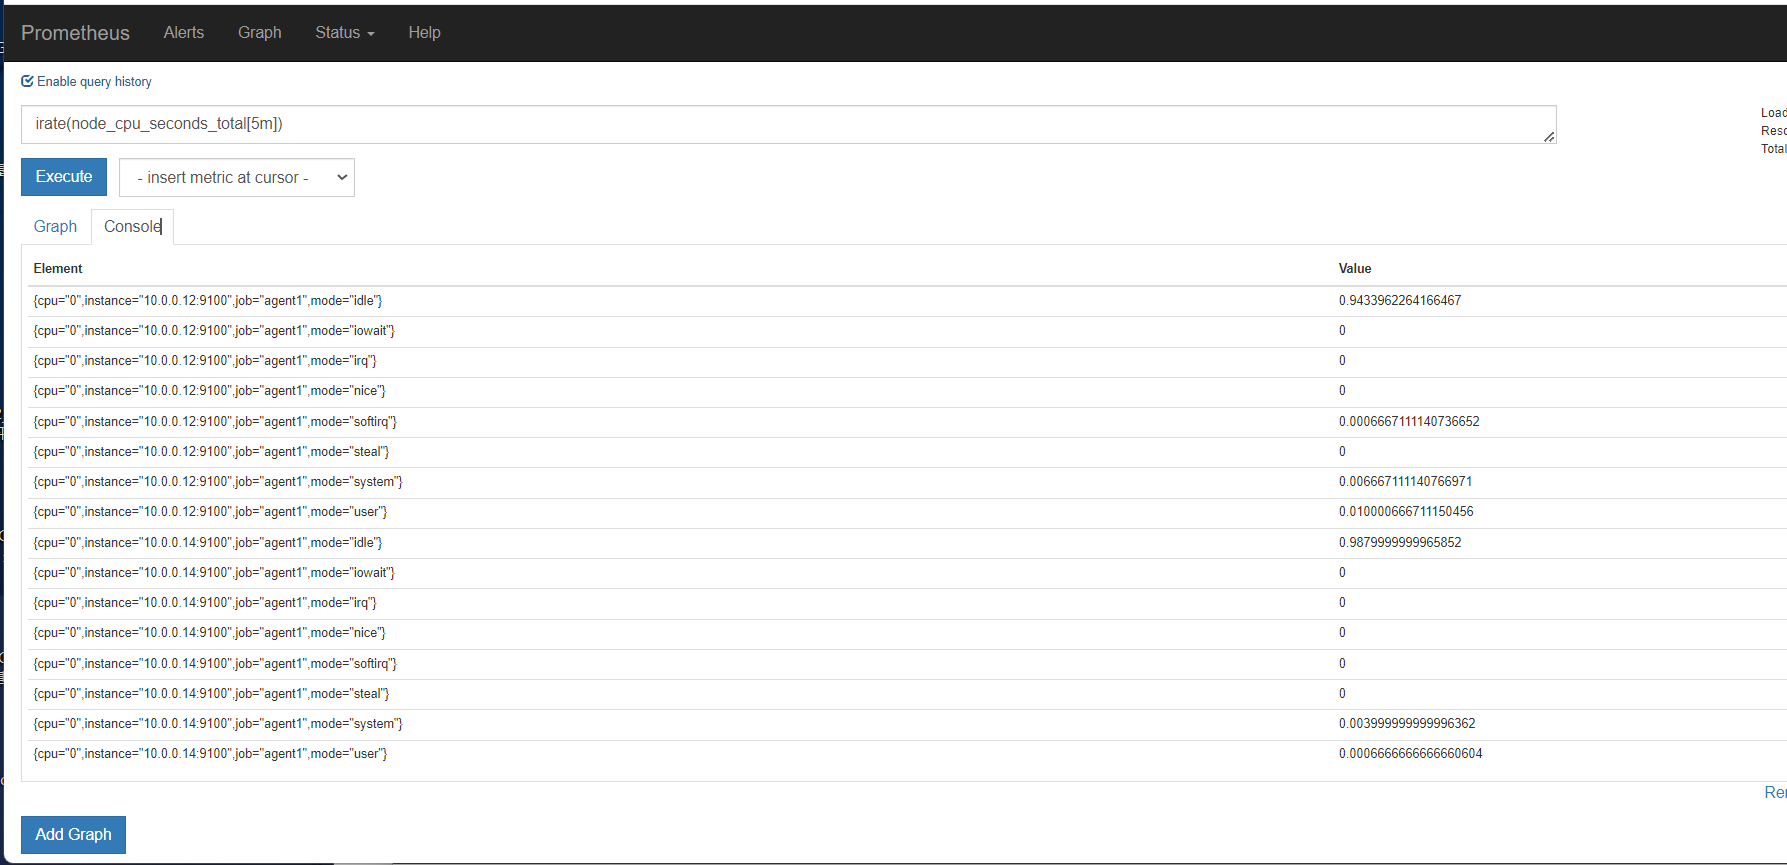
我们需要的是每台主机的平均cpu使用率。所以还需要改。这样就是需要根据主机进行分组,将每个主机的所有cpu所有模式的元素聚合起来,求平均值。这里也就是根据主机分组聚合求平均值
irate(node_cpu_seconds_total[5m])已经返回的是包含所有主机,所有cpu,每个cpu所有模式的近5分钟内使用率元素列表了
avg(irate(node_cpu_seconds_total[5m])) by (instance) #这样就是返回,根据主机分组,将每个主机的所有cpu,每个cpu的模式下的使用率,求它们的平均值。这样就是每个组的平均值出来了,但是这样显然是不对的求法。‘
我们 应该求单个主机的所有cpu的单个模式的使用率的平均值。作为某个主机的什么模式的使用率
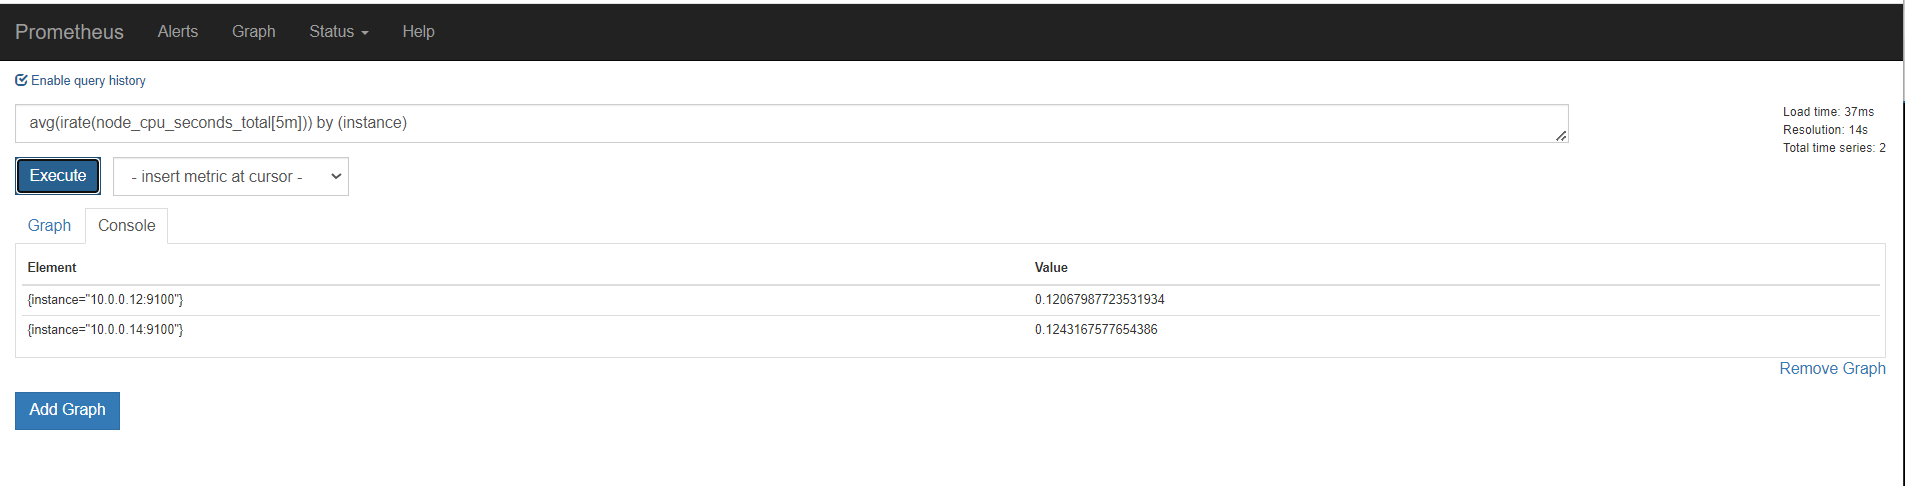
下面我们就区分,只要idle模式的
avg(irate(node_cpu_seconds_total{mode='idle'}[5m])) by (instance) #下面就是获取所有主机的idle模式的值,通过标签进行筛选。返回的是 所有主机的,是根据主机进行分组统计获取平均值。获取的是单个主机拥有的所有cpu的单个模式idle的近5分钟内的cpu平均使用率。irete就是求平均使用率的,这里求的是idle的使用率。而idle,已经通过主机分组过了。这里的idle是每个机器的所有cpu的返回元素列表。求平均值,求得就是每个机器所有cpu的idle的近5分钟平均使用率
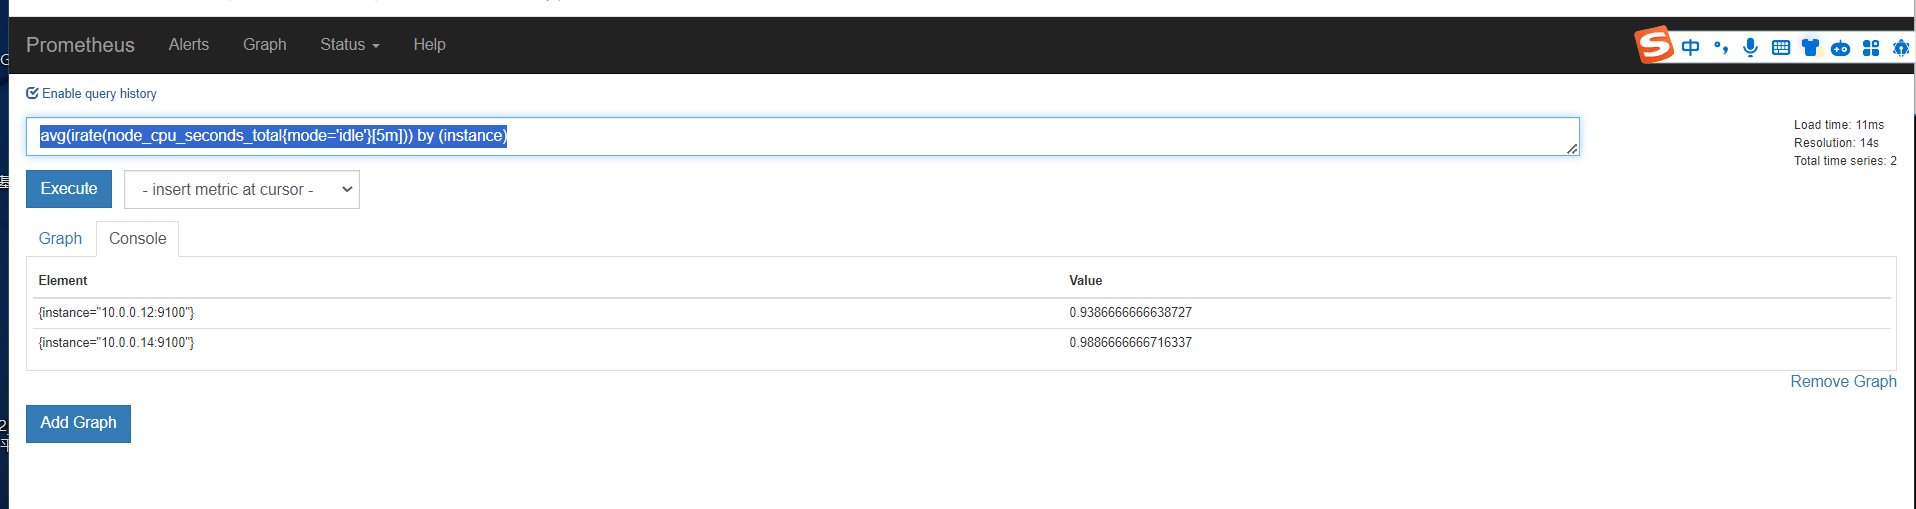
*100.将值成为百分数值,95%。这里将前面每个的统计值乘一百倍,是放在分组后面进行乘法计算。这样获取到每个机器所有cpu的idle近5分钟内的平均使用率的,所有主机列表以及使用率。那么用100-去这个值就是cpu使用率了。idle是空闲率。100-空闲率就是cpu使用率,那么该怎么去减去 呢
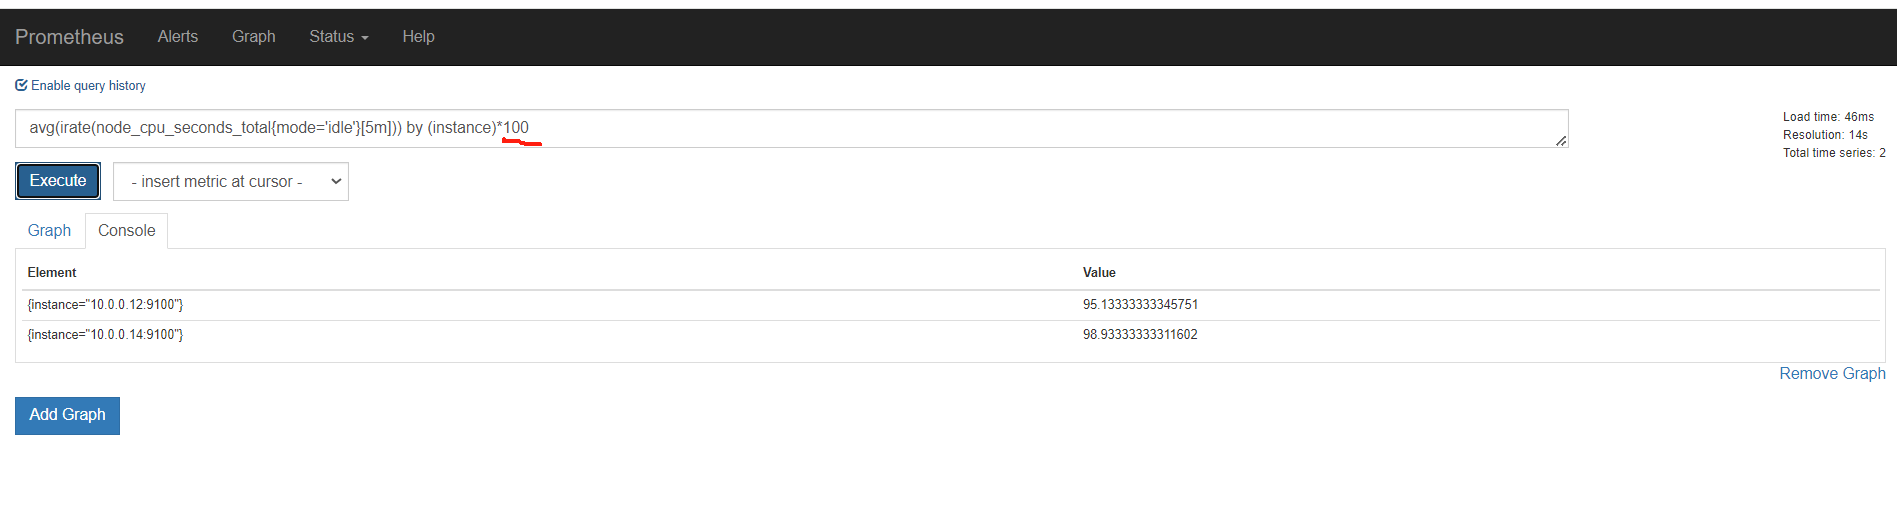
100 - avg(irate(node_cpu_seconds_total{mode='idle'}[5m])) by (instance)*100 #如下,将分组聚合是看做一个整体的,100直接对分组聚合这个整体的返回值做运算去减,这样就获得所有机器的cpu使用率了。100是cpu总共的,后面分组统计*100是cpu空闲率的。
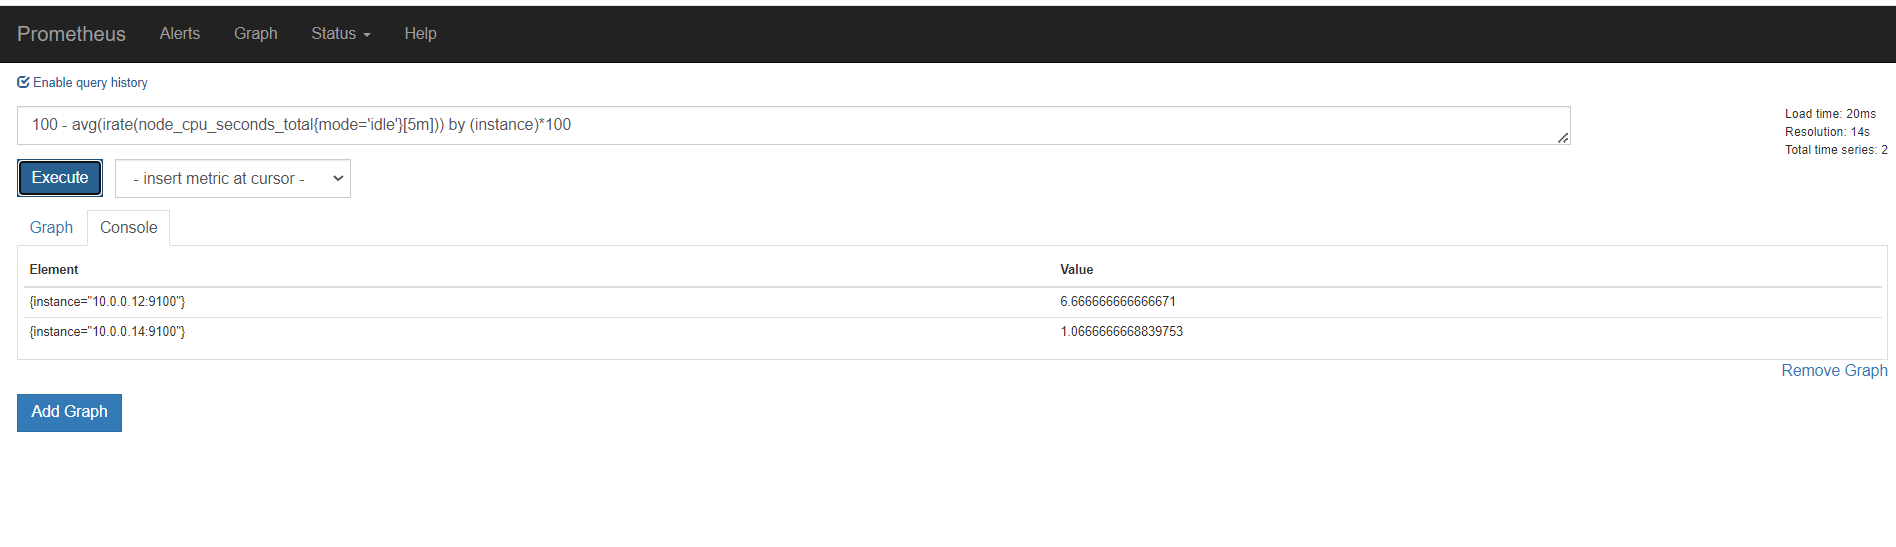
我现在又只想要某个job下的所有主机cpu使用率。此时可以标签筛选
100 - avg(irate(node_cpu_seconds_total{job='agent1',mode='idle'}[5m])) by (instance)*100
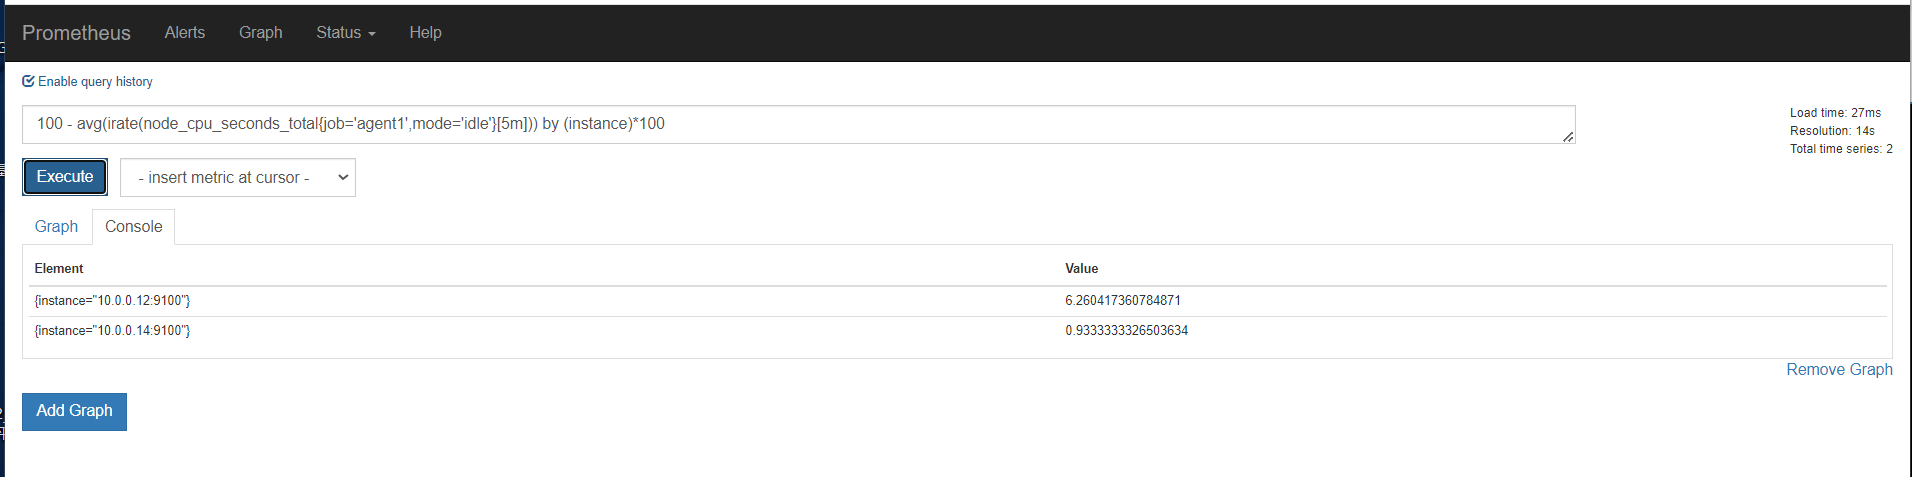
因为我们的这个job下,就是这两台。所以结果没有变。如果是多个 job。那么就会区分开来只有这个job的了
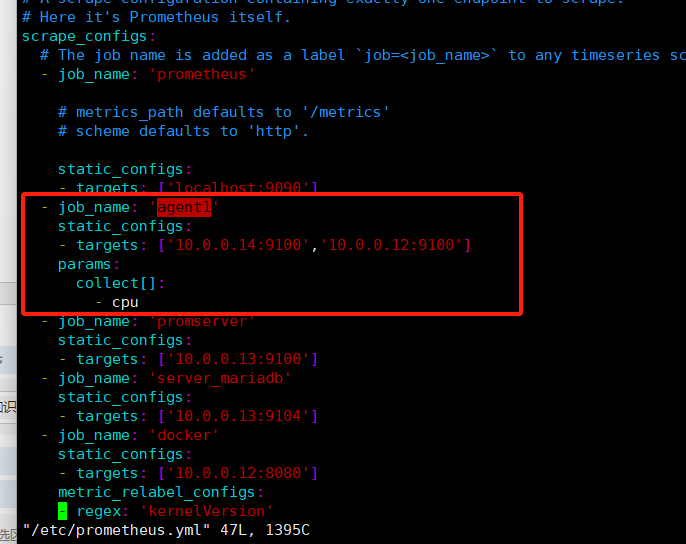
我们还可以看图形,我们做好之后的图形。该job下的每个主机的近5分钟内的平均cpu使用率出来了
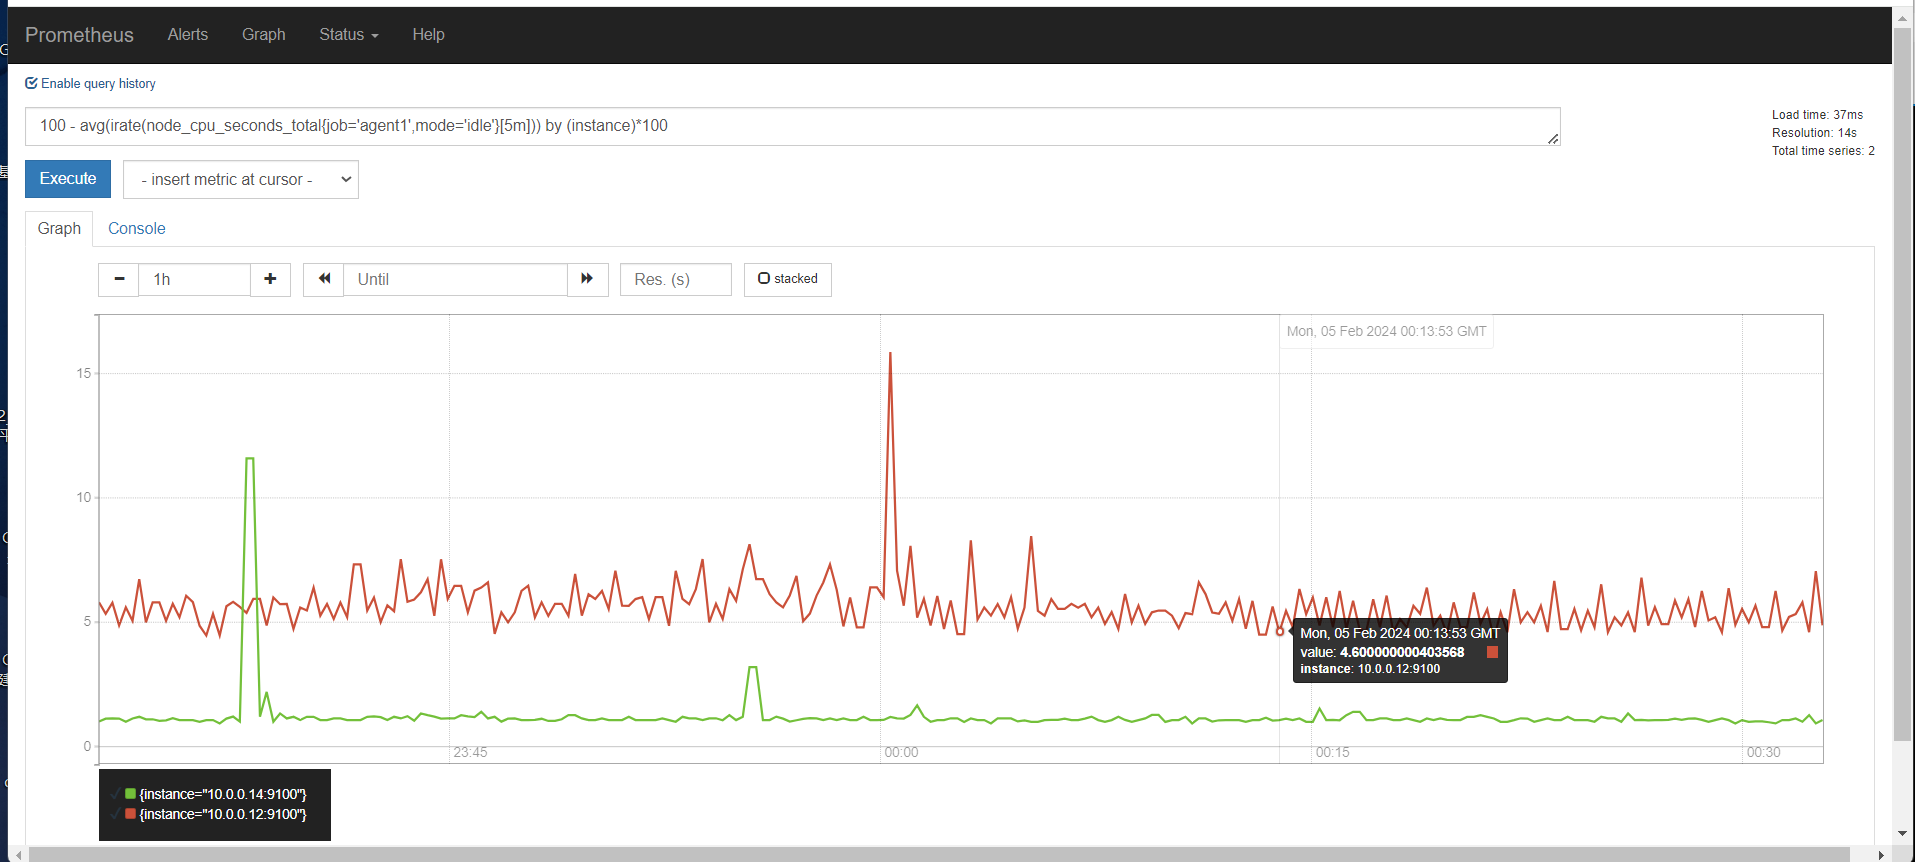
cpu饱和度count 分组统计个数
count by(分组)()
给mcw04机器加个cpu
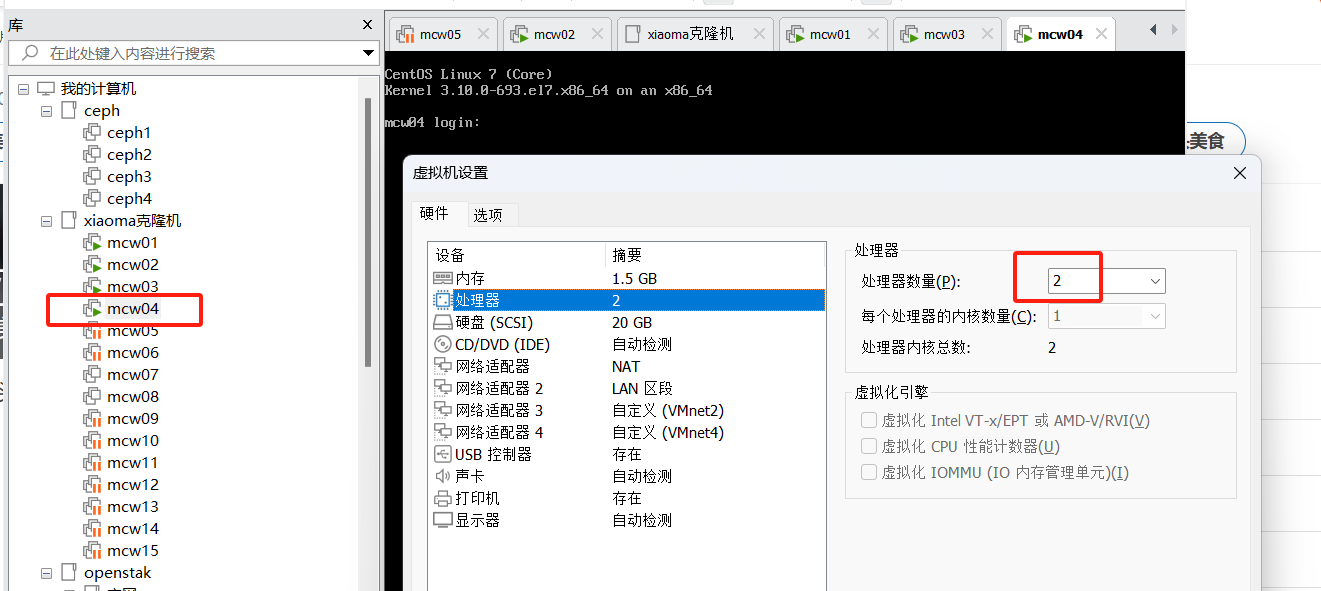
指标没有数据
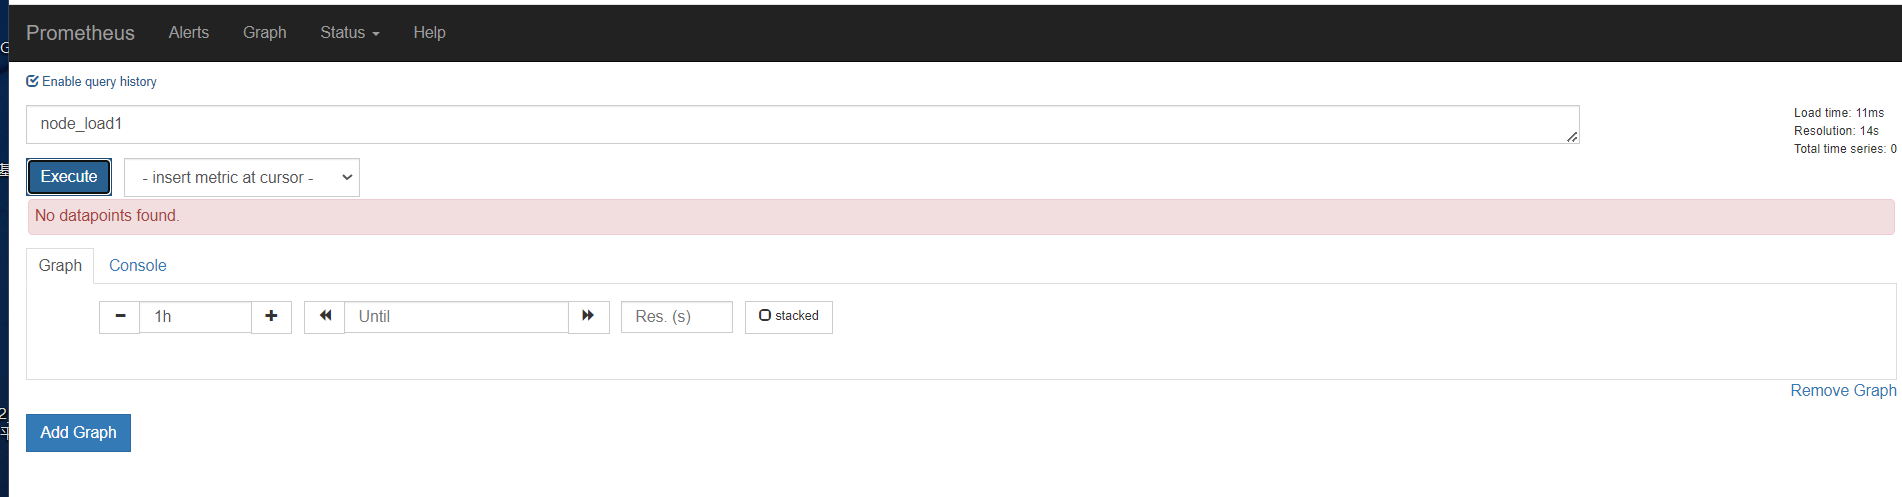
因为设置了只收集了cpu,去掉之后重载
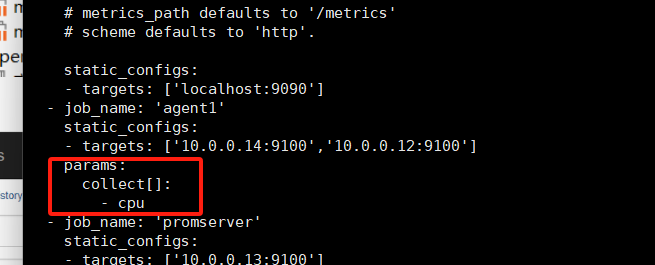
1分钟平均负载
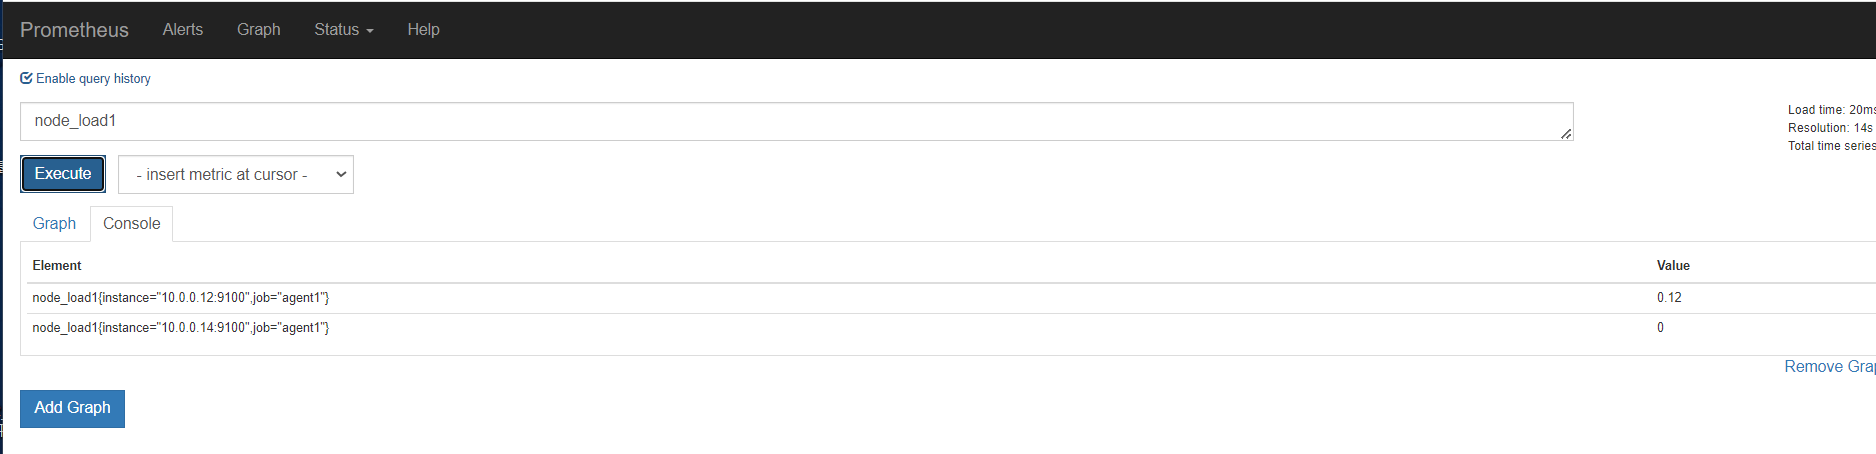
5分钟平均负载
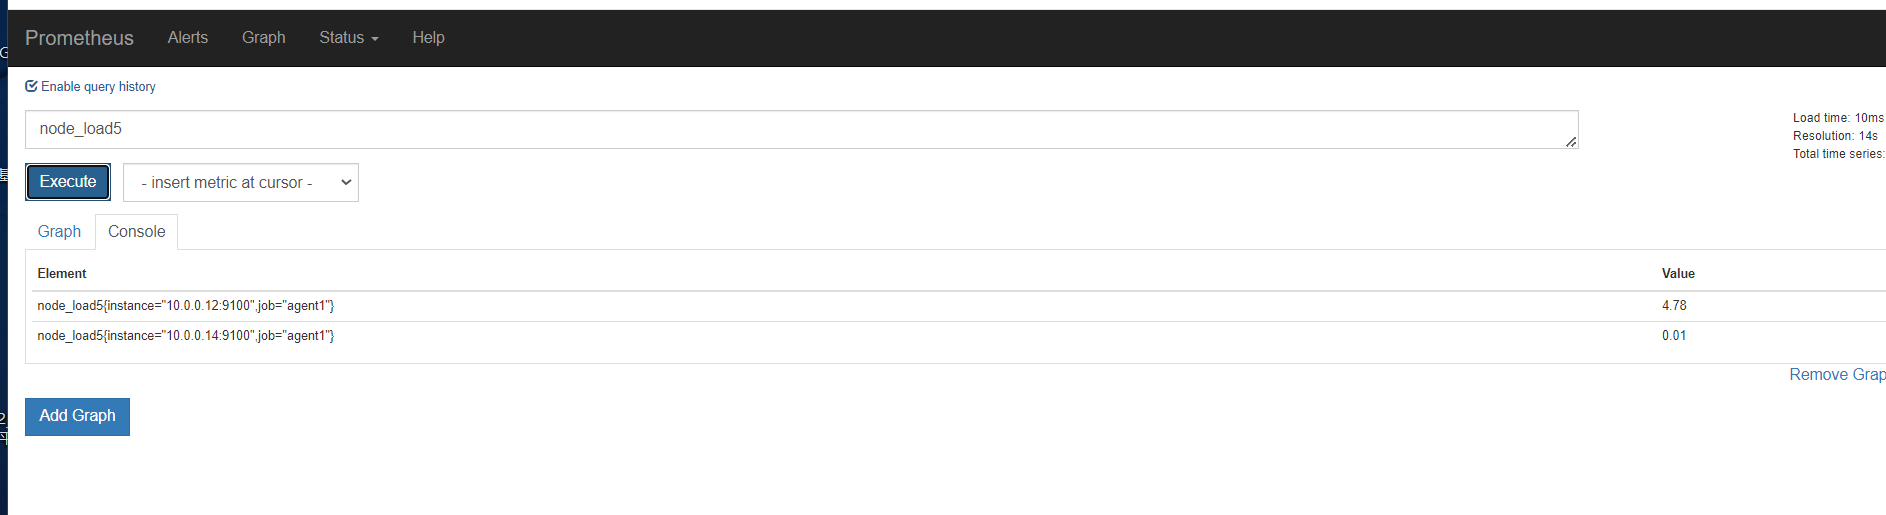
15分钟平均负载
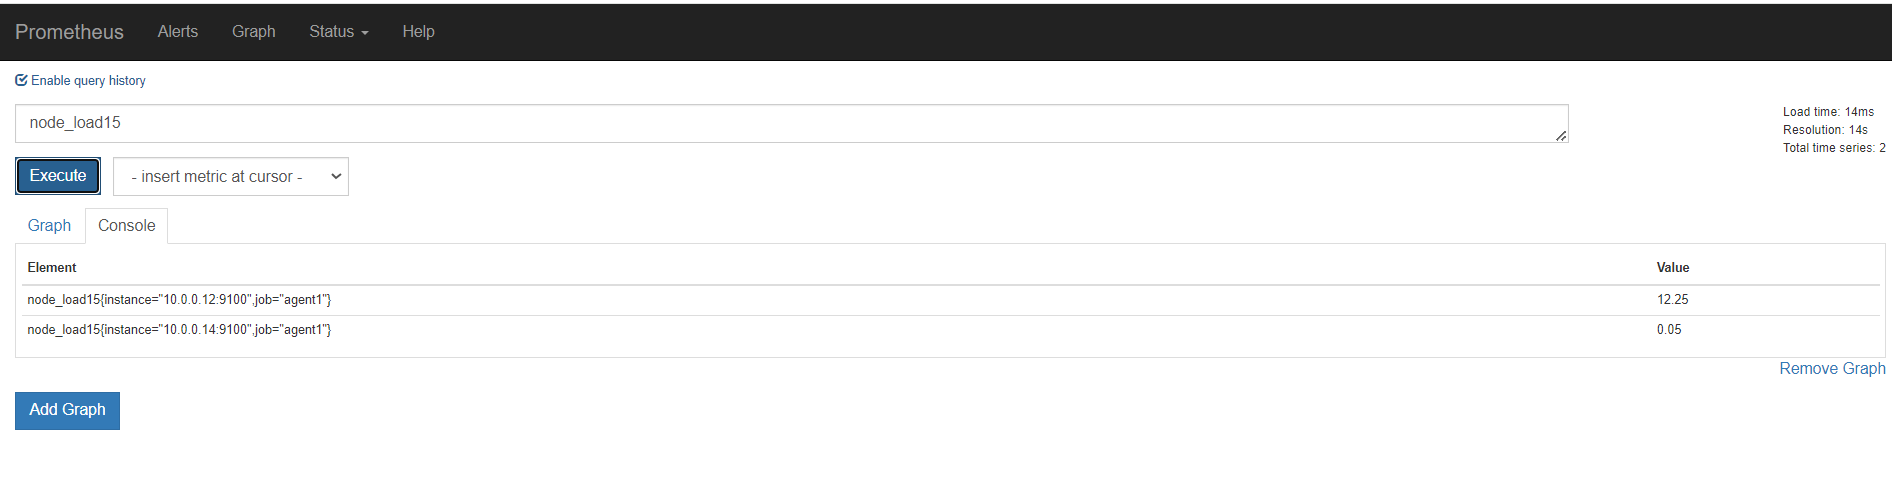
每个主机的每个cpu的每个模式的cpu使用时间都是一个元素,返回的是他们的集合。
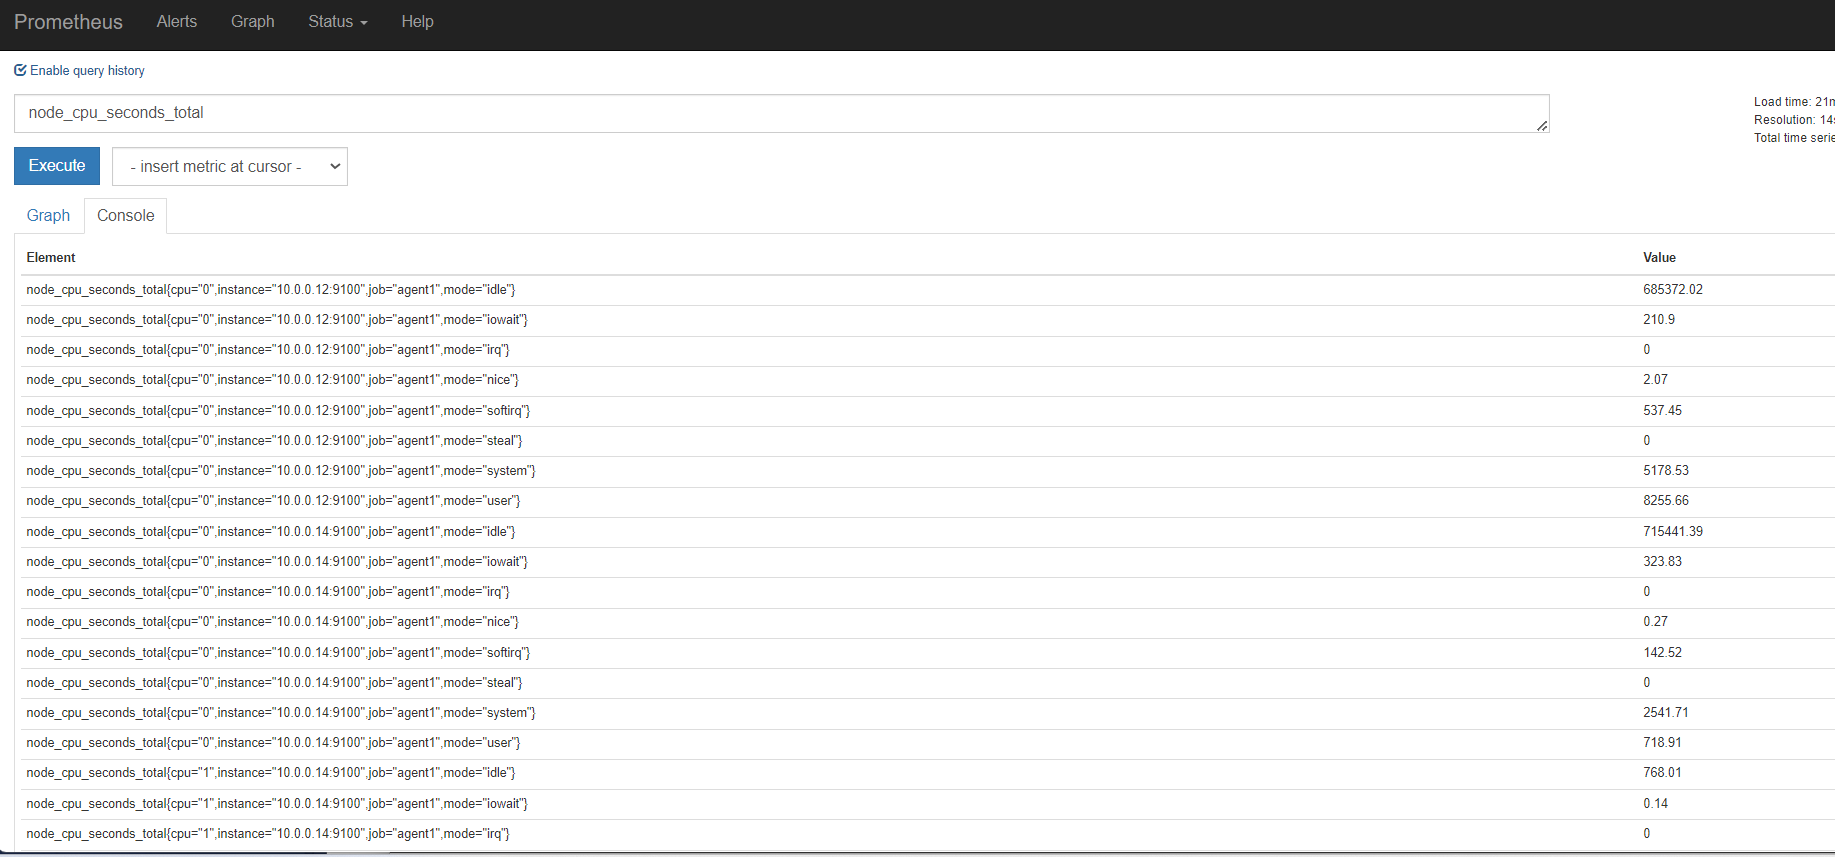
每个主机的每个cpu的idle的使用时间都是一个元素,返回的是所有主机所有cpu的idle集合。 通过标签筛选,只留下idle模式的数据元素。这里总共两个主机,三个cpu,所以对应的idle模式的数据就三条
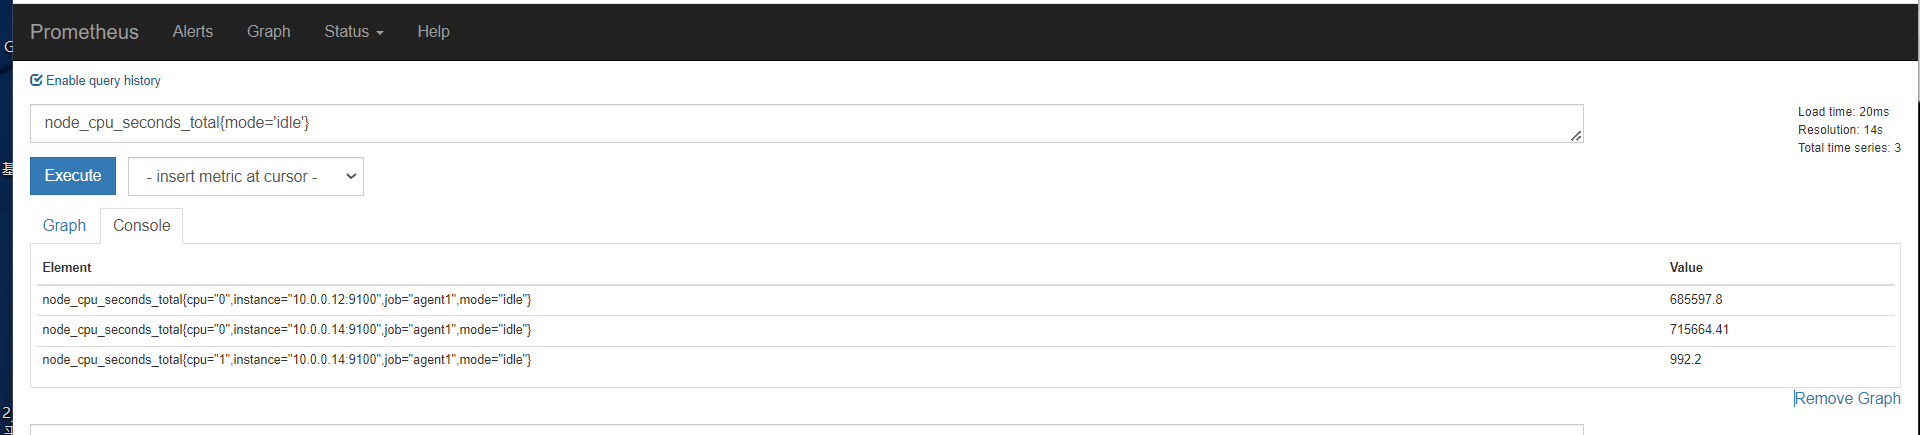
上面已经是所有主机所有cpu的idle集合,从上面数据,把上面表达式当成一个整体,根据instance分组来统计元素个数
要想知道每个主机的cpu个数。可以先把某个模式的cpu都列出来,就是所有的cpu列表,然后根据主机分组,就可以统计每个主机有多少个cpu
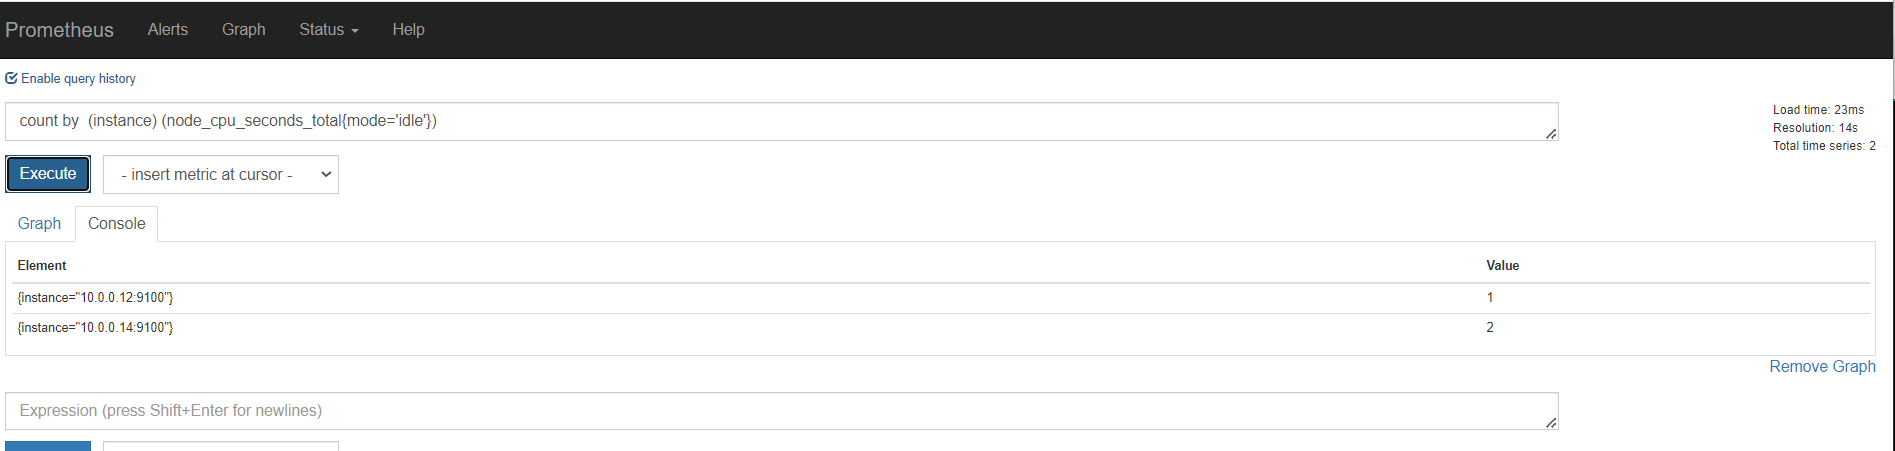
这已经是每个主机cpu的数量统计了
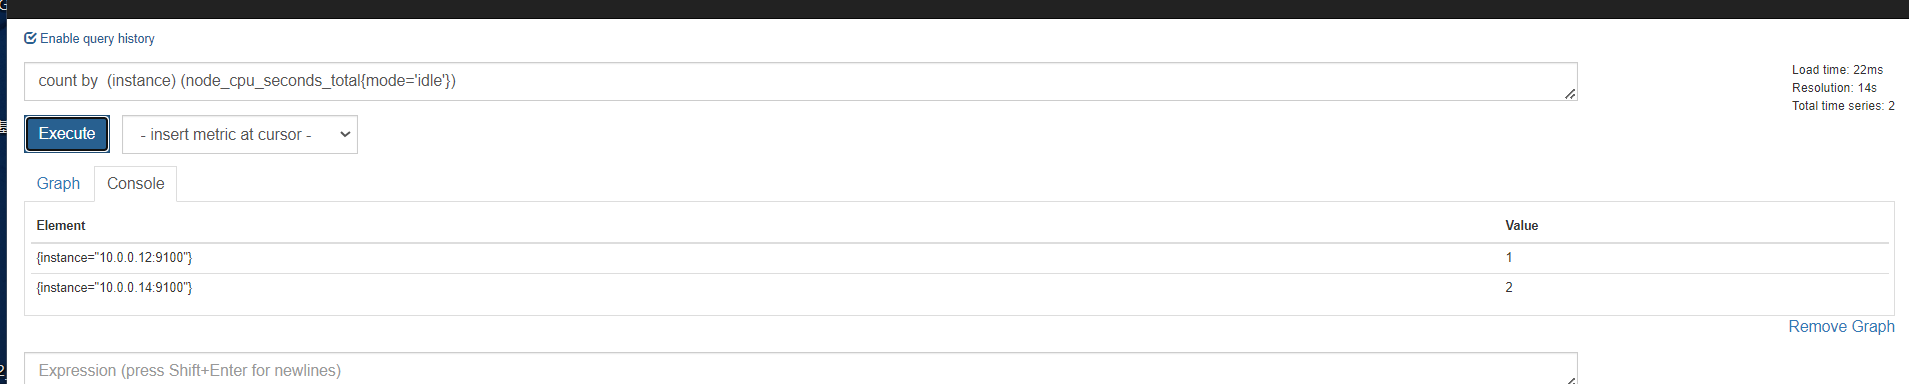
给count by (分组)()使用乘法运算,可以放在前面也可以放到后面。这里是获取主机cpu个数的两倍数字
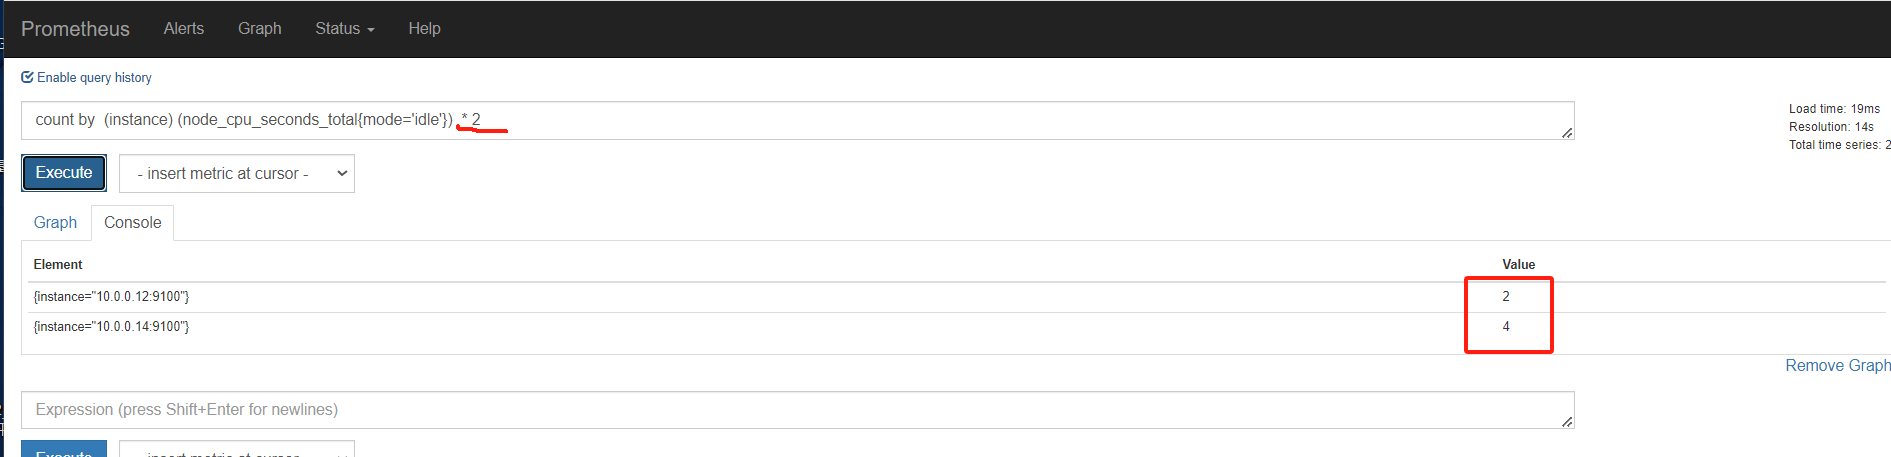
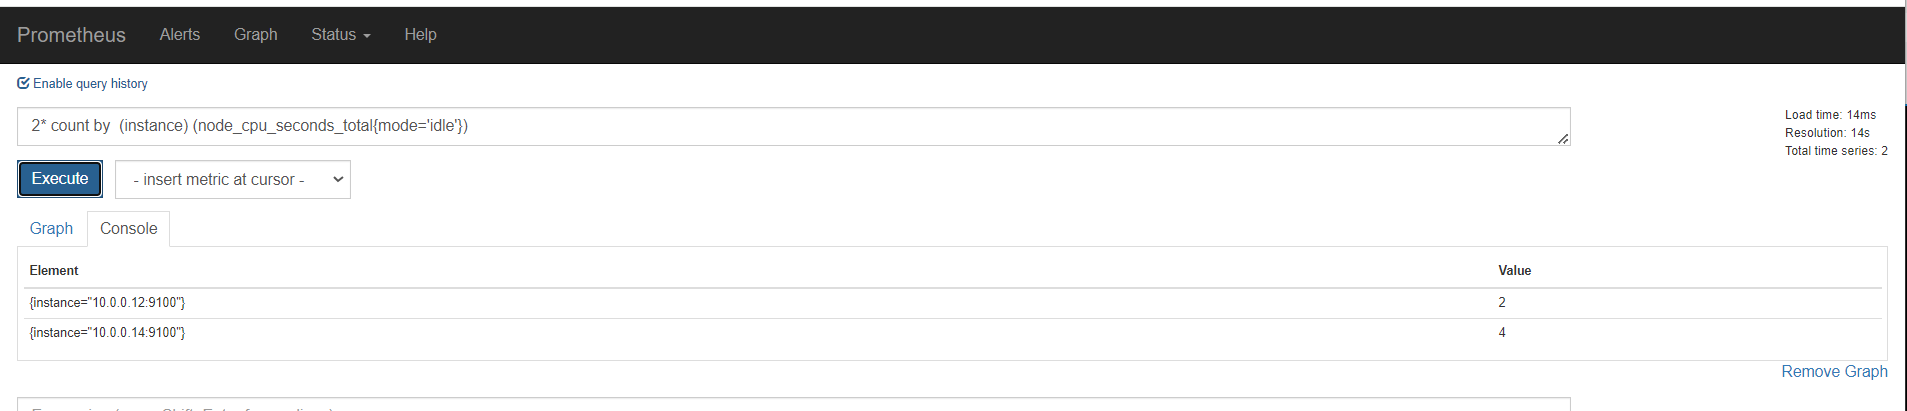
有了上面的数值之后,我们就可以用下面,去找1分钟平均负载,大于主机cpu数量两倍的主机了。然后用于高级。但是下面这个表达式,在表达式浏览器里面好像不支持。
node_load1 > 2* count by (instance) (node_cpu_seconds_total{mode='idle'})
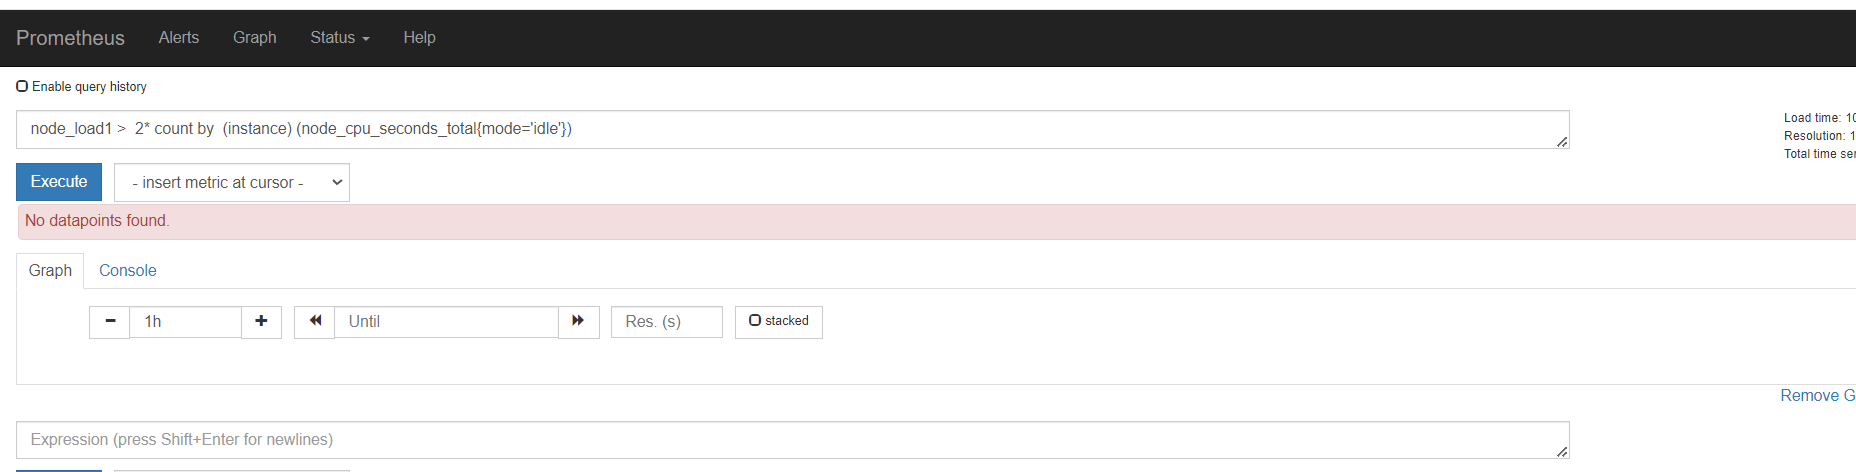
内存使用率
字节为单位
node_memory_MemTotal_bytes:主机上的总内存
node_memory_MemFree_bytes:主机上的可用内存
node_memory_Buffers_bytes:缓冲缓存中的内存
node_memory_Cached_bytes:页面缓存中的内存
三个相加 ,代表主机上可用内存。
node_memory_MemFree_bytes+node_memory_Buffers_bytes+node_memory_Cached_bytes
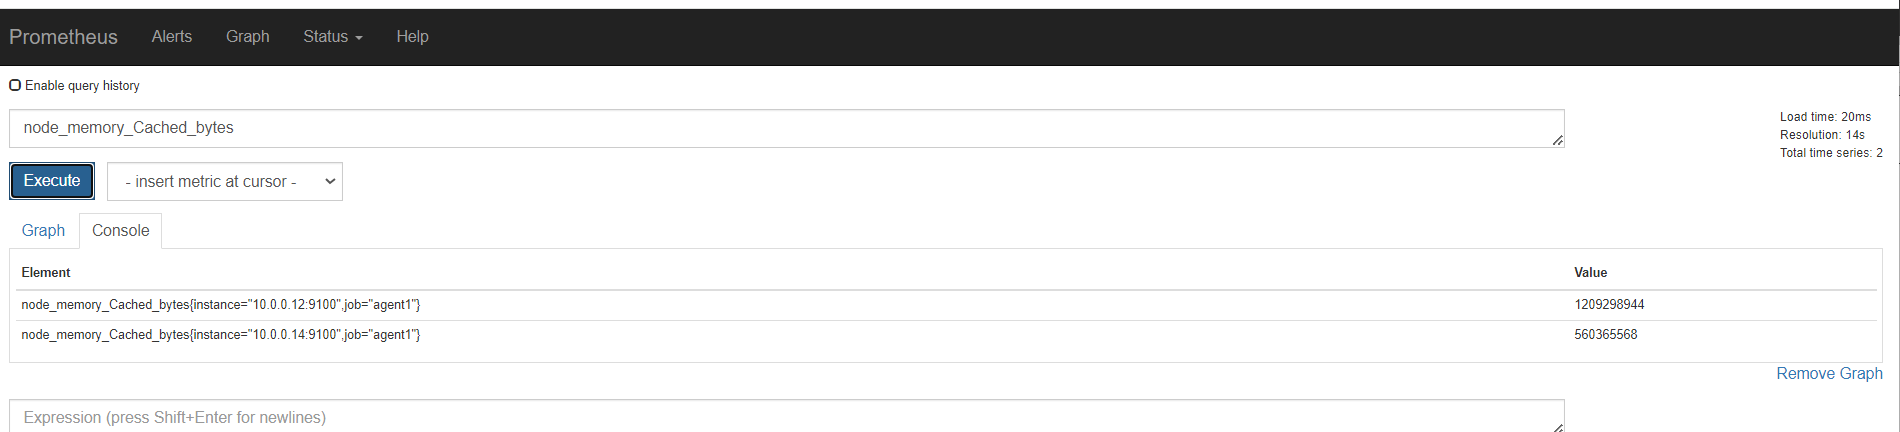
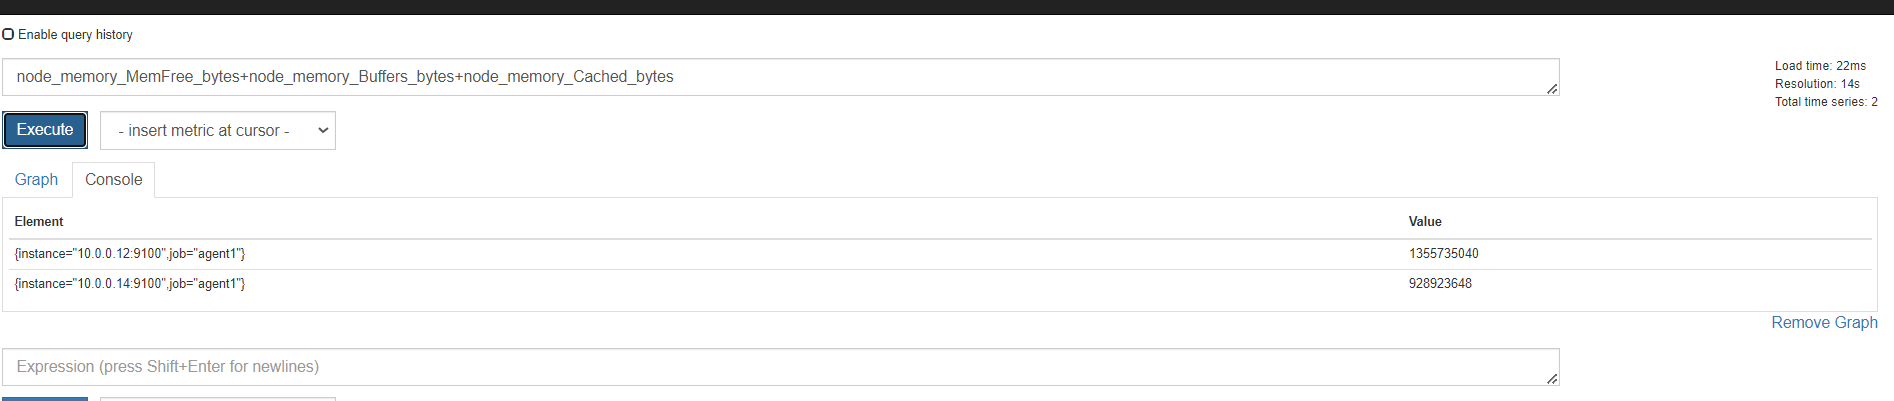
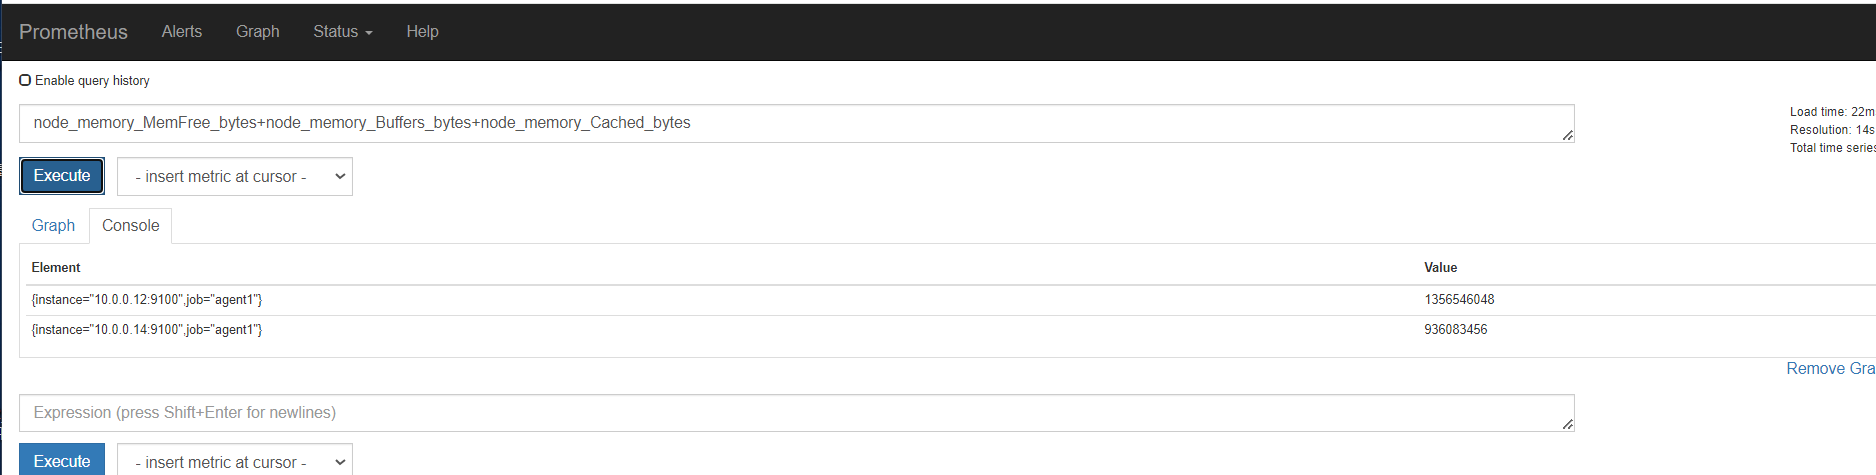
总的减去可用的,就是已用的量,字节单位
node_memory_MemTotal_bytes-(node_memory_MemFree_bytes+node_memory_Buffers_bytes+node_memory_Cached_bytes)
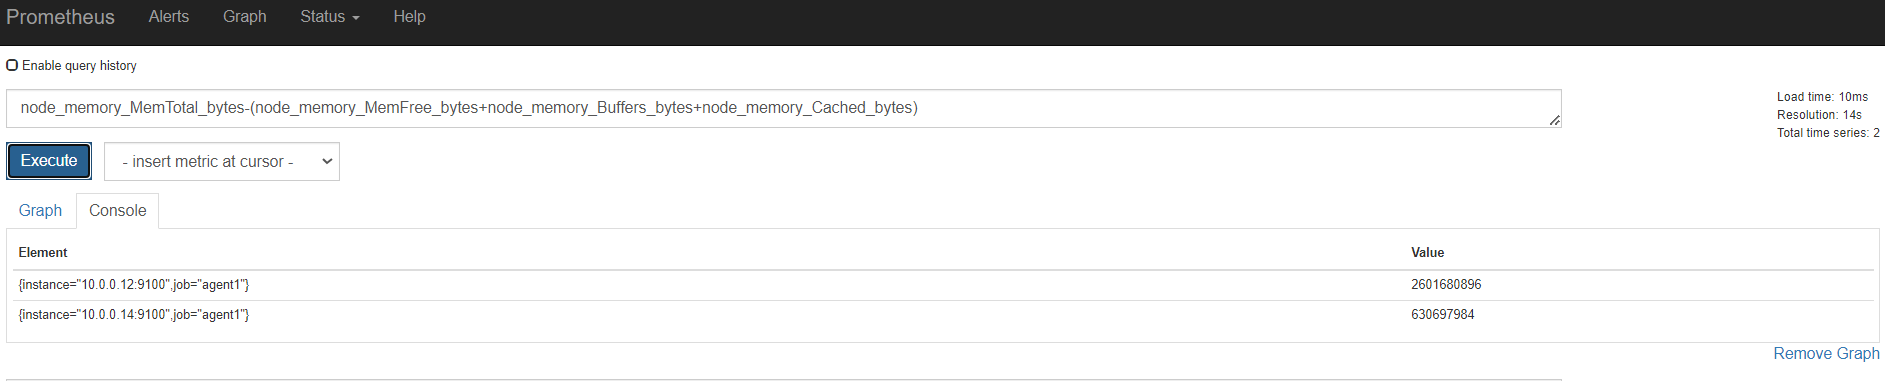
已用的量比上总的内存量,*100,就是内存使用率
(node_memory_MemTotal_bytes-(node_memory_MemFree_bytes+node_memory_Buffers_bytes+node_memory_Cached_bytes))/node_memory_MemTotal_bytes*100
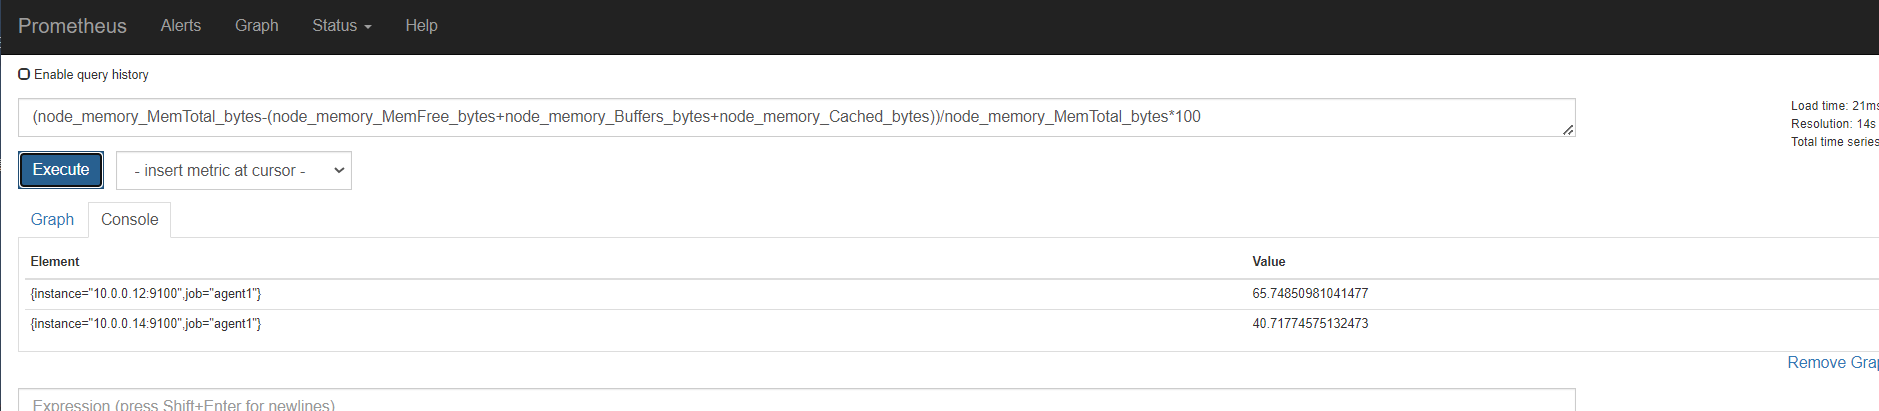
内存饱和度
从/proc/vmstat手机收集两个指标
以KB为单位
node_vmstat_pswpin:系统每秒从磁盘读取到内存的字节数
node_vmstat_pswpout:系统每秒从内存写到磁盘的字节数
每秒输入到内存的KB数,使用rate([1m]),就是1分钟总输入到内存的KB数比上60秒,也就是近一分钟内平均每秒输入到内存的KB数,也就是输入到到内存的KB数的速率
rate(node_vmstat_pswpin[1m])】
内存的输入输出一分钟内的速率和
rate(node_vmstat_pswpin[1m])+rate(node_vmstat_pswpout[1m])
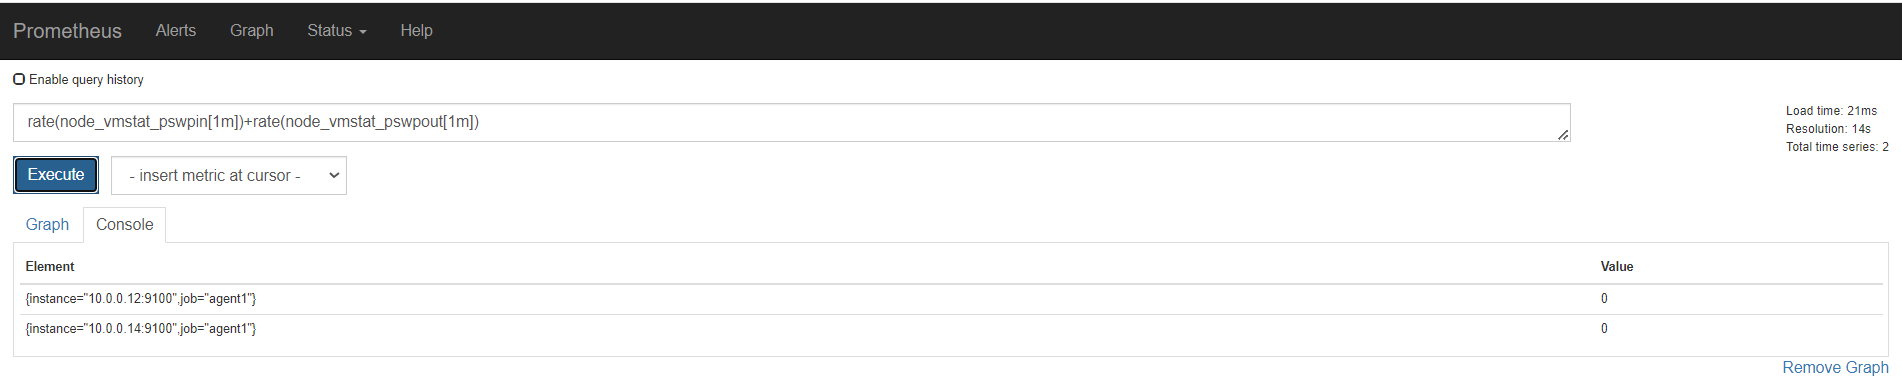
将上面的根据主机分组,求和,统计每个主机的内存的输入输出速率和
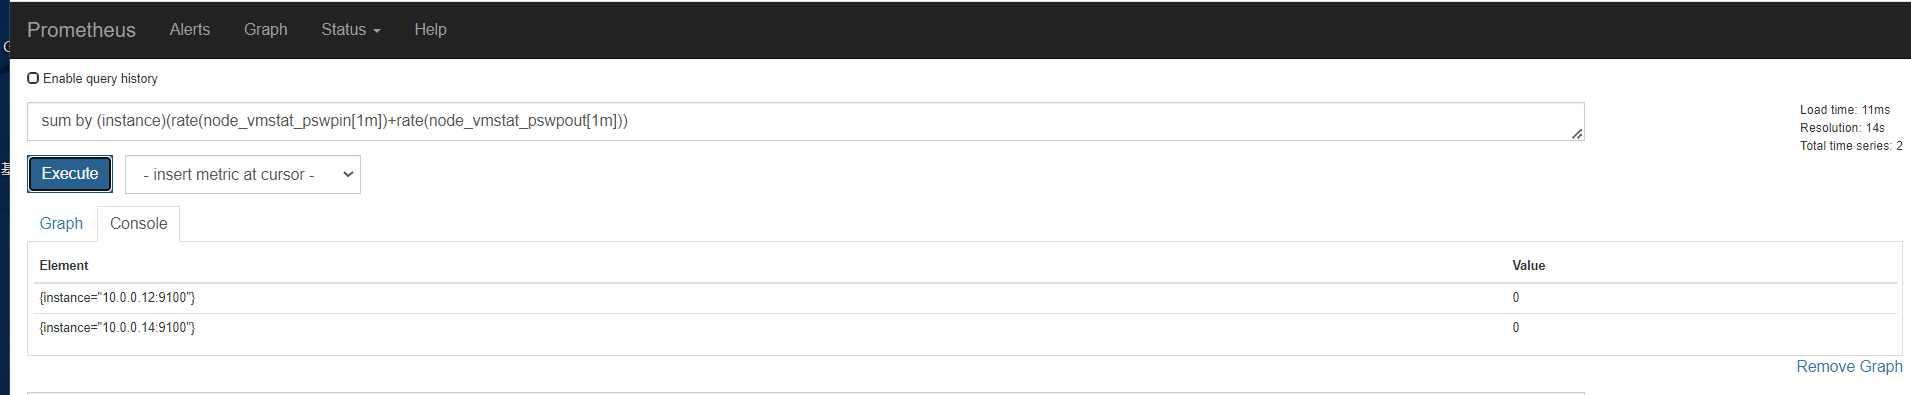
求i和之后,在做乘法运算,直接乘就可以。默认单位是KB,乘以1024,返回的是字节。是分组求和的统计结果集
1024 * sum by (instance)(rate(node_vmstat_pswpin[1m])+rate(node_vmstat_pswpout[1m]))
sum by (instance)(rate(node_vmstat_pswpin[1m])+rate(node_vmstat_pswpout[1m]))*1024
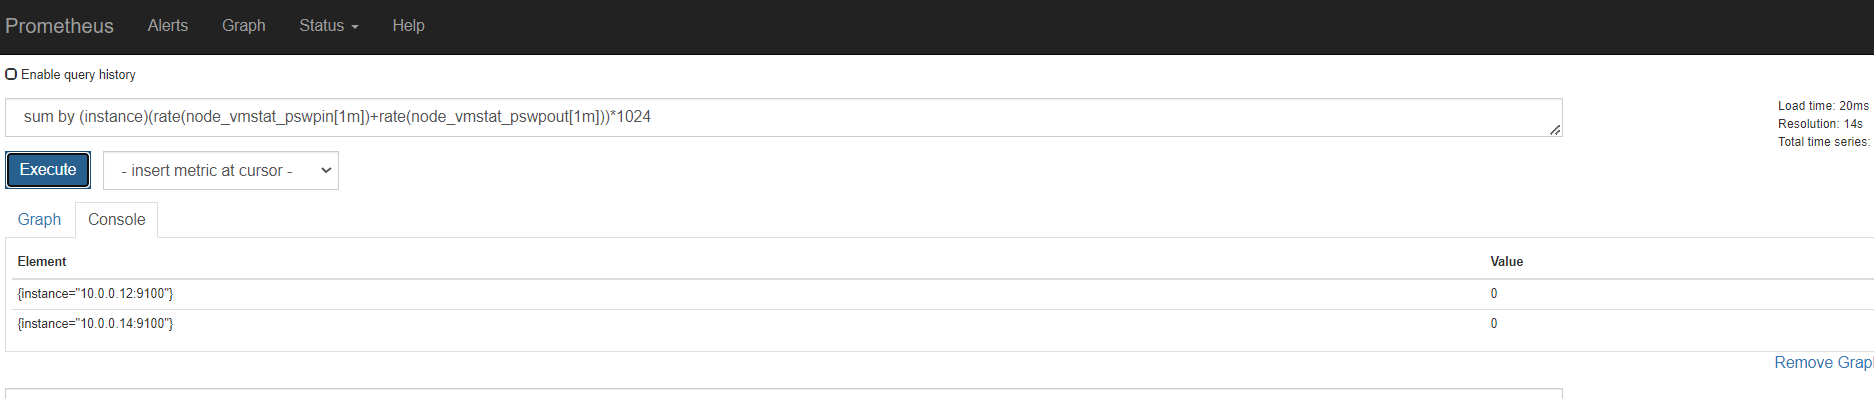
磁盘使用率
predict_linear(node_filesystem_free_bytes{mountpoint="/"}[1h],4*3600) <0predict_linear(node_filesystem_free_bytes{mountpoint="/"}[1h],4*3600) <0
node_filesystem_size_bytes:被监控的每个文件系统挂载的大小
返回的是所有机器所有挂载点的元素列表。每个元素都是一个挂载点
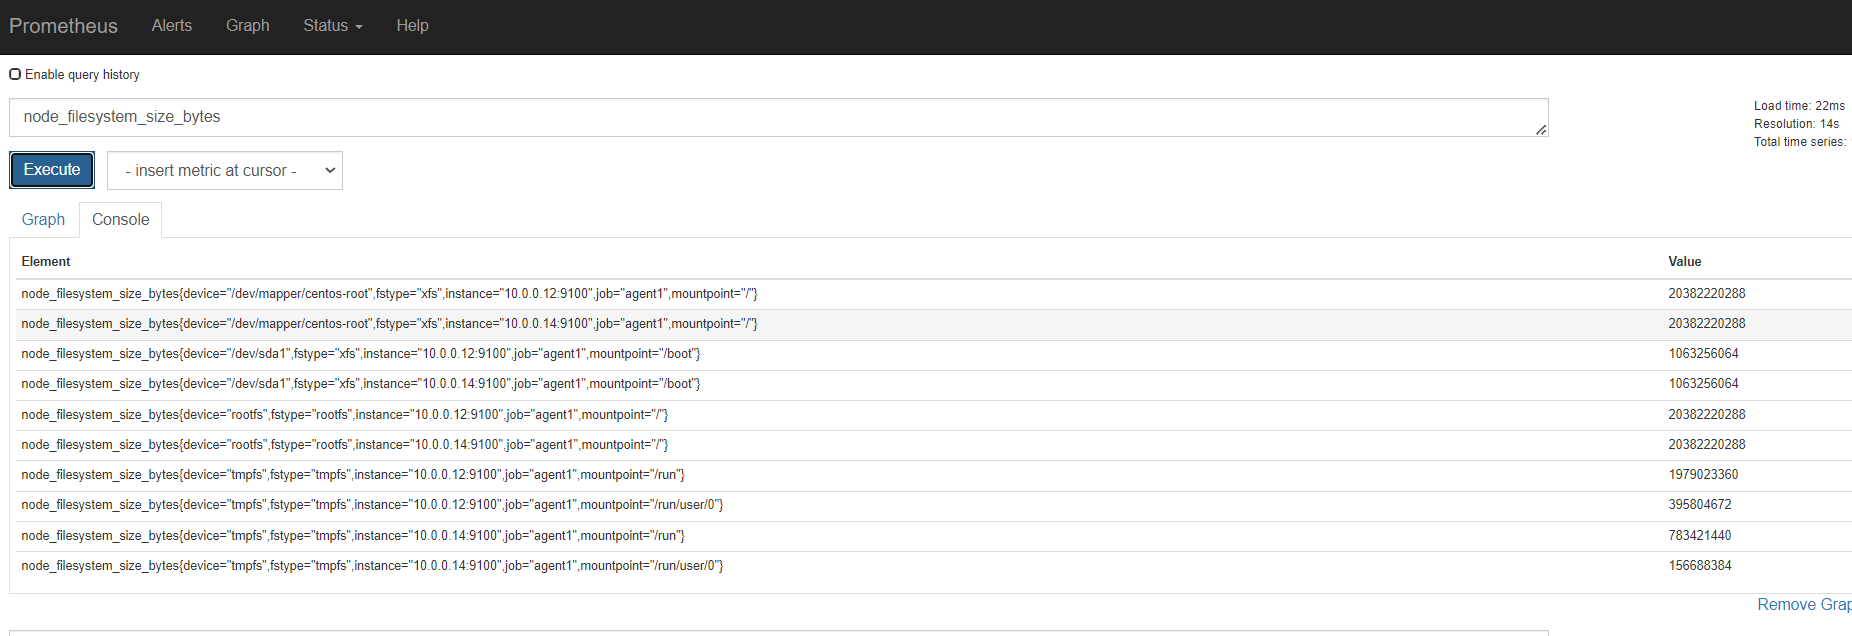
指定只看根挂载点的大小

两个都只看根挂载点的,
节点文件系统/挂载点的大小-节点文件系统/剩余的字节数大小=节点文件系统/挂载点已用的字节数大小
node_filesystem_size_bytes{mountpoint="/"}-node_filesystem_free_bytes{mountpoint="/"}
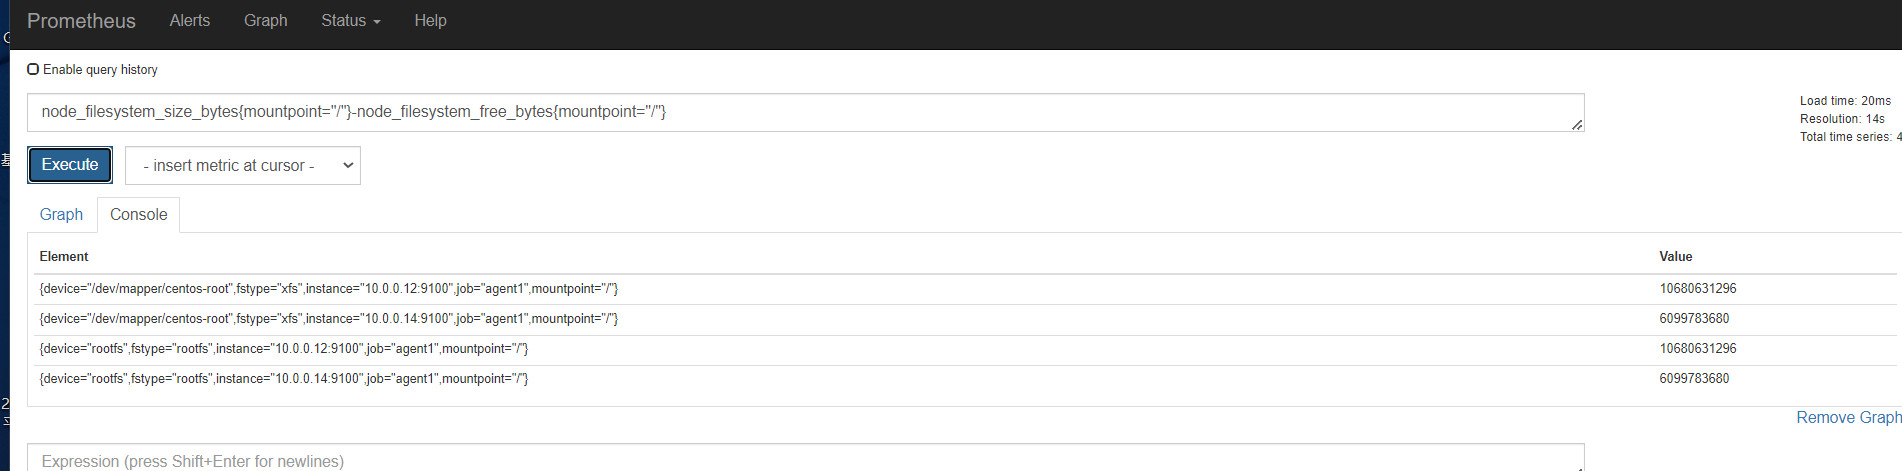
上面那个返回的是所有主机的,/挂载点已用的,那么除以节点文件系统/挂载点的大小,就是/挂载点的磁盘使用率,*100,就是作为百分数使用的值。把上面的结果当作整体除以/挂载总大小,需要括号括起来。比值后的结果乘以100,在前在后应该都可以
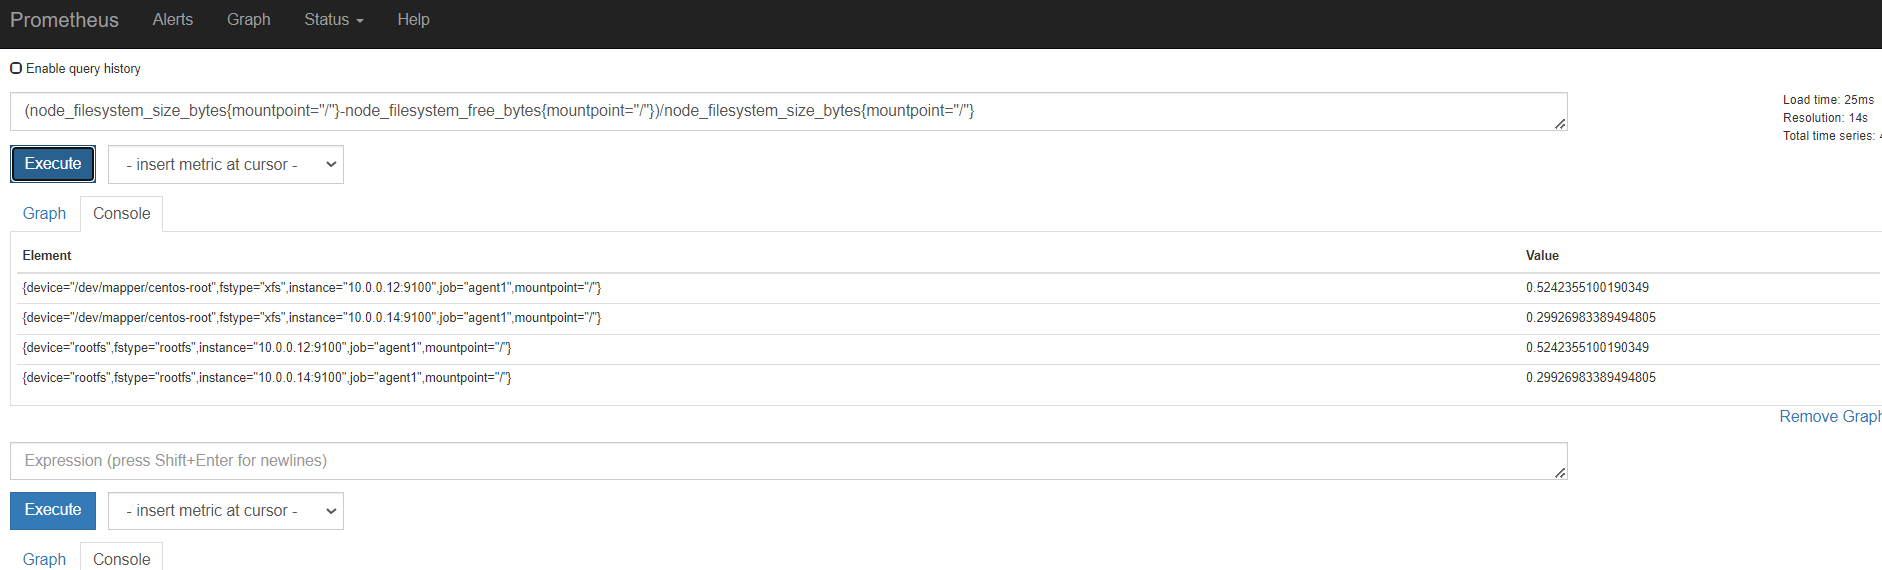
根挂载点使用率,每个机器的。就是不知道为啥是两条呢,
(node_filesystem_size_bytes{mountpoint="/"}-node_filesystem_free_bytes{mountpoint="/"})/node_filesystem_size_bytes{mountpoint="/"}*100
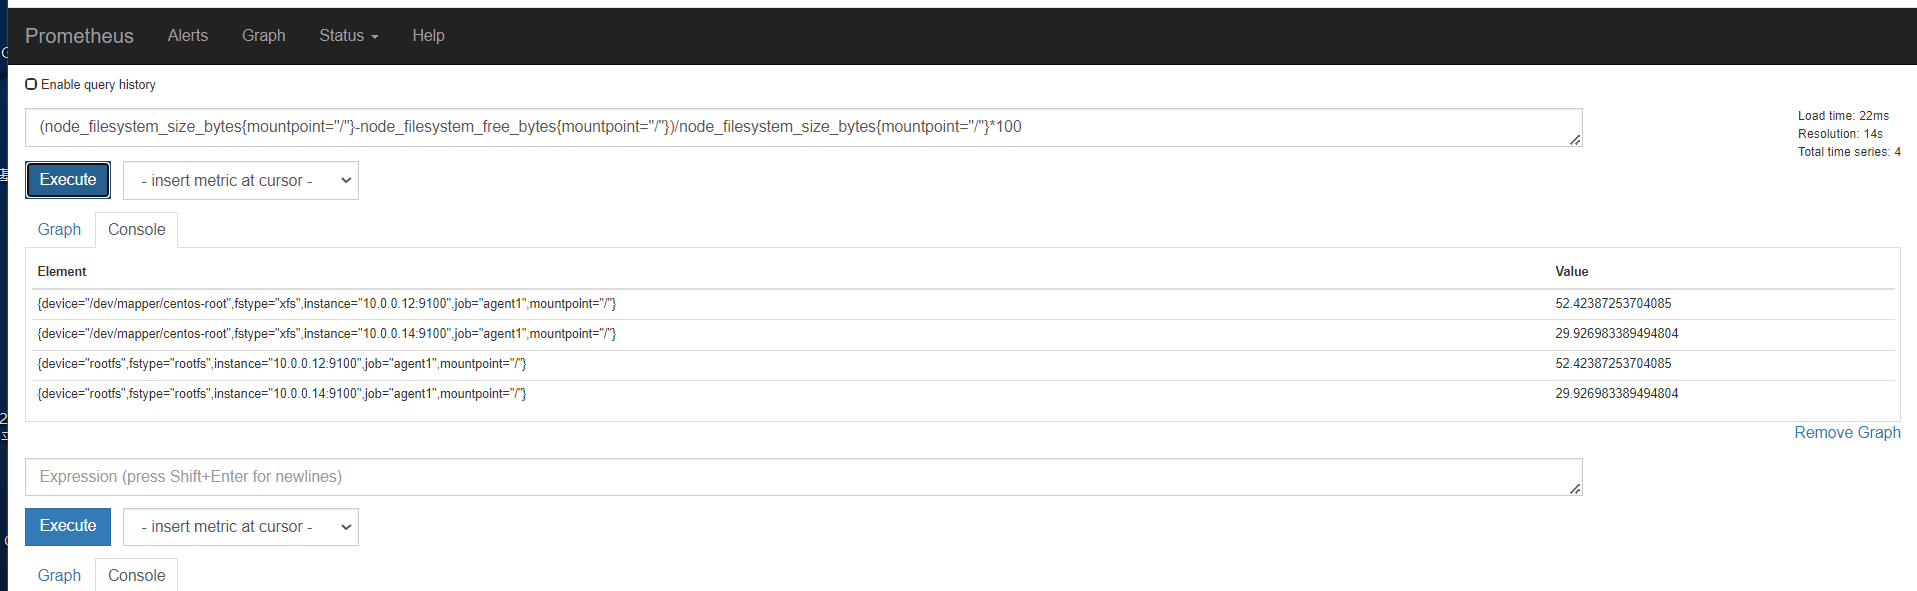
对比命令返回的。/的确是近30%使用率。
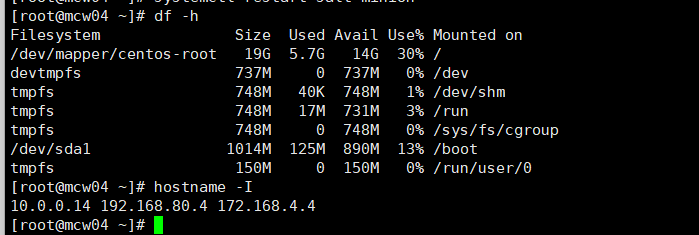
对比上面,可用看
如果想要获取多个挂载点的返回值。那么竖线分开多个挂载点,等号后面也要添加~来匹配多个路径。~意思是使用正则匹配,多个挂载点
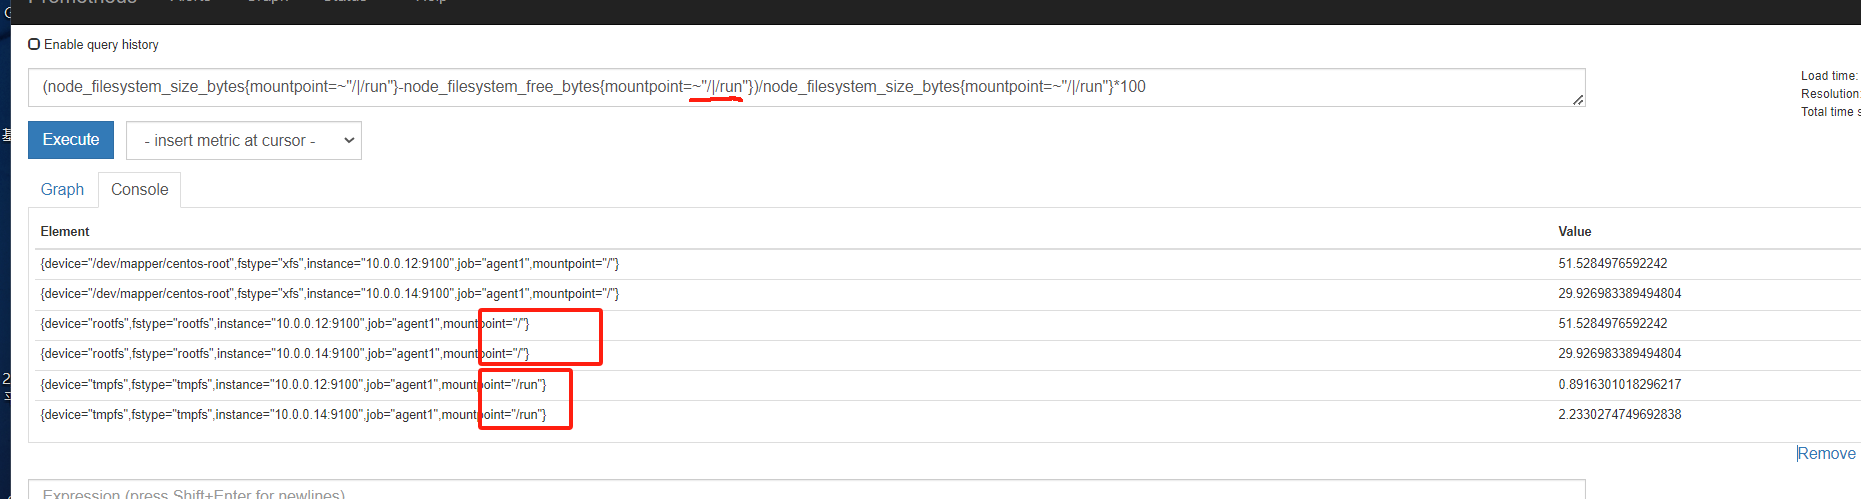
/挂载点剩余字节数
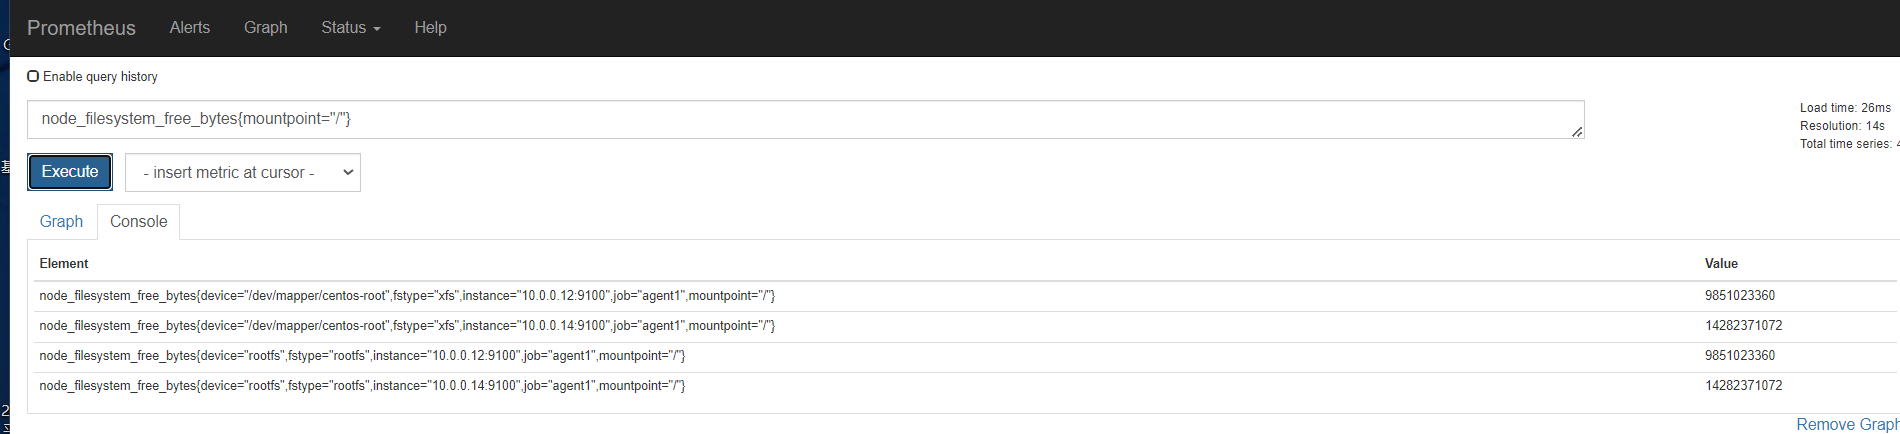
根挂载点剩余字节数,预测多长时间之后,多少字节。这里是根据近1个小时的数据趋势分析,后四个小时的磁盘剩余量,如果会用完,值就是负数,然后跟0对比,小于0用完了就会触发告警,
predict_linear(node_filesystem_free_bytes{mountpoint="/"}[1h],4*3600)
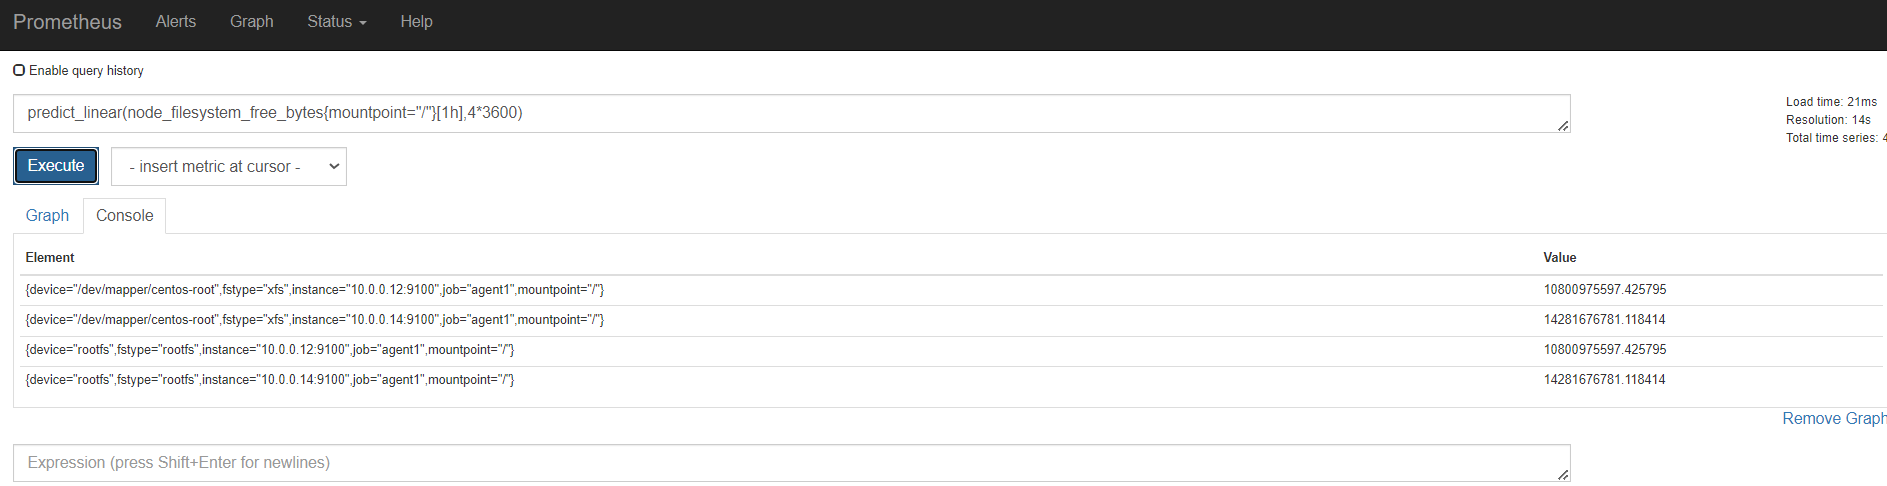
这个时间从地图上看好像不是预测多长时间之后的呀
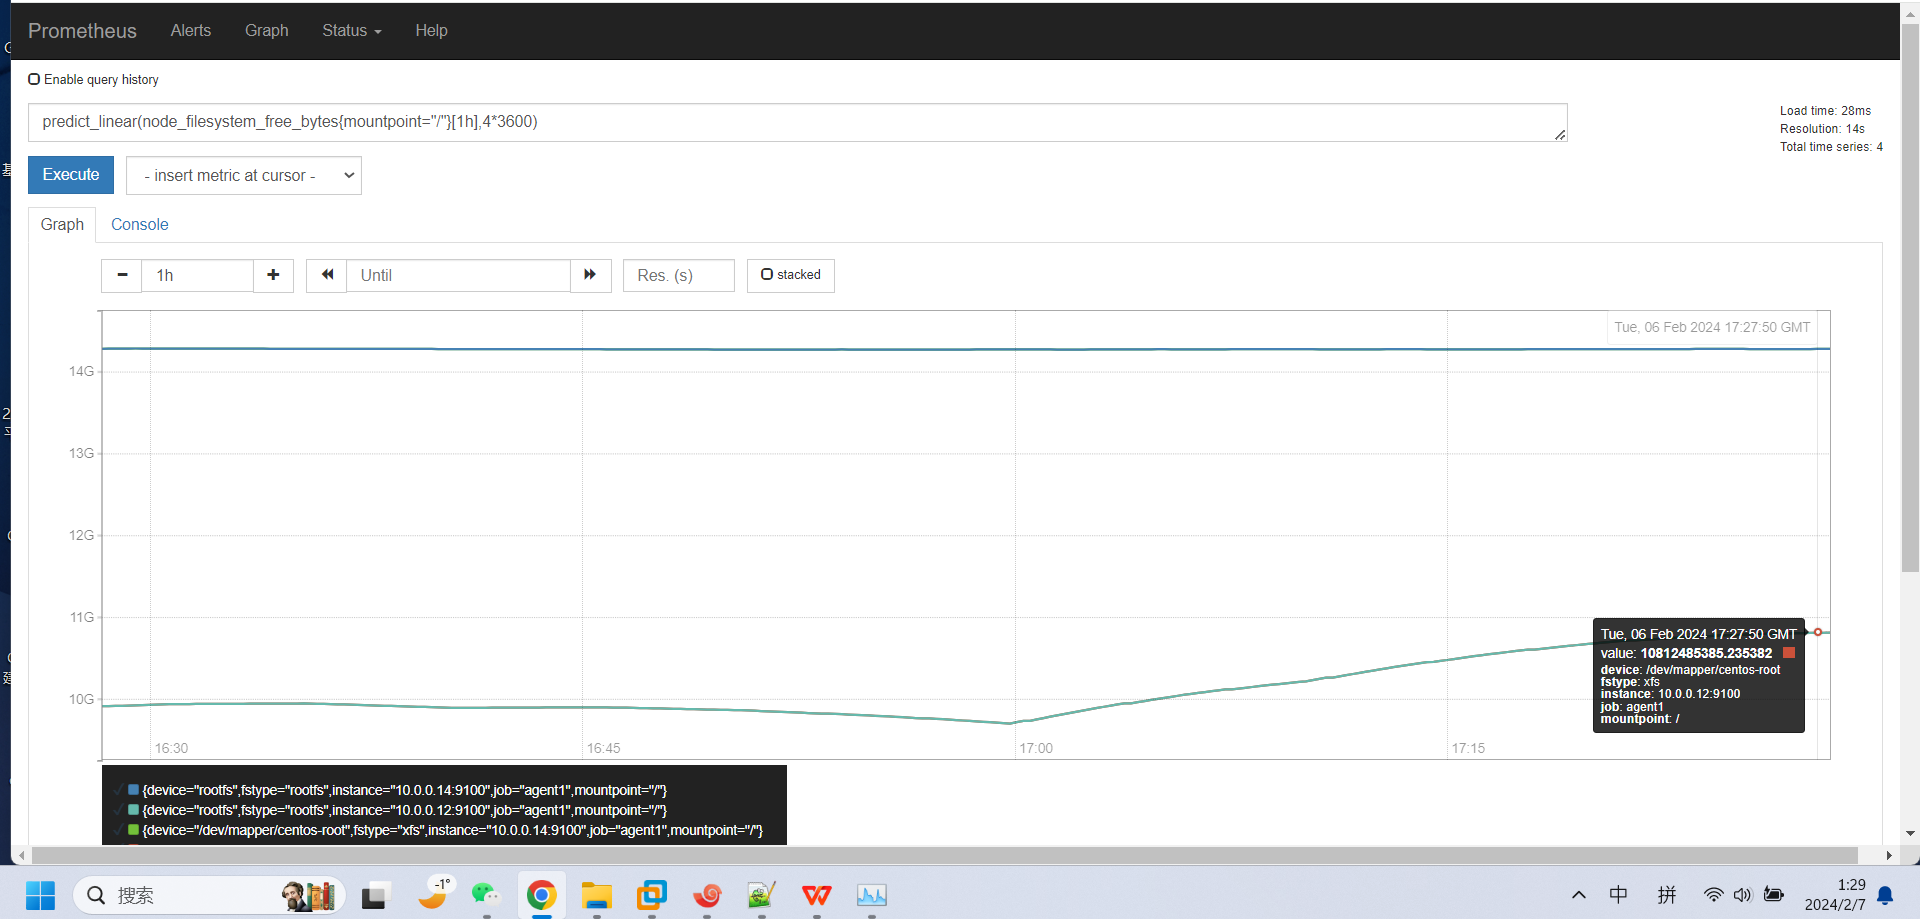
服务状态
node_systemd_unit_state{name="docker.service"}==1
mcw02开启的systemd。并且只收集下面三个服务
[root@mcw02 ~]# ps -ef|grep -v grep  |grep export
root      48675      1  0 Feb01 ?        00:05:06 /usr/local/node_exporter/node_exporter  \
--collector.textfile.directory=/var/lib/node_exporter/textfile_collector/ --collector.systemd \
--collector.systemd.unit-whitelist=(docker|ssh|rsyslog).service
[root@mcw02 ~]#
mcw04没有收集
[root@mcw04 ~]# ps -ef|grep -v grep  |grep export
root      16003      1  0 Jan30 ?        00:06:53 /usr/local/node_exporter/node_exporter
[root@mcw04 ~]#
下面指标,正好就是只能只能看到systemd指定收集的服务的状态,可用看到acitve的有两个,也就是两个服务是正常运行的
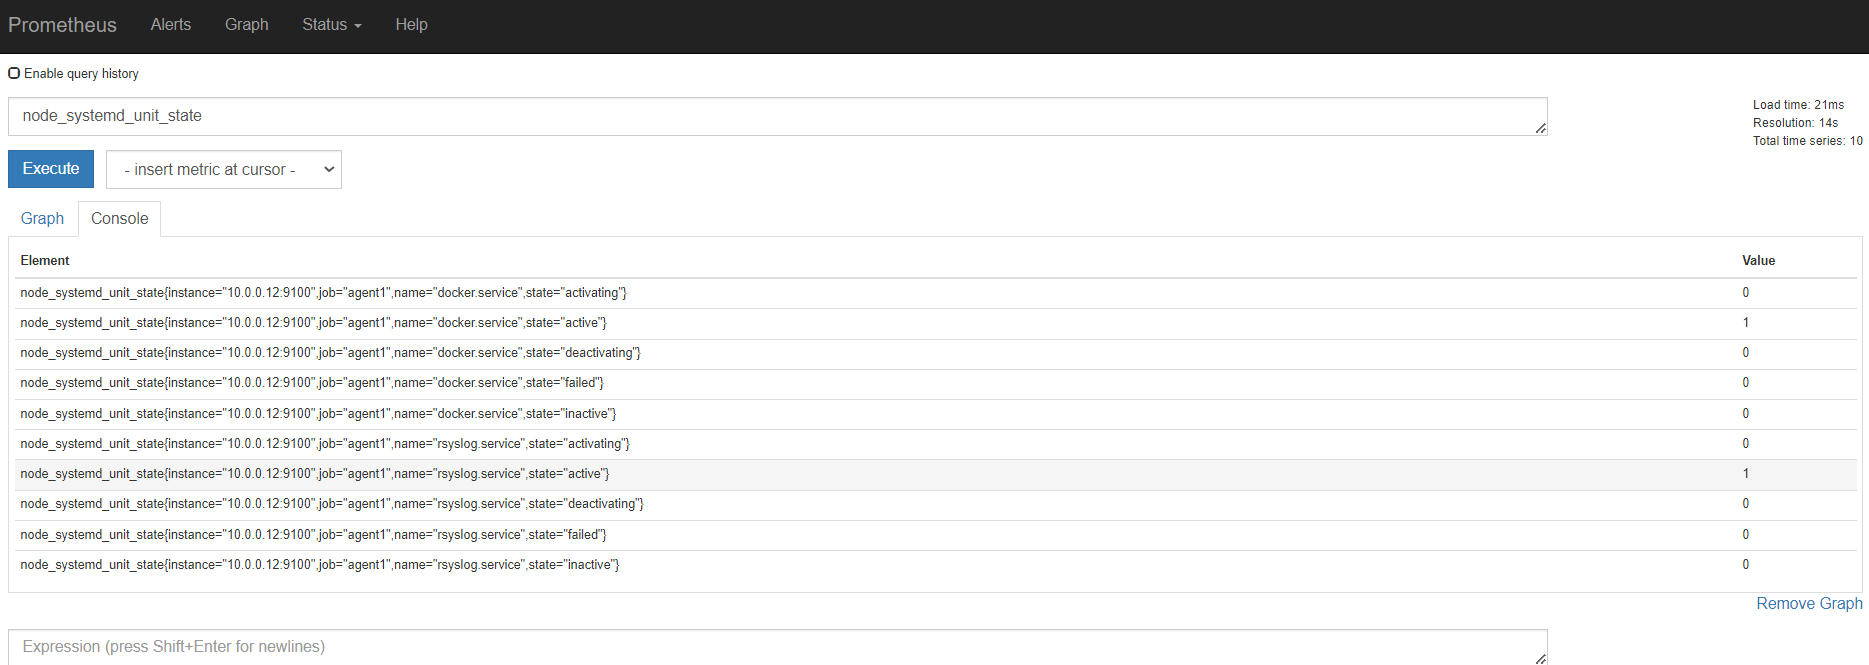
只看docker服务的情况。每个潜在的服务和状态如下.
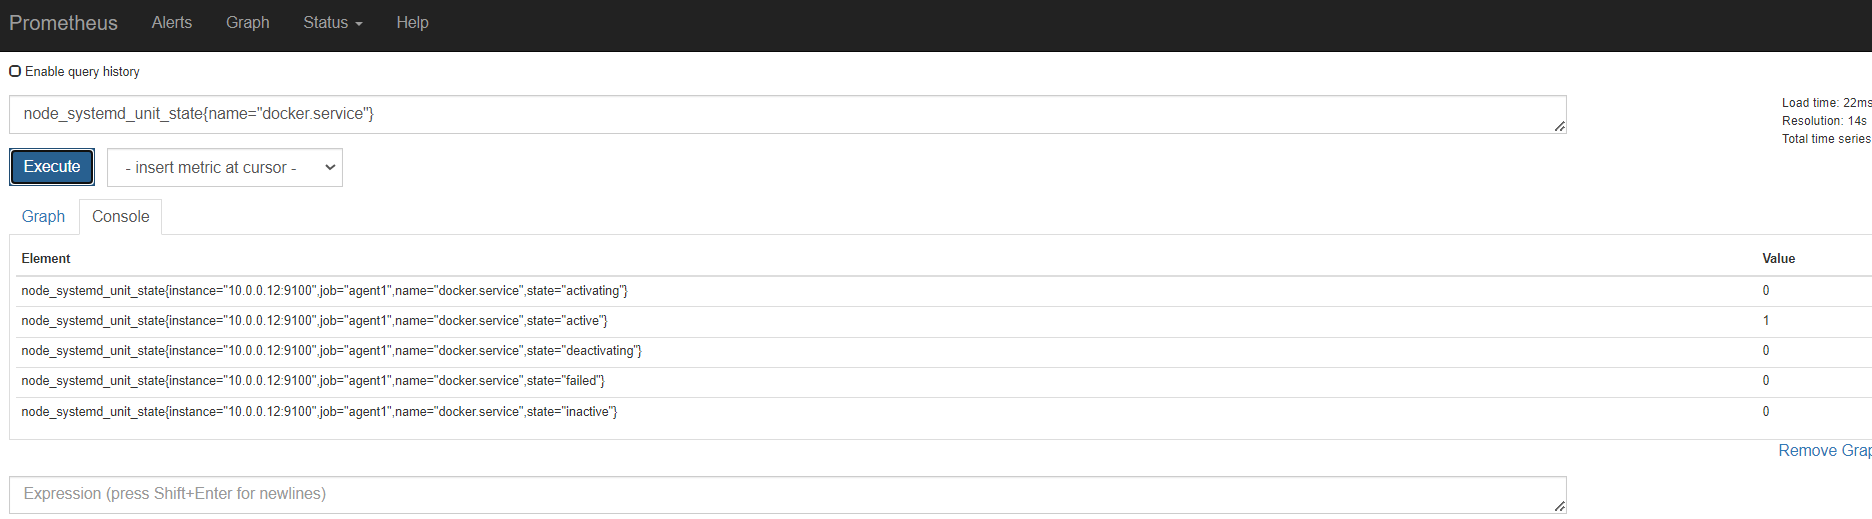

这样可用查看值=等于多少的,进行筛选
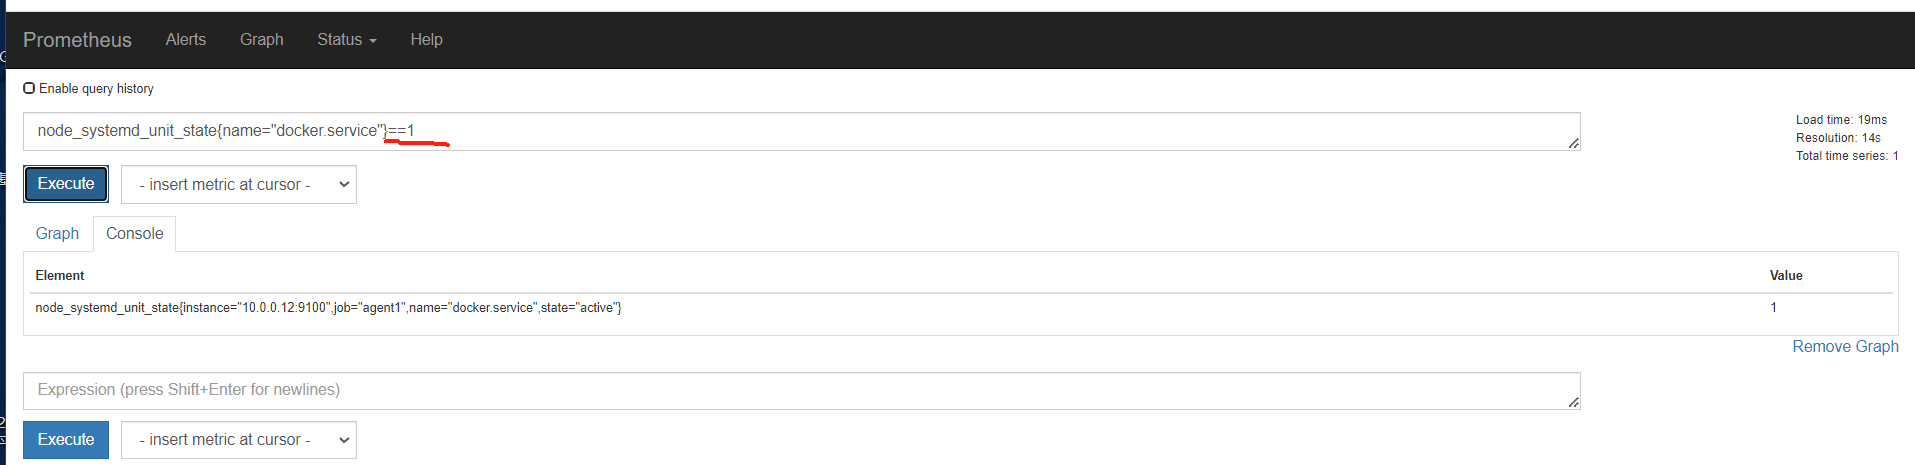
可用性和up指标
up指的是target的监控客户端是否正常运行,我们也可以通过job去做筛选。
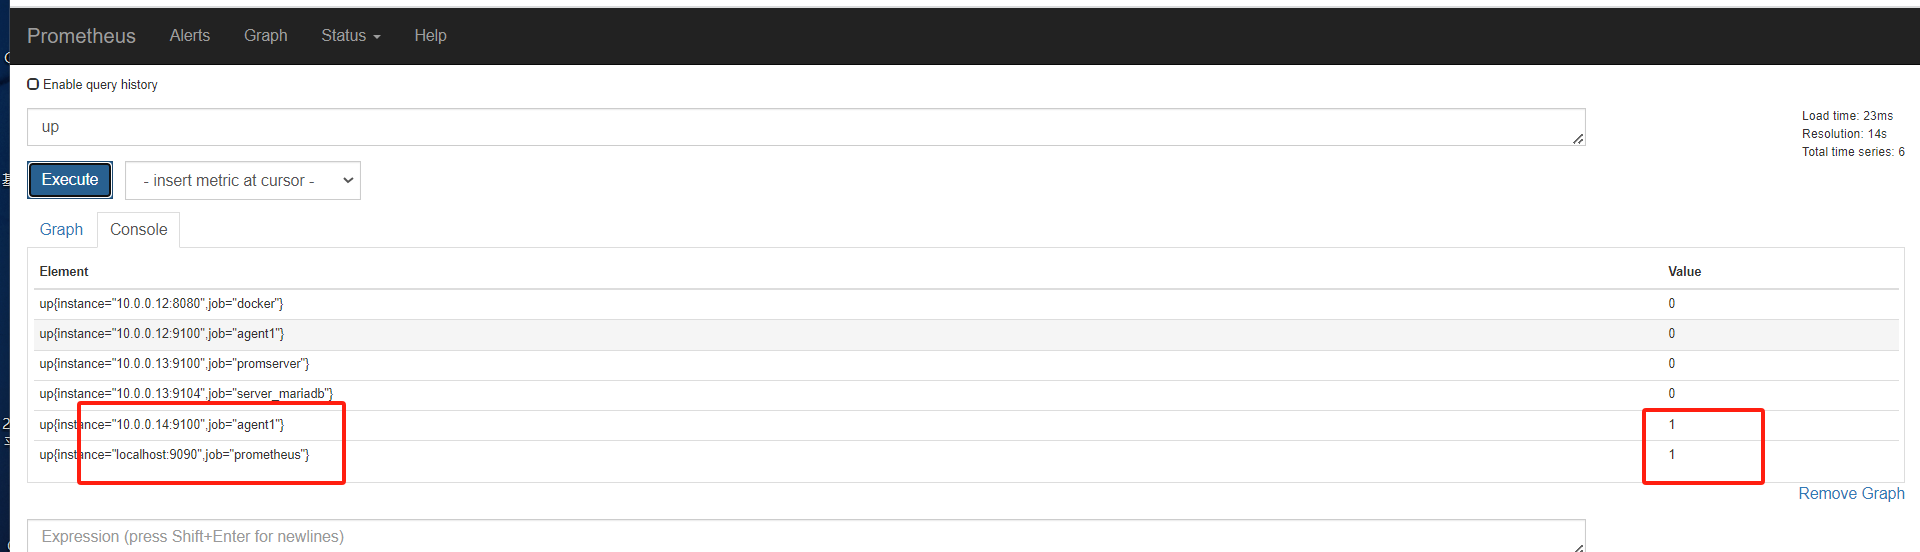
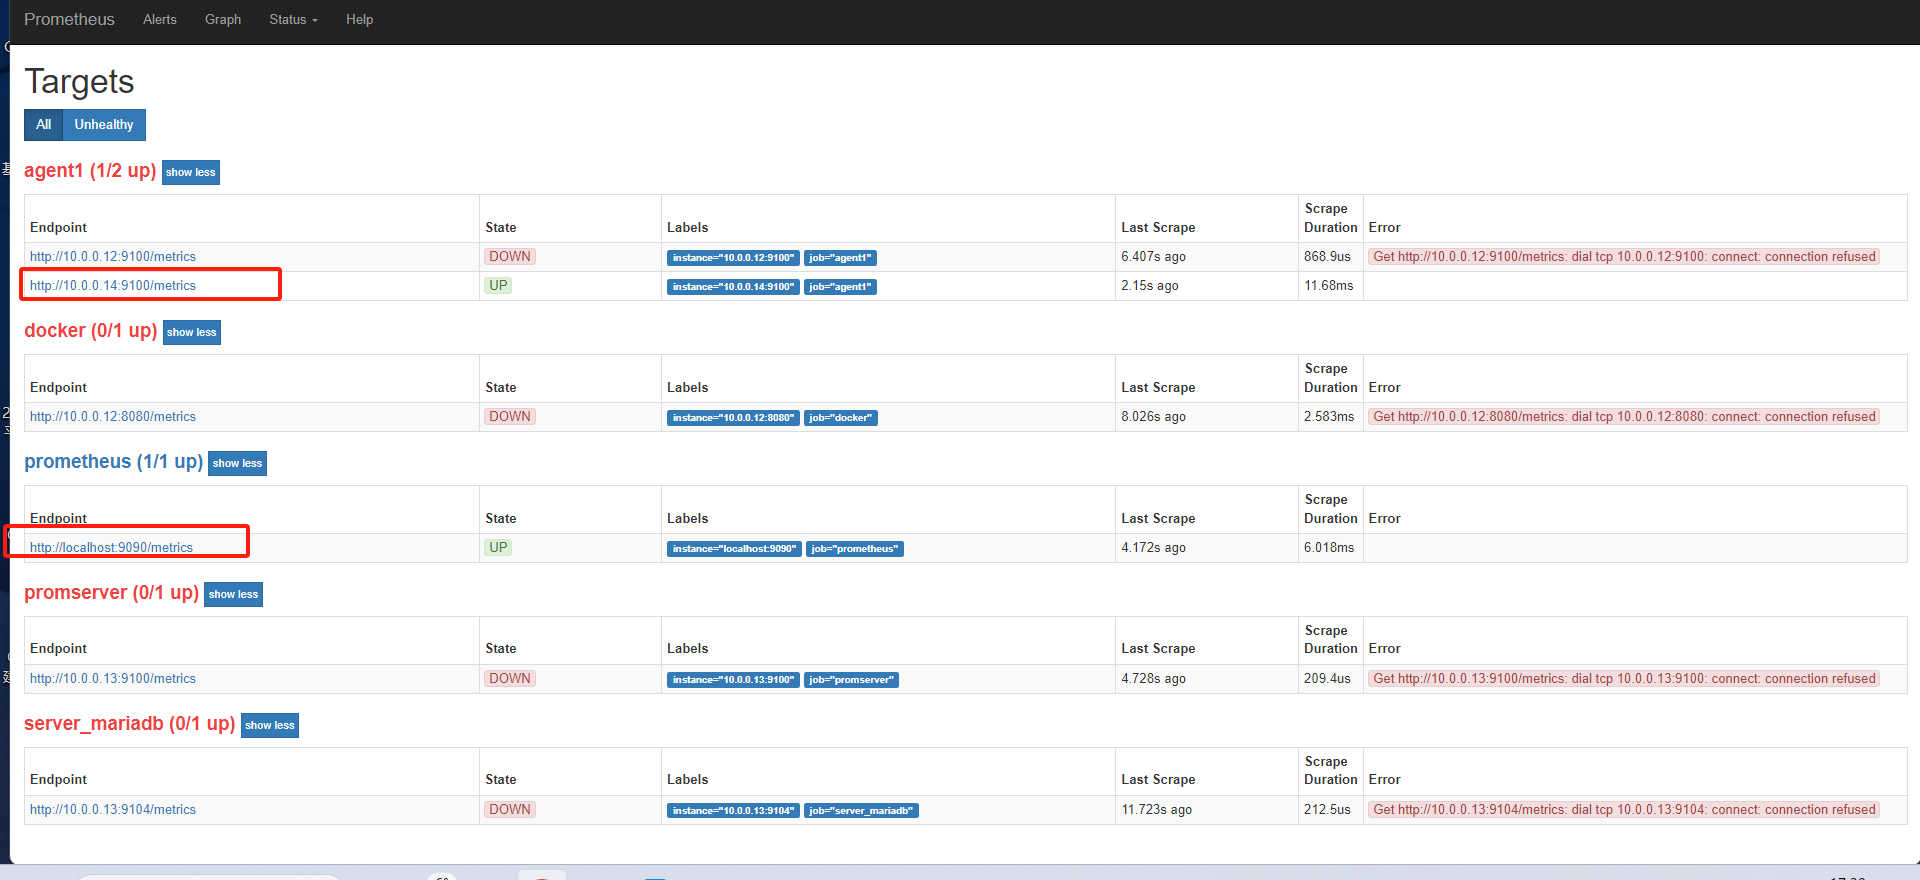
启动12上的两个客户端
[root@mcw02 ~]# docker ps
CONTAINER ID   IMAGE                    COMMAND                  CREATED         STATUS              PORTS                                       NAMES
ec02f883cb00   google/cadvisor:latest   "/usr/bin/cadvisor -…"   7 days ago      Up 54 minutes       0.0.0.0:8080->8080/tcp, :::8080->8080/tcp   cadvisor
958cbce17718   jenkins/jenkins          "/usr/bin/tini -- /u…"   12 months ago   Up About a minute   8080/tcp, 50000/tcp                         cool_kirch
[root@mcw02 ~]# ps -ef|grep -v grep |grep exprot
[root@mcw02 ~]# ps -ef|grep -v grep |grep export
root      16099   1766  1 18:27 pts/0    00:00:00 /usr/local/node_exporter/node_exporter --collector.textfile.directory=/var/lib/node_exporter/textfile_collector/ --collector.systemd --collector.systemd.unit-whitelist=(docker|ssh|rsyslog).service
[root@mcw02 ~]#
显示up了
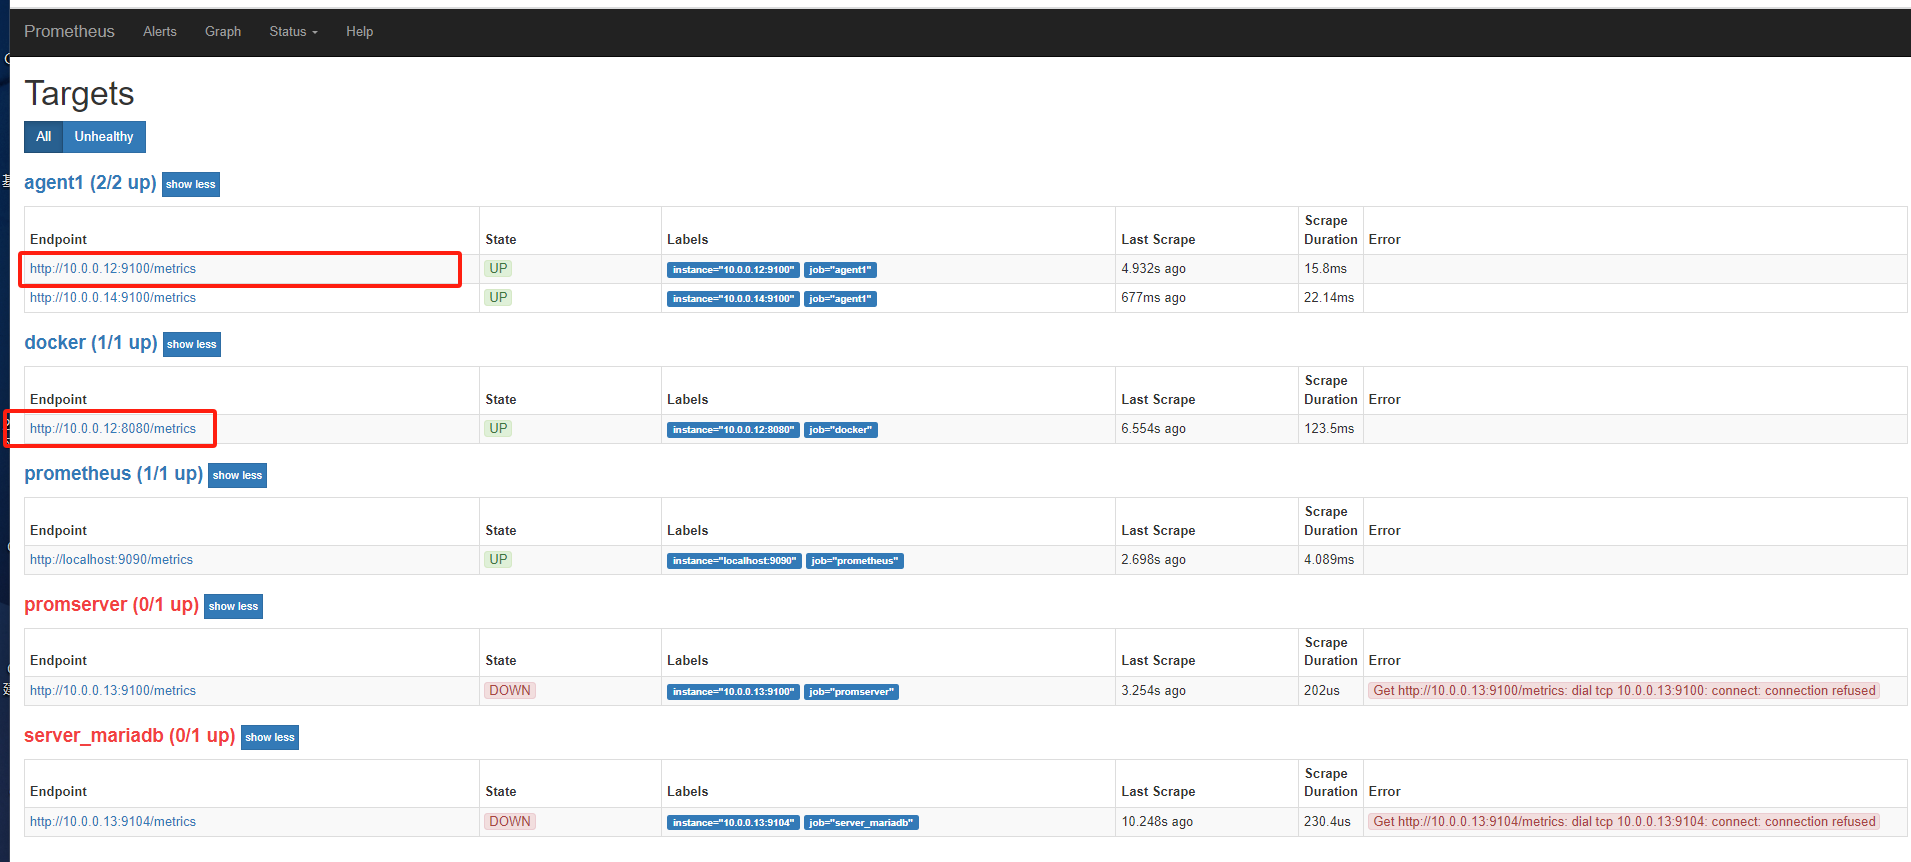
表达式浏览器这里查看,也是up了
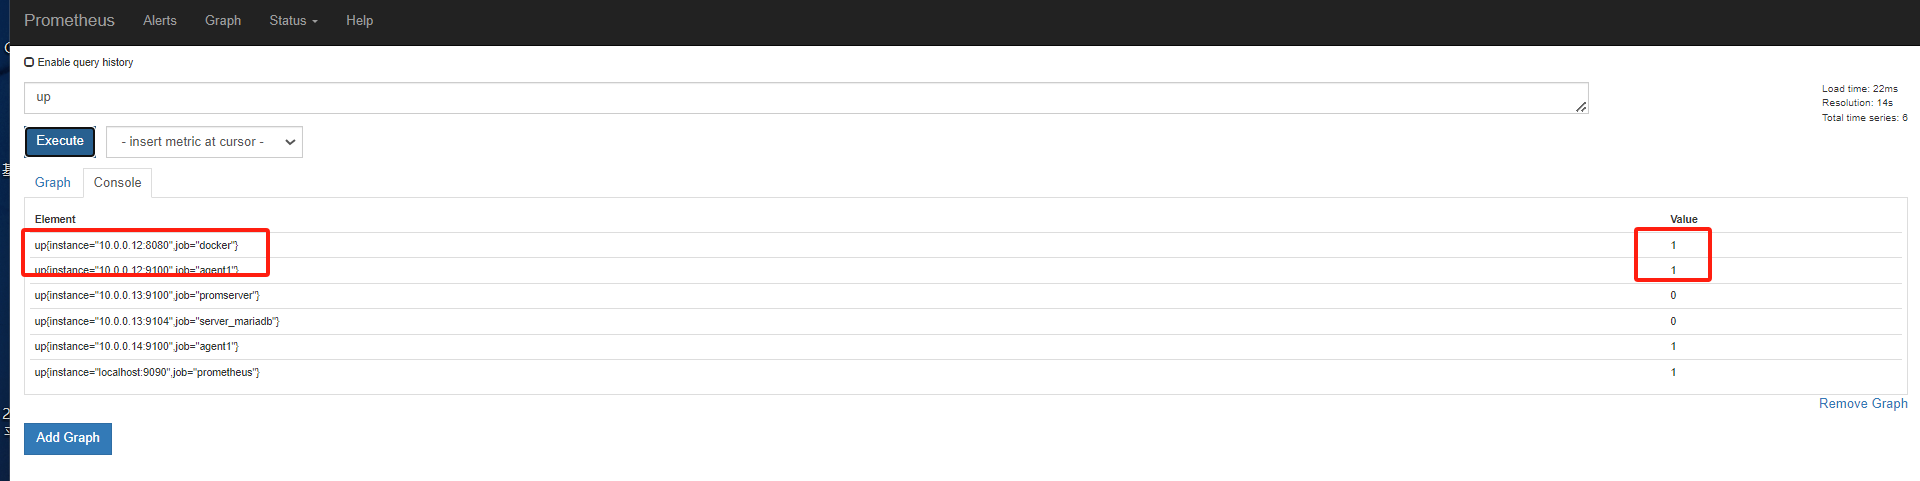
metadata指标
node_systemd_unit_state{name="rsyslog.service"}==1 and on {instance,job} metadata{datacenter="BJ"} 一对一匹配
group_left group_right 多对一 和一对多匹配
我们自己定义的指标
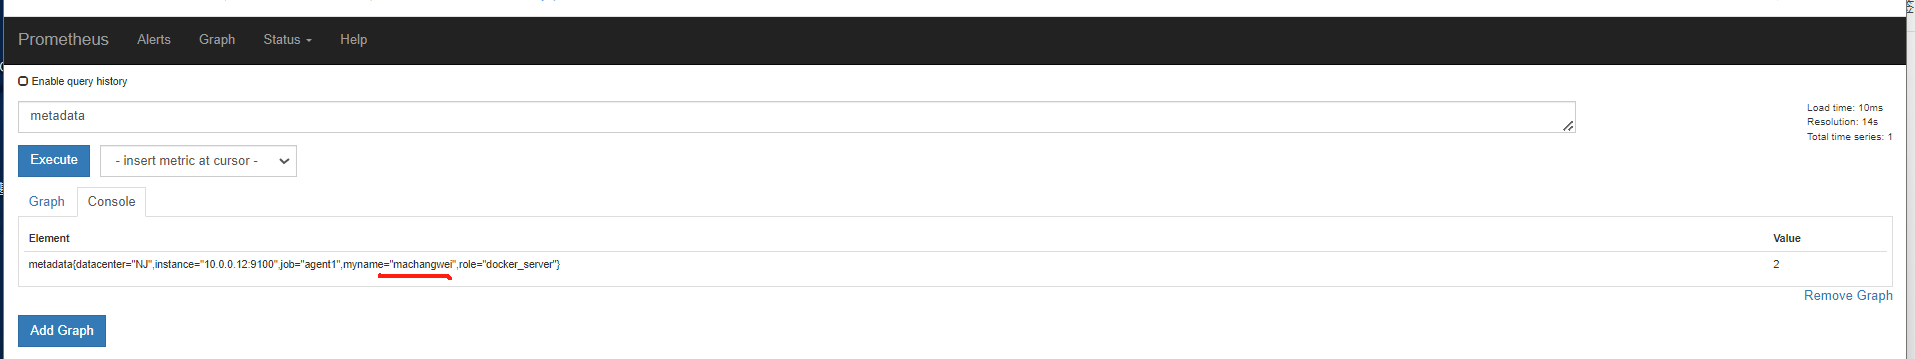
查看另一个指标
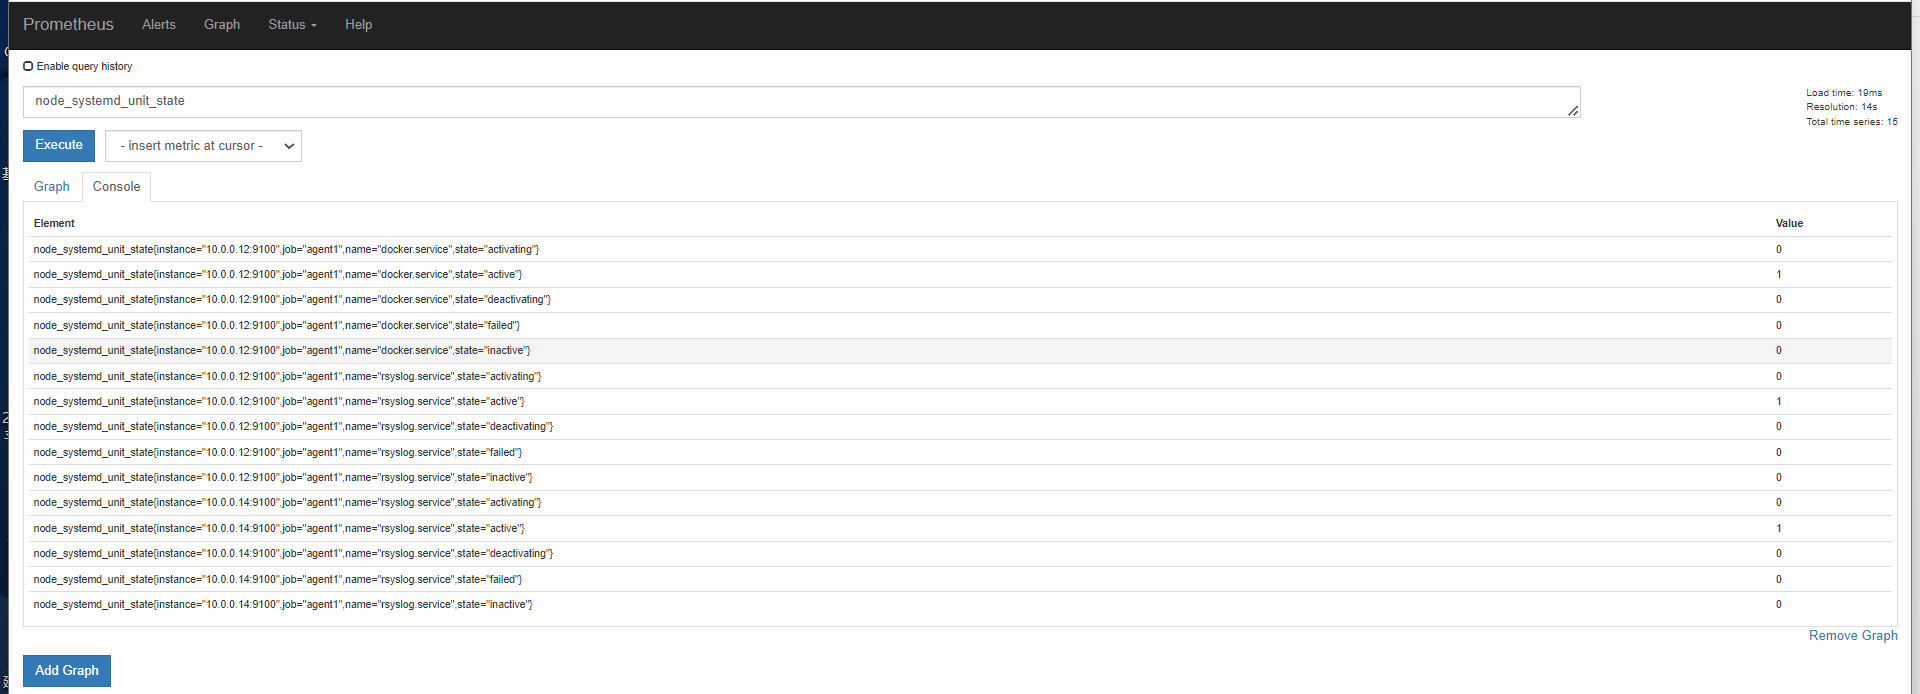
筛选指定服务的。
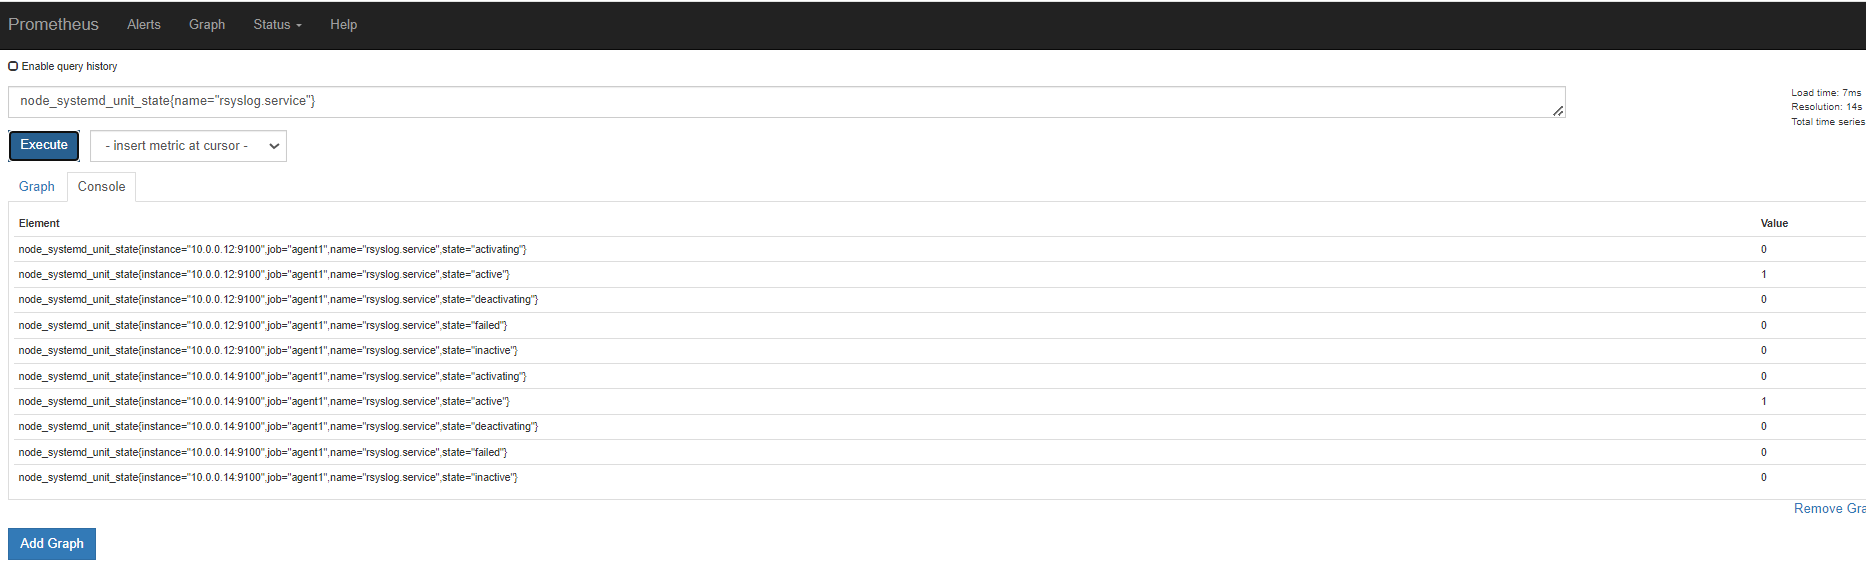
筛选指定服务等于1的,这里都是活跃状态为1。
此时,是有两个主机 12和14主机。
node_systemd_unit_state{name="rsyslog.service"}==1
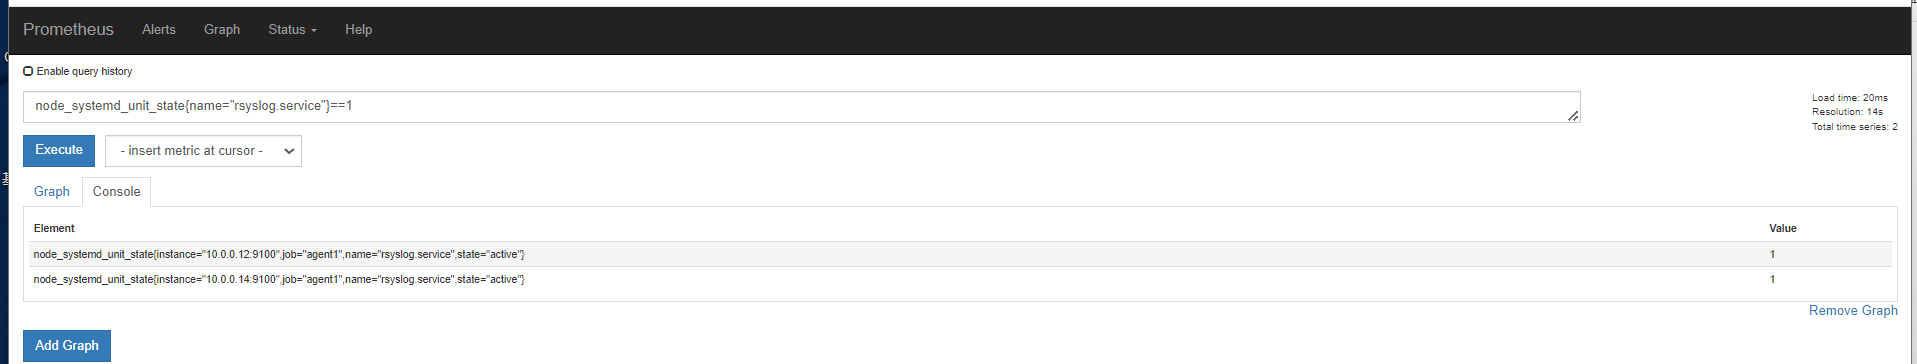
给14添加另外一个自定义的指标。14的是BJ,12是NJ
[root@mcw04 ~]# ps -ef|grep export
root      16709  16652  0 15:57 pts/0    00:00:00 /usr/local/node_exporter/node_exporter --collector.systemd --collector.systemd.unit-whitelist=(docker|ssh|rsyslog).service
root      16726  16652  0 15:58 pts/0    00:00:00 grep --color=auto export
[root@mcw04 ~]#
[root@mcw04 ~]#
[root@mcw04 ~]#
[root@mcw04 ~]# mkdir -p /var/lib/node_exporter/textfile_collector/
[root@mcw04 ~]#  echo 'metadata{role="docker_server",datacenter="NJ",myname="machangwei"}' 2|sudo tee /var/lib/node_exporter/textfile_collector/metaddata.prom
metadata{role="docker_server",datacenter="NJ",myname="machangwei"} 2
[root@mcw04 ~]# vim /var/lib/node_exporter/textfile_collector/metaddata.prom
[root@mcw04 ~]# cat /var/lib/node_exporter/textfile_collector/metaddata.prom
metadata{role="docker_server",datacenter="BJ",myname="machangwei"} 2
[root@mcw04 ~]# kill 16709
[root@mcw04 ~]# nohup /usr/local/node_exporter/node_exporter  --collector.textfile.directory="/var/lib/node_exporter/textfile_collector/" --collector.systemd --collector.systemd.unit-whitelist="(docker|ssh|rsyslog).service" &
[2] 16879
[1]   Terminated              nohup /usr/local/node_exporter/node_exporter --collector.systemd --collector.systemd.unit-whitelist="(docker|ssh|rsyslog).service"
[root@mcw04 ~]# nohup: ignoring input and appending output to ‘nohup.out’

[root@mcw04 ~]#
然后页面可以看到两条数据。我手动修改下这个值

查询的时候,可以很快看到值变为4
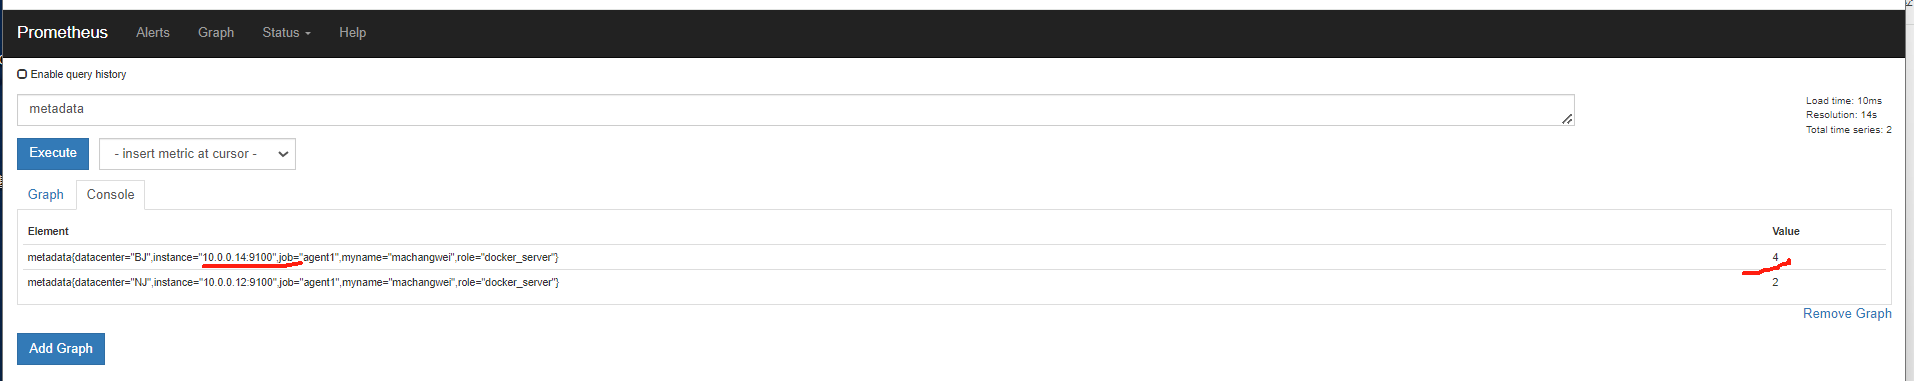
我们再看,筛选后只有一个
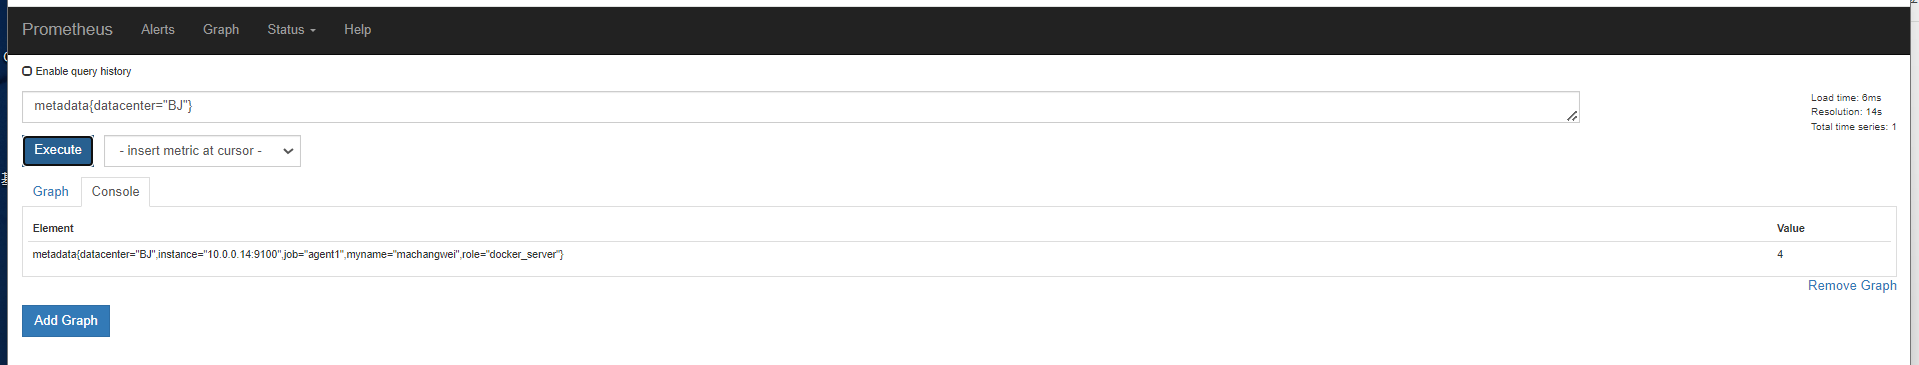
另外一个指标筛选后两条
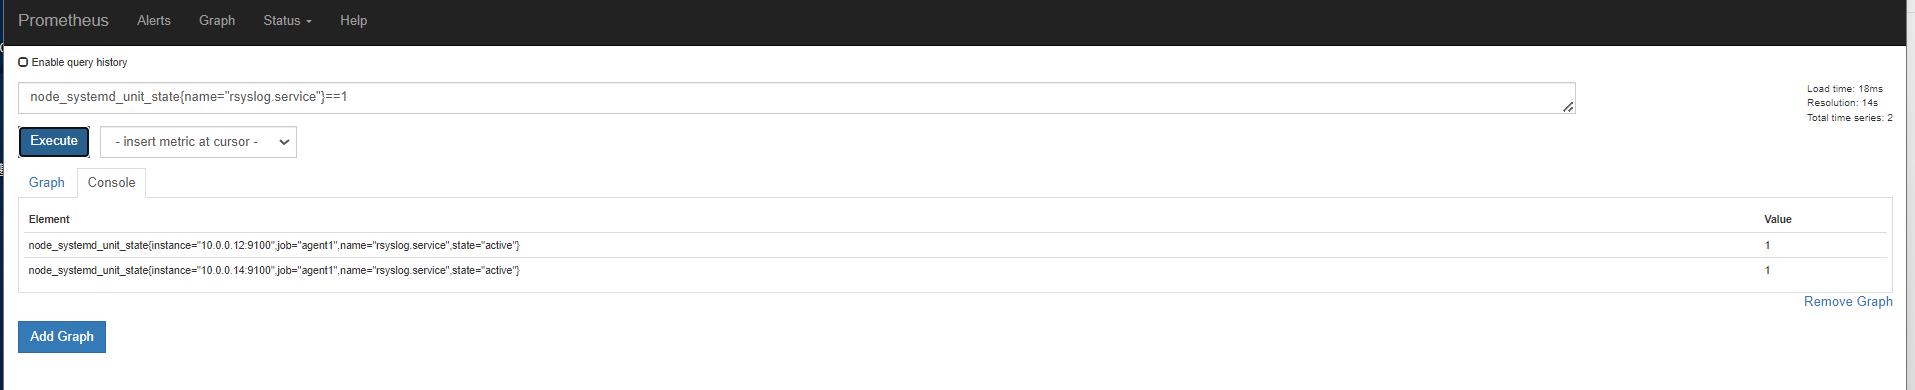
二者合并
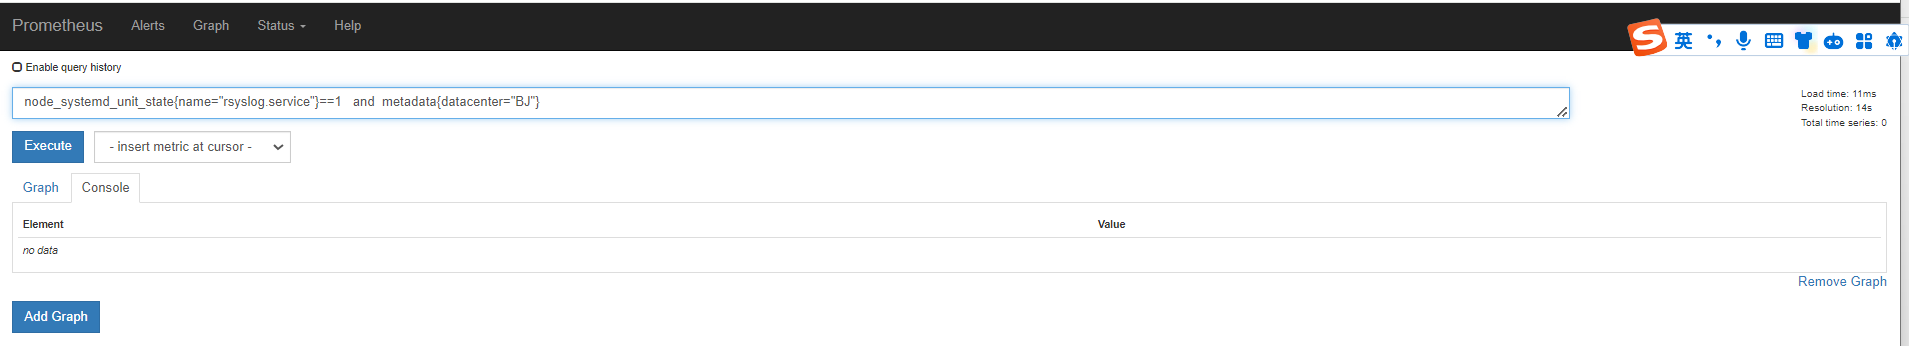
node_systemd_unit_state{name="rsyslog.service"}==1 and on {instance,job} metadata{datacenter="BJ"}
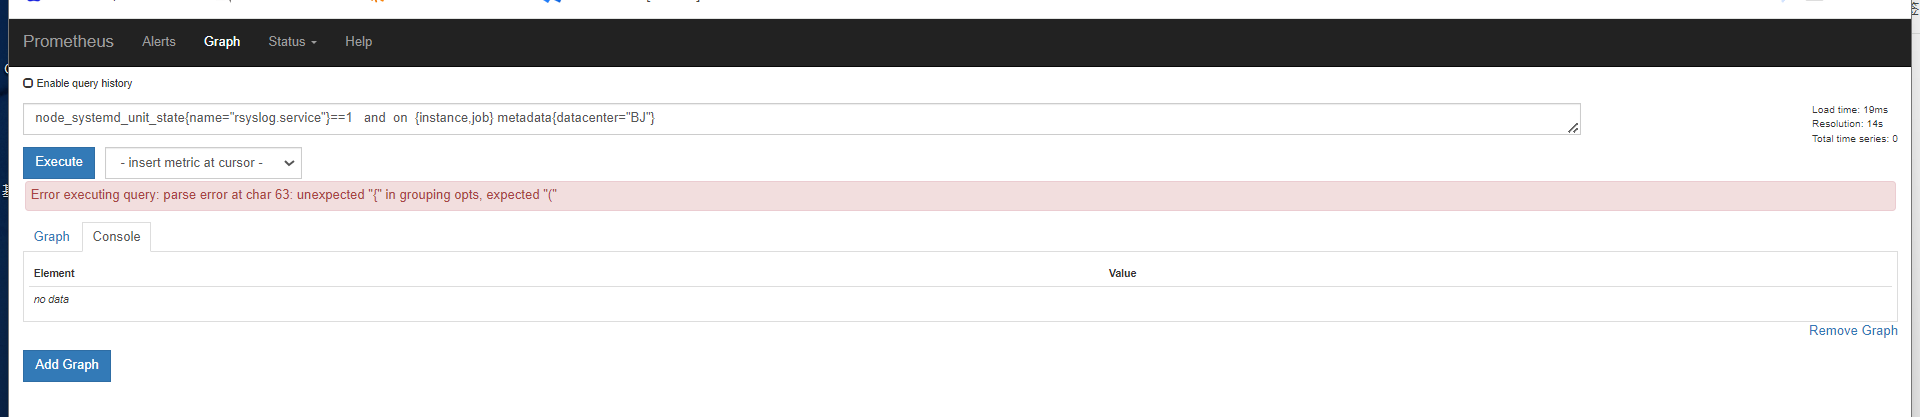
报错了,可能不是这里用的
表达式查询持续化之记录规则
记录规则自动计算频率是evaluation_interval指定的
global:
  scrape_interval:     15s # Set the scrape interval to every 15 seconds. Default is every 1 minute.
  evaluation_interval: 15s # Evaluate rules every 15 seconds. The default is every 1 minute.
新增自己的记录规则
[root@mcw03 ~]# ls /etc/prometheus.yml
/etc/prometheus.yml
[root@mcw03 ~]# mkdir -p /etc/rules
[root@mcw03 ~]# cd /etc/rules
[root@mcw03 rules]# touch node_rules.yml
[root@mcw03 rules]#
[root@mcw03 rules]# vim /etc/prometheus.yml
[root@mcw03 rules]# head -22 /etc/prometheus.yml
# my global config
global:
  scrape_interval:     15s # Set the scrape interval to every 15 seconds. Default is every 1 minute.
  evaluation_interval: 15s # Evaluate rules every 15 seconds. The default is every 1 minute.
  # scrape_timeout is set to the global default (10s).

# Alertmanager configuration
alerting:
  alertmanagers:
  - static_configs:
    - targets:
      # - alertmanager:9093

# Load rules once and periodically evaluate them according to the global 'evaluation_interval'.
rule_files:
  - "rules/node_rules.yaml" #下面创建的是yml文件,这里写错了
  # - "first_rules.yml"
  # - "second_rules.yml"

# A scrape configuration containing exactly one endpoint to scrape:
# Here it's Prometheus itself.
scrape_configs:
rule_files:
  - "rules/node_rules.yaml"
文件内容编辑,以及重载配置。
规则组名称,间隔时间定义了就会覆盖全局默认的更新规则组改为每10s运行一次,而不是全局15秒了
[root@mcw03 rules]# vim /etc/rules/node_rules.yml
[root@mcw03 rules]# cat /etc/rules/node_rules.yml
groups:
  - name: node_rules
    interval: 10s
    rules:
    - record: instance:node_cpu:avg_rate5m
      expr:  100 - avg(irate(node_cpu_seconds_total{job='agent1',mode='idle'}[5m])) by (instance)*100
[root@mcw03 rules]#
[root@mcw03 rules]# curl -X POST http://localhost:9090/-/reload
[root@mcw03 rules]#
没有查到
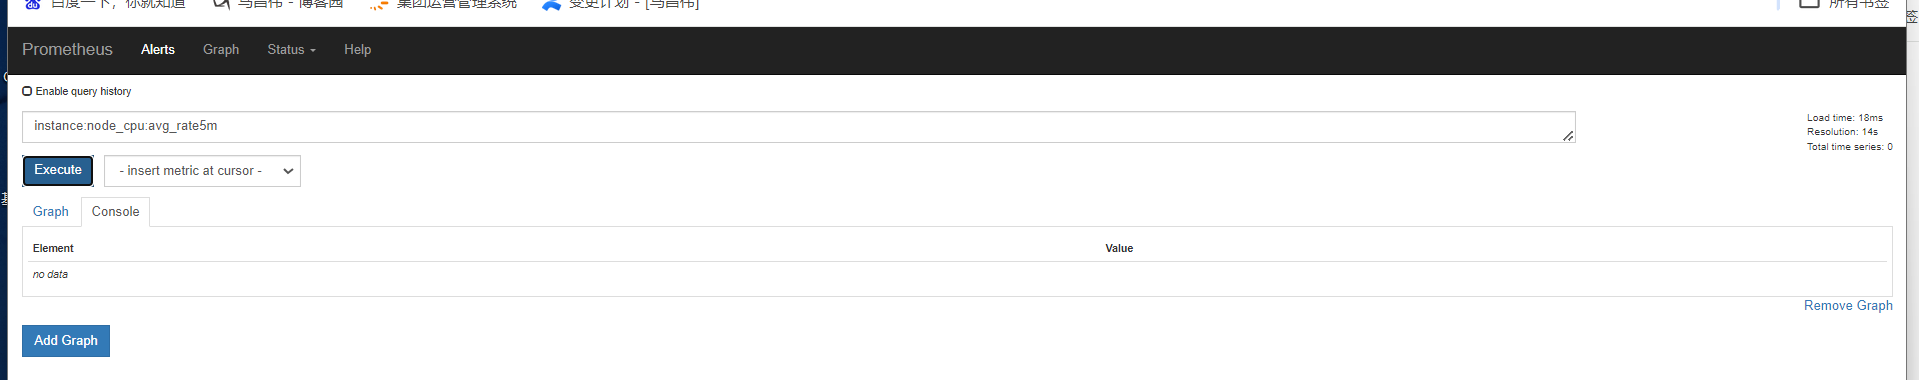
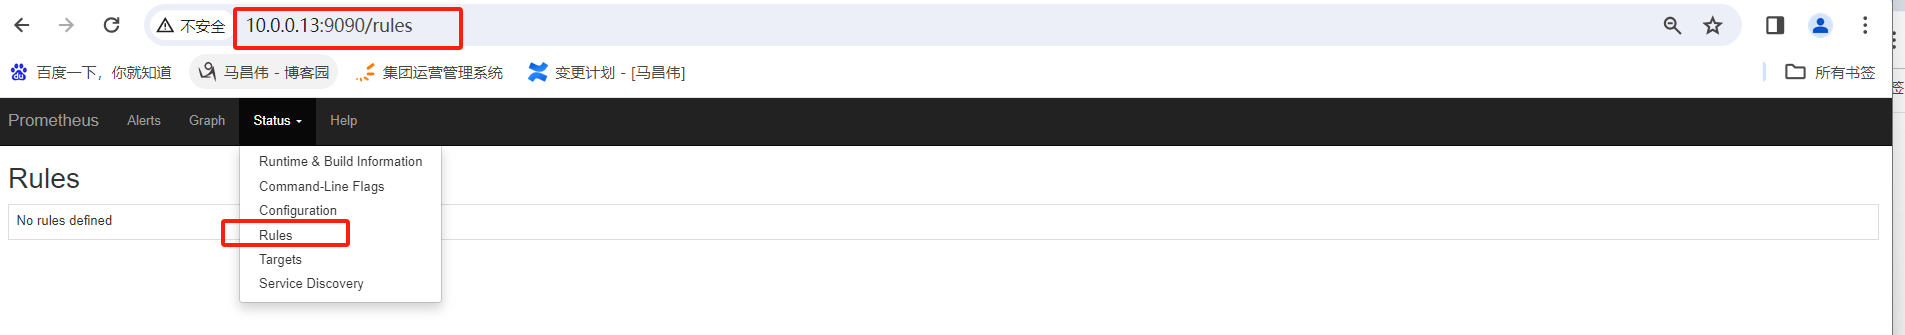
配置文件里指定的文件路径和实际不一致
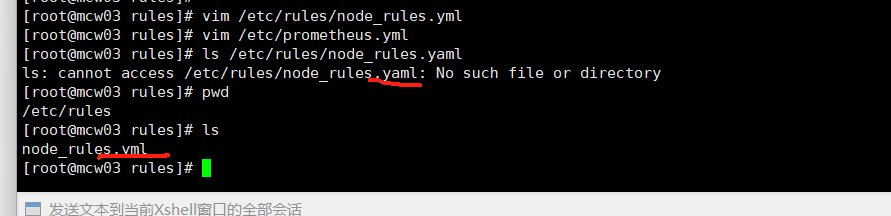
此时改正然后重载后,已经可以看到了,我们定义的记录规则
http://10.0.0.13:9090/rules

[root@mcw03 rules]# cat node_rules.yml
groups:
  - name: node_rules
    interval: 10s
    rules:
    - record: instance:node_cpu:avg_rate5m
      expr:  100 - avg(irate(node_cpu_seconds_total{job='agent1',mode='idle'}[5m])) by (instance)*100
[root@mcw03 rules]#
在表达式浏览器上查询一下这个指标,使用上面的record名称
可以看到,我们之前在使用表达式浏览器生成的表达式,或者的cpu使用率的情况,已经可以直接通过记录规则,来查询到结果,而不是每次都要通过繁杂的指标表达式,去查询,
我们是通过新增记录规则文件,然后新增记录规则,将表达式通过记录名称标识起来,这样后面在表达式浏览器上就可以通过这个名称来找到对应的值。这个名称命名的时候,最好能体现出数据的含义。
instance:node_cpu:avg_rate5m 聚合级别,指标名称,
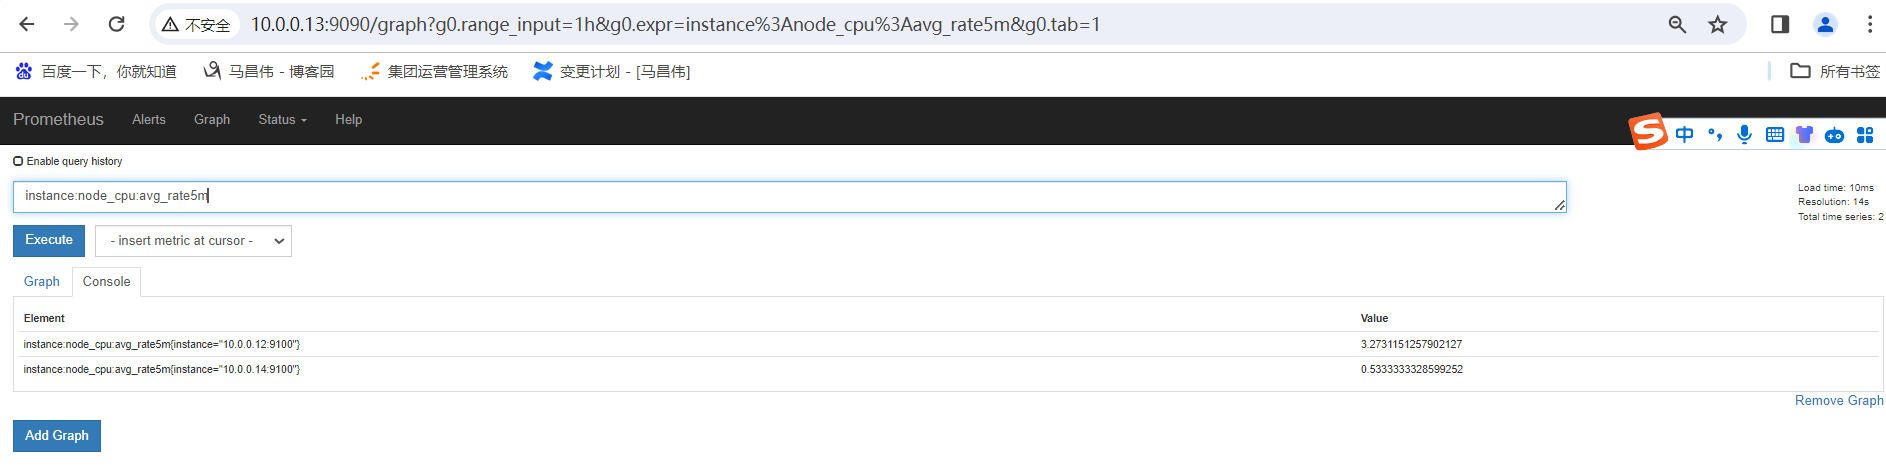
还可以把其它几个,都添加进来。
[root@mcw03 rules]# cat node_rules.yml
groups:
  - name: node_rules
    interval: 10s
    rules:
    - record: instance:node_cpu:avg_rate5m
      expr:  100 - avg(irate(node_cpu_seconds_total{job='agent1',mode='idle'}[5m])) by (instance)*100
    - record: instace:node_memory_usage:percentage
      expr: (node_memory_MemTotal_bytes-(node_memory_MemFree_bytes+node_memory_Buffers_bytes+node_memory_Cached_bytes))/node_memory_MemTotal_bytes*100
  - name: xiaoma_rules
    rules:
    - record: mcw:diskusage
      expr: (node_filesystem_size_bytes{mountpoint="/"}-node_filesystem_free_bytes{mountpoint="/"})/node_filesystem_size_bytes{mountpoint="/"}*100
[root@mcw03 rules]#
[root@mcw03 rules]# curl -X POST http://localhost:9090/-/reload
[root@mcw03 rules]#
我们可以看上面,定义了两个规则组,每个规则组单独可以做些配置,
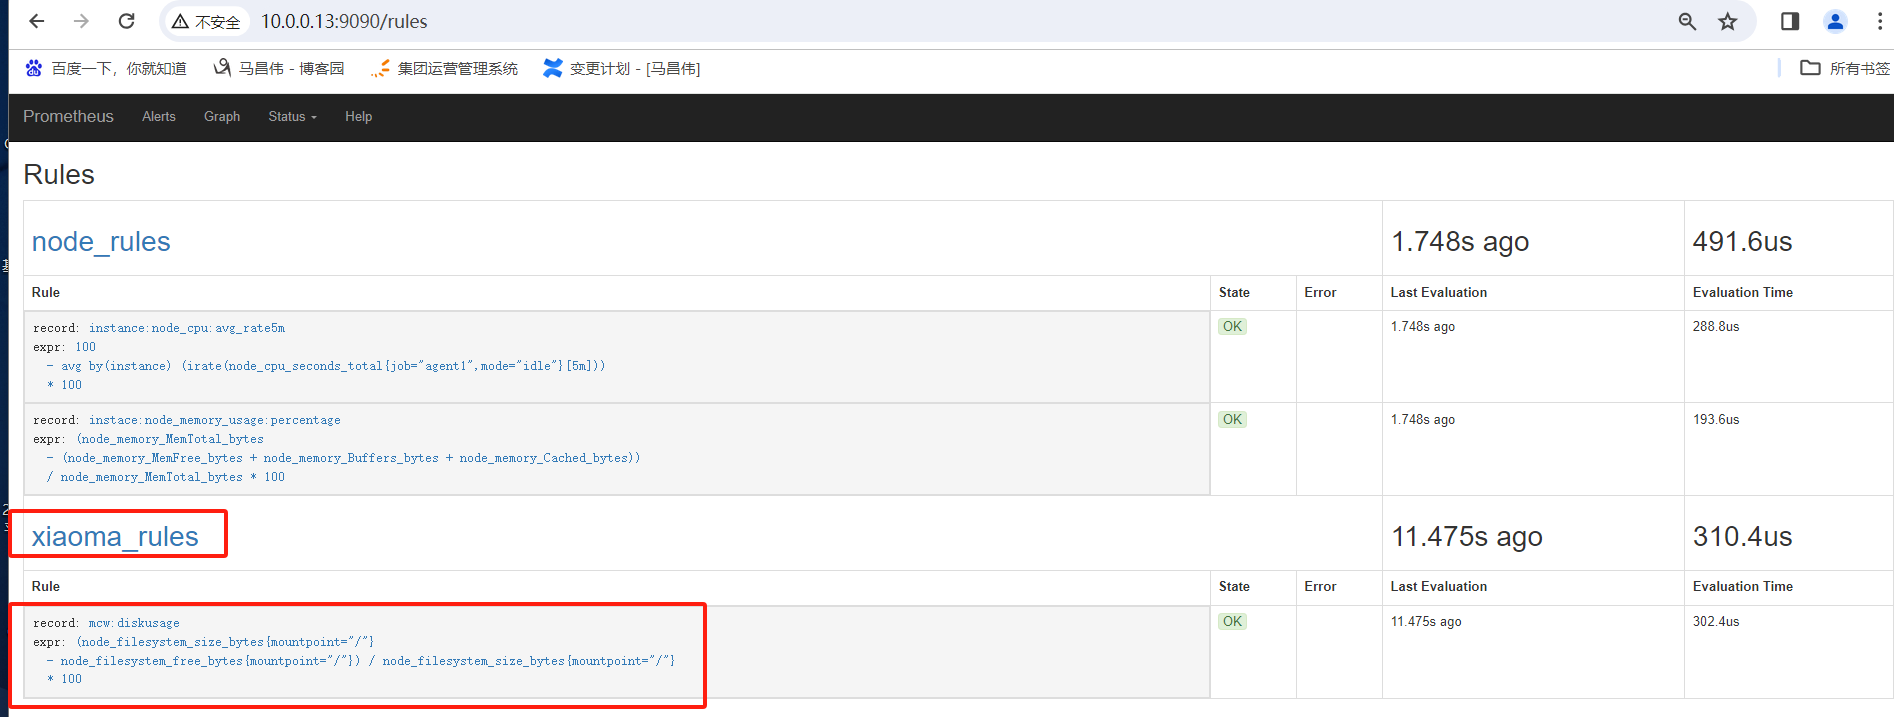
第二个规则组的某个记录规则,我们去表达式浏览器中,也可以查看到表达式是所获取的值。这个就相当于添加了表达式的快捷键,使用字符串调用快捷键似的
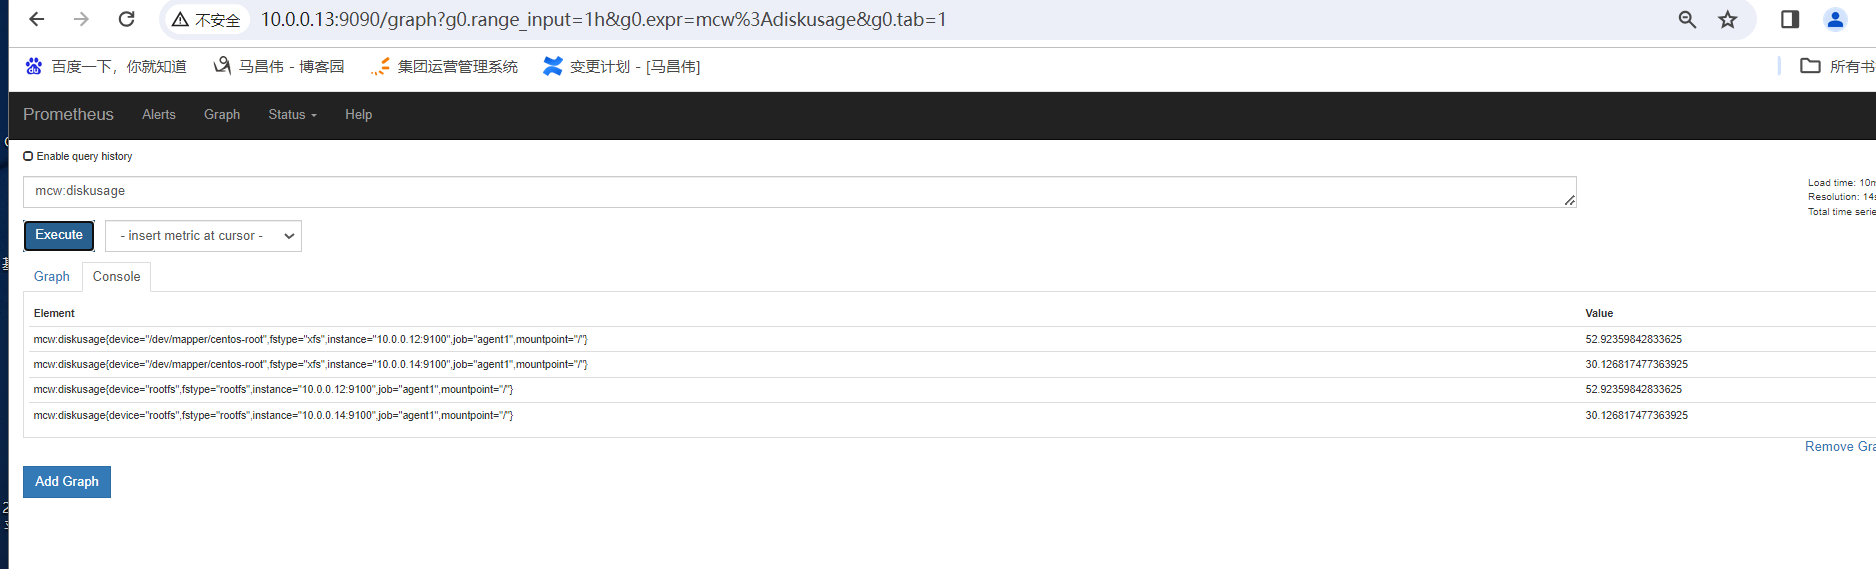
点击链接调转到表达式浏览器,点击record就是用record查询,点击expr就是用expr查询
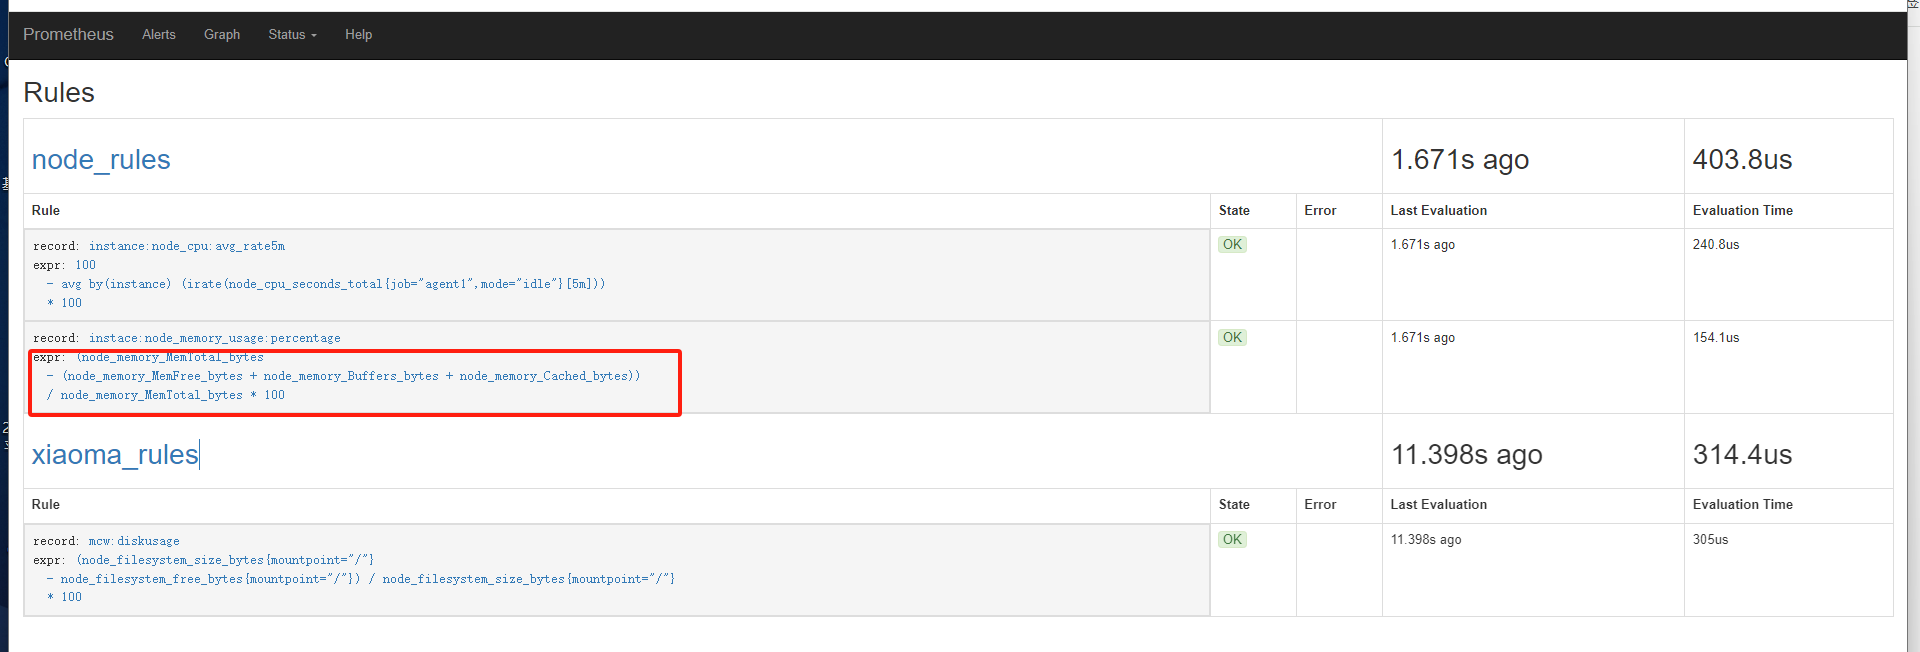
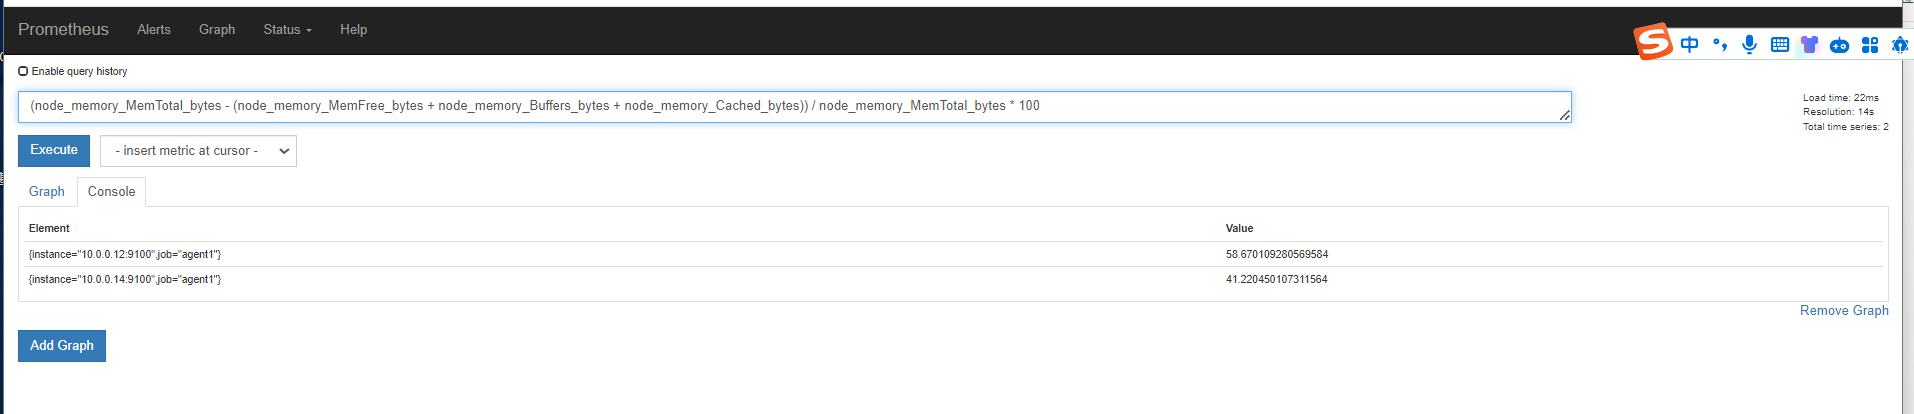
记录规则添加标签
[root@mcw03 ~]# cat /etc/rules/node_rules.yml
groups:
  - name: node_rules
    interval: 10s
    rules:
    - record: instance:node_cpu:avg_rate5m
      expr:  100 - avg(irate(node_cpu_seconds_total{job='agent1',mode='idle'}[5m])) by (instance)*100
    - record: instace:node_memory_usage:percentage
      expr: (node_memory_MemTotal_bytes-(node_memory_MemFree_bytes+node_memory_Buffers_bytes+node_memory_Cached_bytes))/node_memory_MemTotal_bytes*100
      labels:
        metric_type: aggregation
  - name: xiaoma_rules
    rules:
    - record: mcw:diskusage
      expr: (node_filesystem_size_bytes{mountpoint="/"}-node_filesystem_free_bytes{mountpoint="/"})/node_filesystem_size_bytes{mountpoint="/"}*100
[root@mcw03 ~]# curl -X POST http://localhost:9090/-/reload
[root@mcw03 ~]#
在表达式下面加,就会显示在记录规则页面
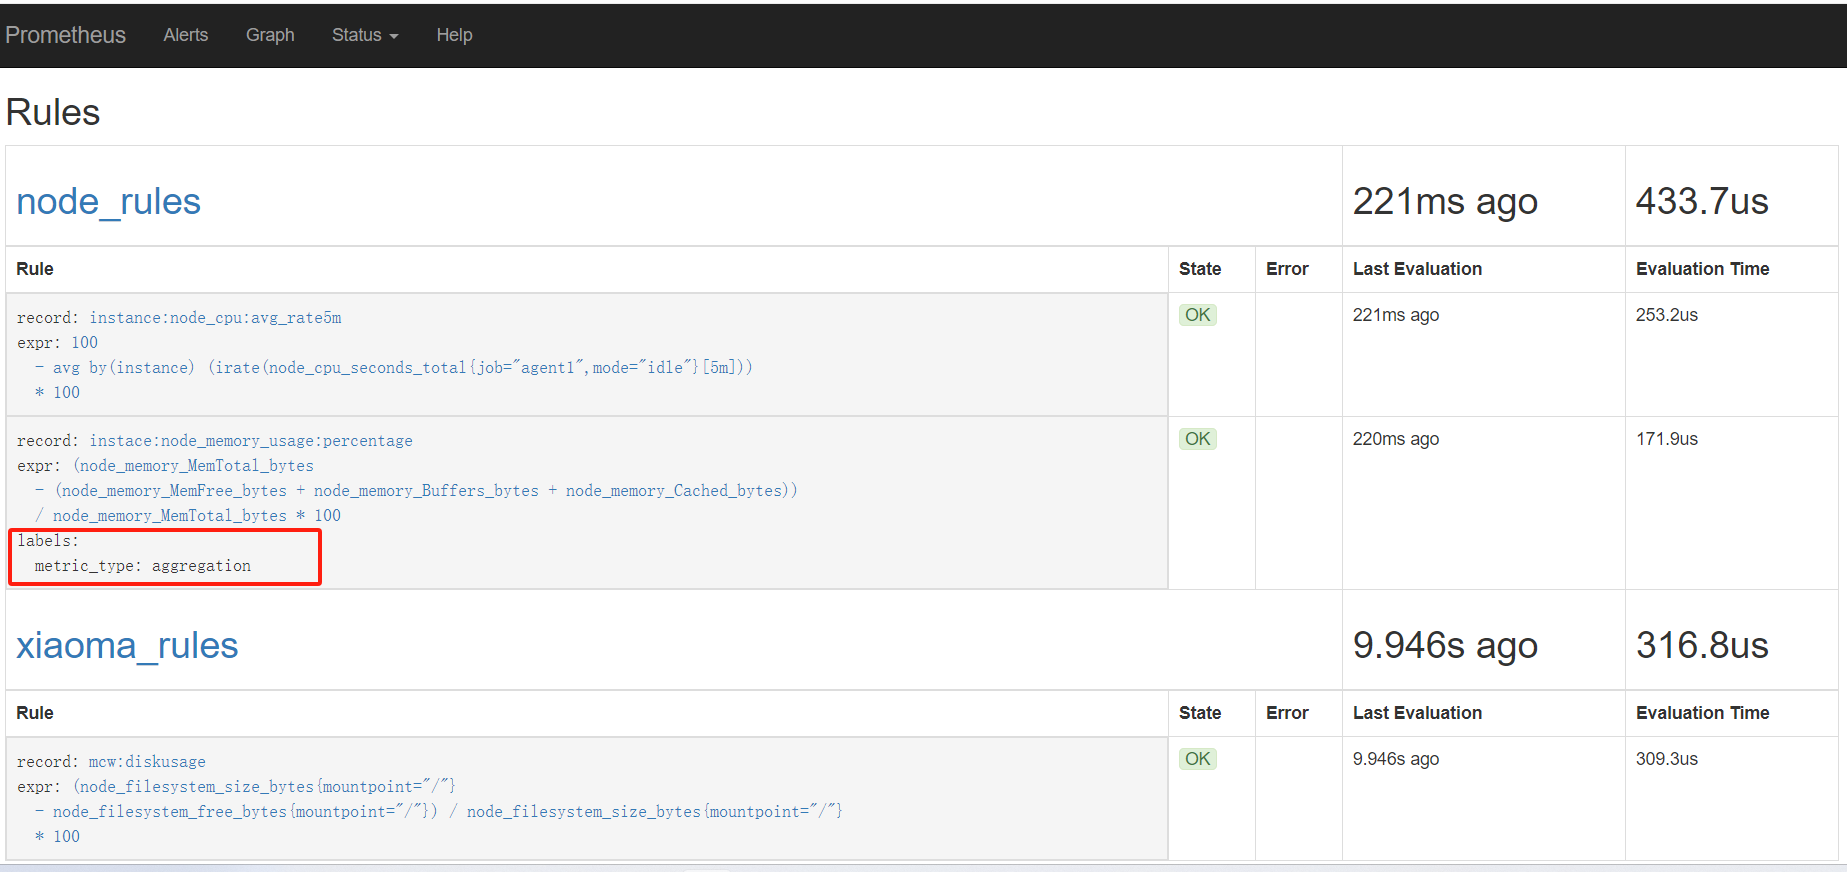
使用规则record去查询的时候,会显示这个标签
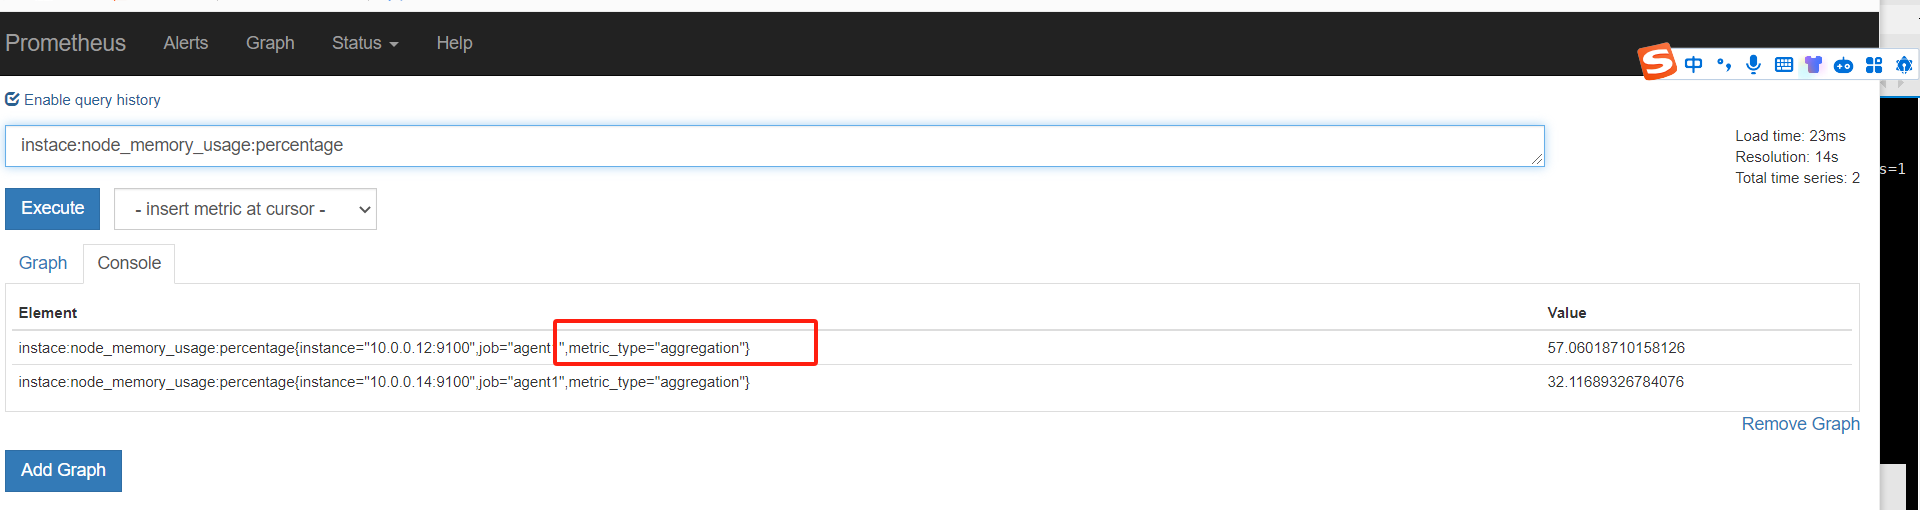
可以新增多个标签,
[root@mcw03 ~]# vim /etc/rules/node_rules.yml
[root@mcw03 ~]# cat /etc/rules/node_rules.yml
groups:
  - name: node_rules
    interval: 10s
    rules:
    - record: instance:node_cpu:avg_rate5m
      expr:  100 - avg(irate(node_cpu_seconds_total{job='agent1',mode='idle'}[5m])) by (instance)*100
    - record: instace:node_memory_usage:percentage
      expr: (node_memory_MemTotal_bytes-(node_memory_MemFree_bytes+node_memory_Buffers_bytes+node_memory_Cached_bytes))/node_memory_MemTotal_bytes*100
      labels:
        metric_type: aggregation
        name: machangwei
  - name: xiaoma_rules
    rules:
    - record: mcw:diskusage
      expr: (node_filesystem_size_bytes{mountpoint="/"}-node_filesystem_free_bytes{mountpoint="/"})/node_filesystem_size_bytes{mountpoint="/"}*100
[root@mcw03 ~]# curl -X POST http://localhost:9090/-/reload
[root@mcw03 ~]#
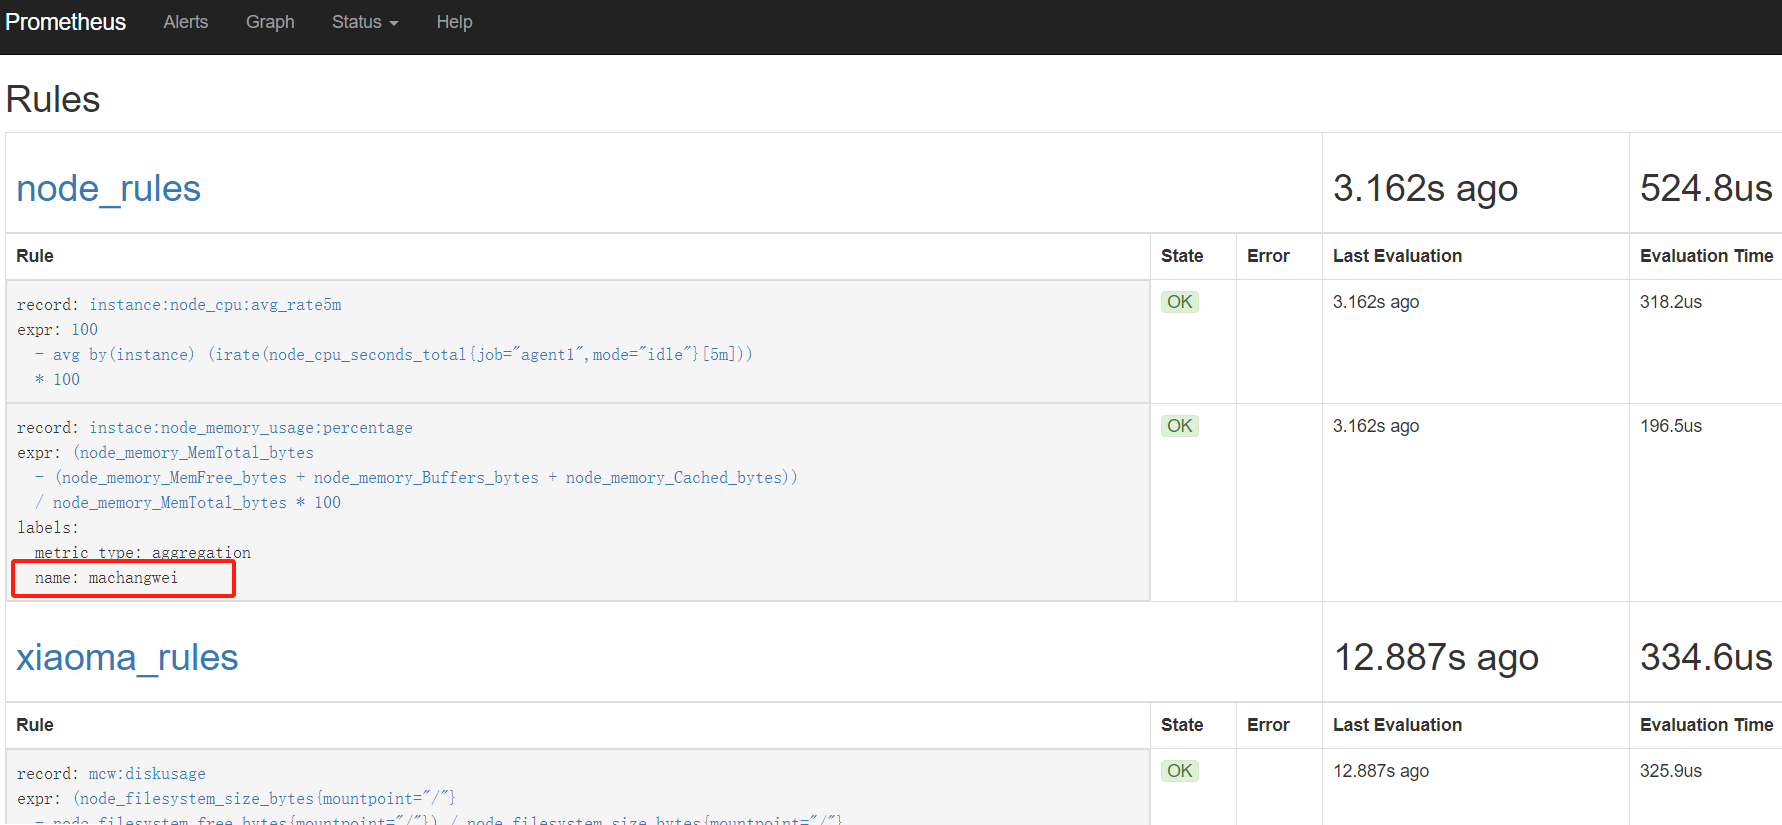
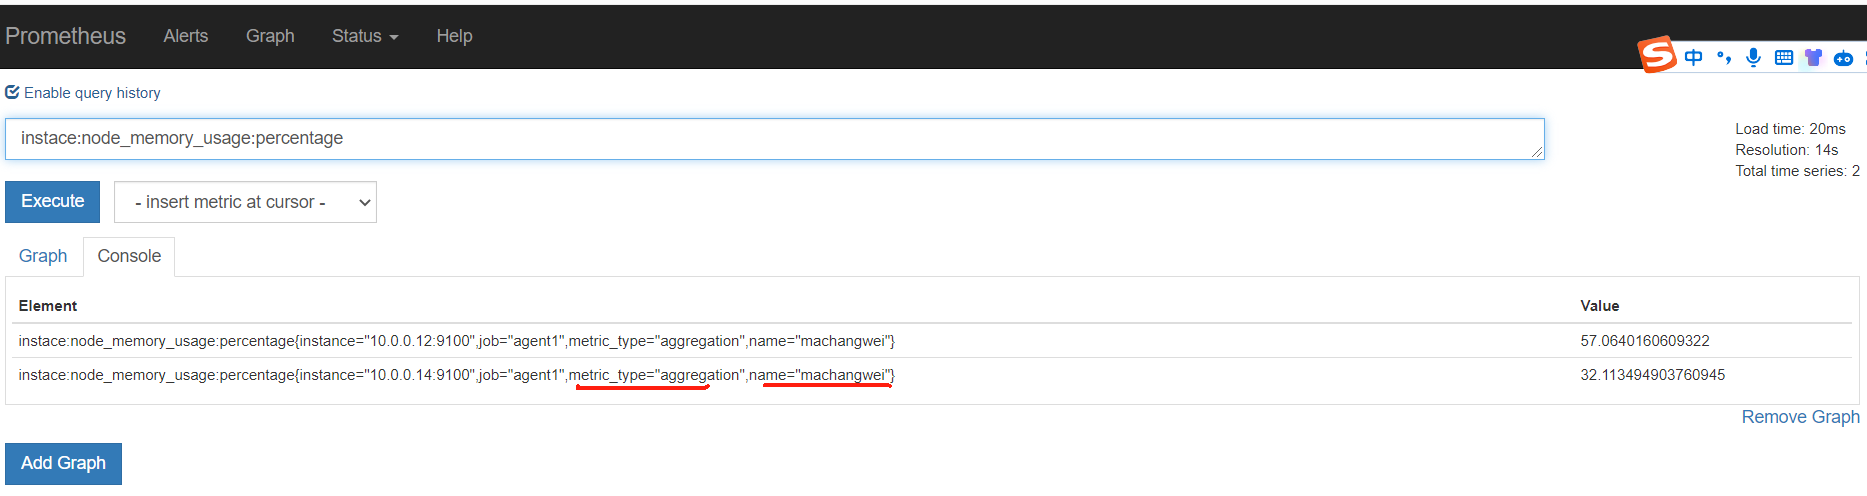
可视化
安装grafana
参考:https://www.jianshu.com/p/3e876fd974f4
不能访问国外网络,所以不能用这里安装仓库
sudo rpm --import https://packagecloud.io/gpg.key
yum install grafana
下载
下载地址:
https://grafana.com/grafana/download?pg=get&plcmt=selfmanaged-box1-cta1&edition=oss

下载/解压:
wget https://dl.grafana.com/oss/release/grafana-9.2.3.linux-amd64.tar.gz
tar -zxvf grafana-9.2.3.linux-amd64.tar.gz
启动
# 注册成系统服务

vim /usr/lib/systemd/system/grafana.service
[Service]
ExecStart=/home/monitor/grafana/grafana-9.2.3/bin/grafana-server --config=/home/monitor/grafana/grafana-9.2.3/conf/defaults.ini  --homepath=/home/monitor/grafana/grafana-9.2.3

[Install]
WantedBy=multi-user.target

[Unit]
Description=grafana
After=network.target


# 重载/开机自启/查看状态/启动
systemctl daemon-reload
systemctl enable grafana
systemctl status grafana
systemctl start grafana

# 查看服务是否启动
lsof -i:3000
ps -ef | grep grafana
测试
浏览器访问地址:
http://127.0.0.1:3000

默认用户名密码:admin/admin
首次登陆需要改密码
@@@
[root@mcw04 ~]# vim /usr/lib/systemd/system/grafana.service
[root@mcw04 ~]# cat /usr/lib/systemd/system/grafana.service
[Service]
ExecStart=/root/grafana-9.2.3/bin/grafana-server --config=/root/grafana-9.2.3/conf/defaults.ini  --homepath=/root/grafana-9.2.3

[Install]
WantedBy=multi-user.target

[Unit]
Description=grafana
After=network.target
[root@mcw04 ~]# ls /root/
\                apache-tomcat-8.5.88         grafana-9.2.3.linux-amd64.tar.gz  mcw.txt                                  python3yizhuang.tar.gz
1.py             apache-tomcat-8.5.88.tar.gz  hadoop-2.8.5.tar.gz               node_exporter-0.16.0.linux-amd64.tar.gz  usr
a                filebeat-6.5.2-x86_64.rpm    ip_forward~                       nohup.out                                zabbix-release-4.0-1.el7.noarch.rpm
anaconda-ks.cfg  grafana-9.2.3                jdk-8u191-linux-x64.tar.gz        original-ks.cfg
[root@mcw04 ~]# ls /root/grafana-9.2.3
bin  conf  LICENSE  NOTICE.md  plugins-bundled  public  README.md  scripts  VERSION
[root@mcw04 ~]# ls /root/grafana-9.2.3/conf/
defaults.ini  ldap_multiple.toml  ldap.toml  provisioning  sample.ini
[root@mcw04 ~]# ls /root/grafana-9.2.3/bin/
grafana-cli  grafana-cli.md5  grafana-server  grafana-server.md5
[root@mcw04 ~]#
[root@mcw04 ~]# systemctl daemon-reload
[root@mcw04 ~]# systemctl enable grafana
Created symlink from /etc/systemd/system/multi-user.target.wants/grafana.service to /usr/lib/systemd/system/grafana.service.
[root@mcw04 ~]# systemctl status grafana
● grafana.service - grafana
   Loaded: loaded (/usr/lib/systemd/system/grafana.service; enabled; vendor preset: disabled)
   Active: inactive (dead)
[root@mcw04 ~]# systemctl start grafana
[root@mcw04 ~]# lsof -i:3000
-bash: lsof: command not found
[root@mcw04 ~]# ps -ef | grep grafana
root      19589      1  9 19:06 ?        00:00:01 /root/grafana-9.2.3/bin/grafana-server --config=/root/grafana-9.2.3/conf/defaults.ini --homepath=/root/grafana-9.2.3
root      19604  16652  0 19:06 pts/0    00:00:00 grep --color=auto grafana
[root@mcw04 ~]# ss -lntup|grep 3000
tcp    LISTEN     0      16384    :::3000                 :::*                   users:(("grafana-server",pid=19589,fd=11))
[root@mcw04 ~]#
http://10.0.0.14:3000/

https://www.jianshu.com/p/3e876fd974f4
4、使用:
配置Grafana数据源
4.1 添加prometheus数据源:
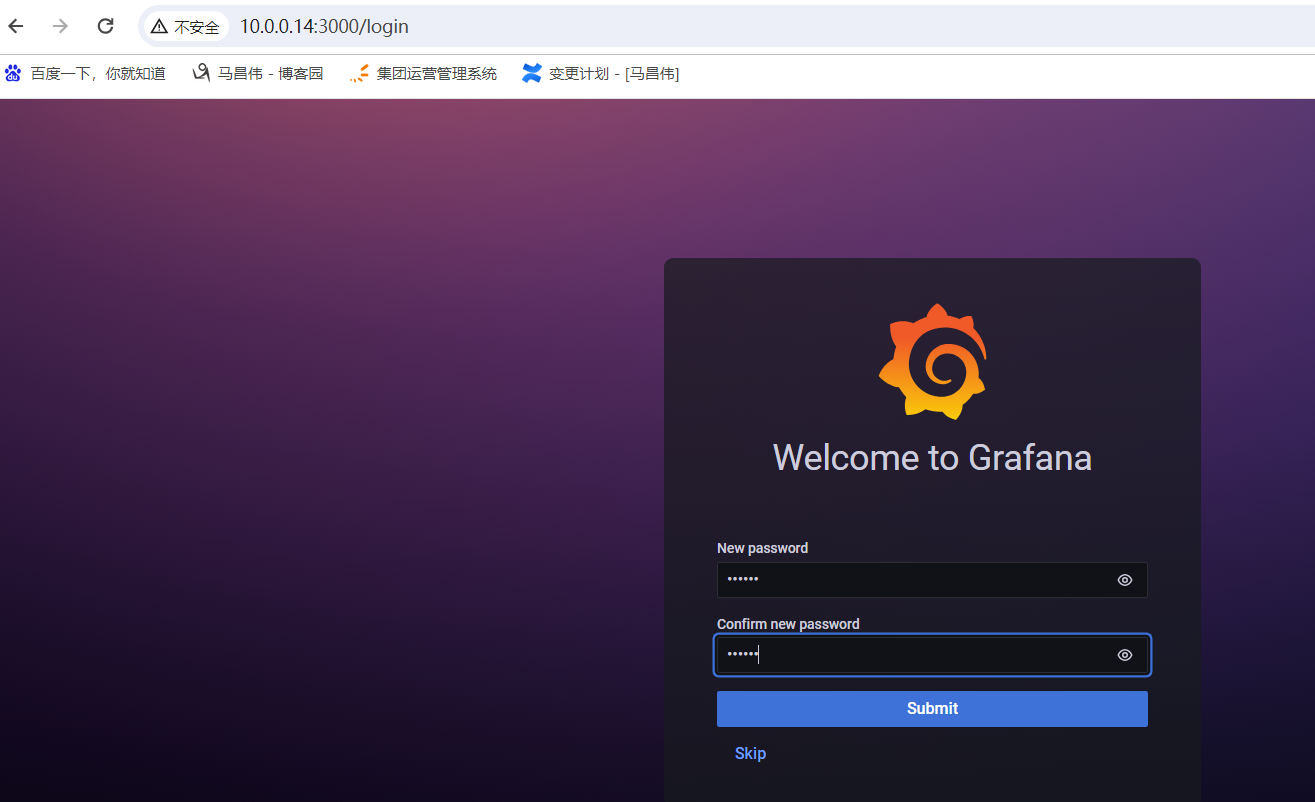

添加数据源
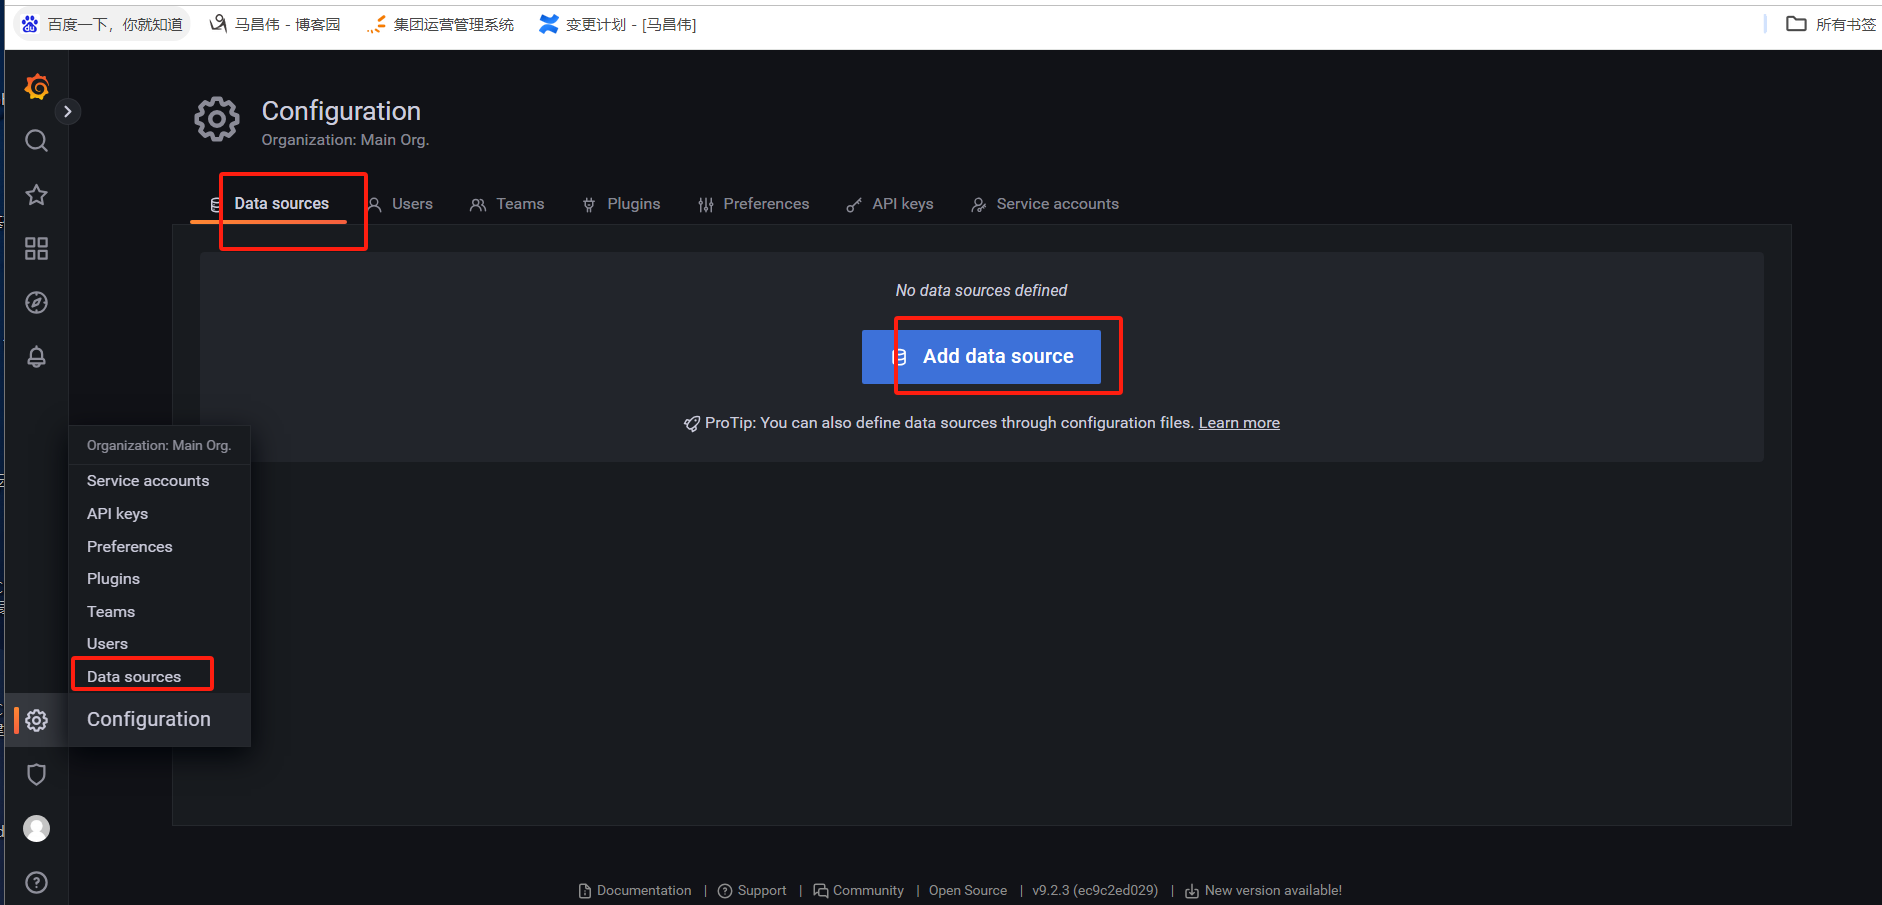

改为Prometheus地址
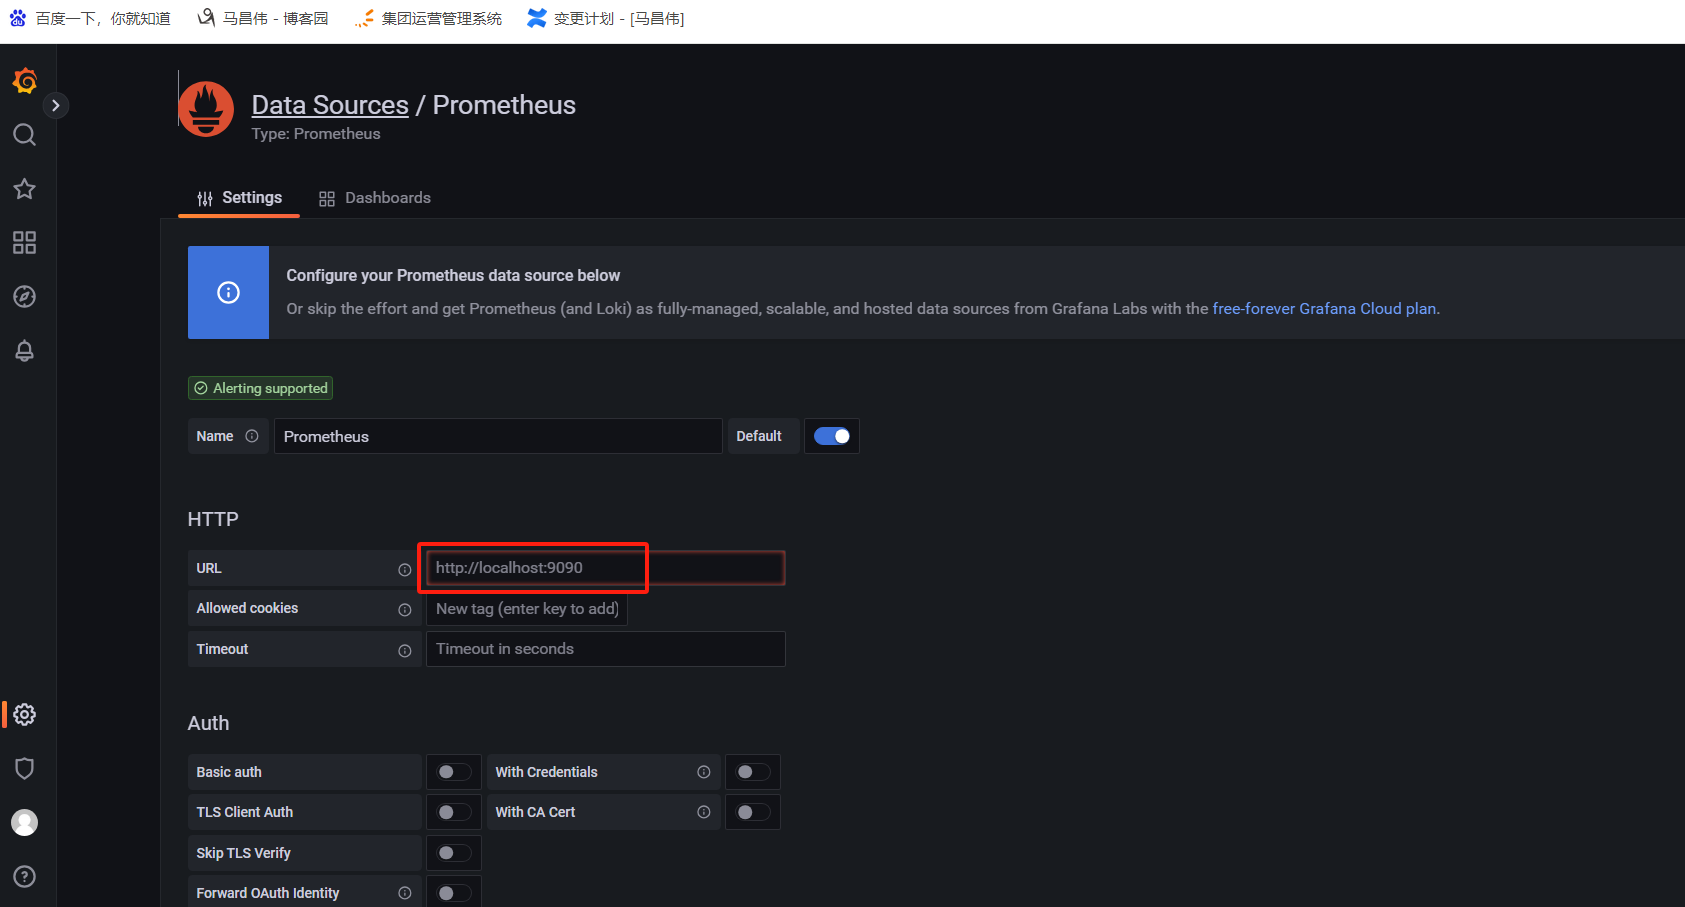
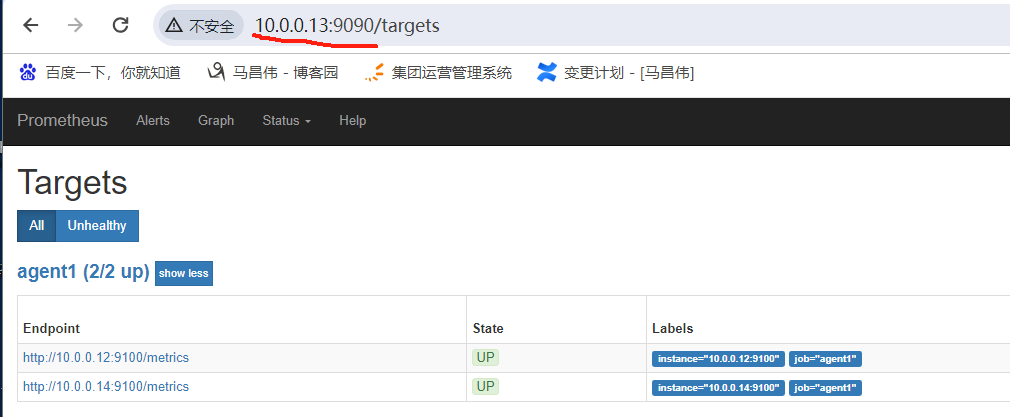
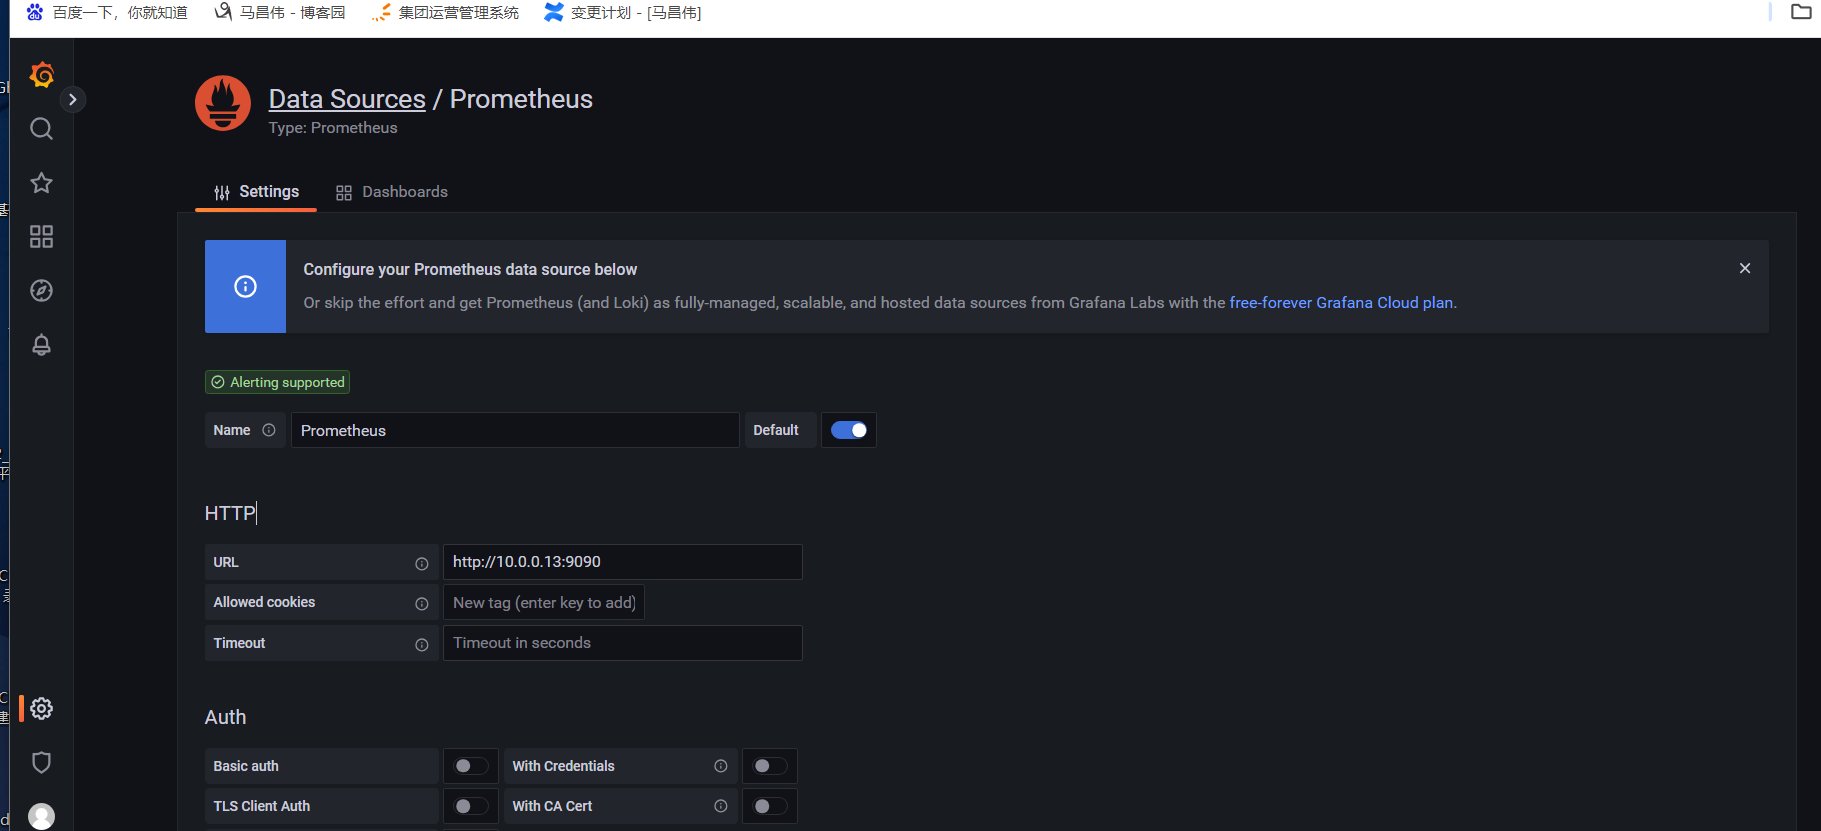
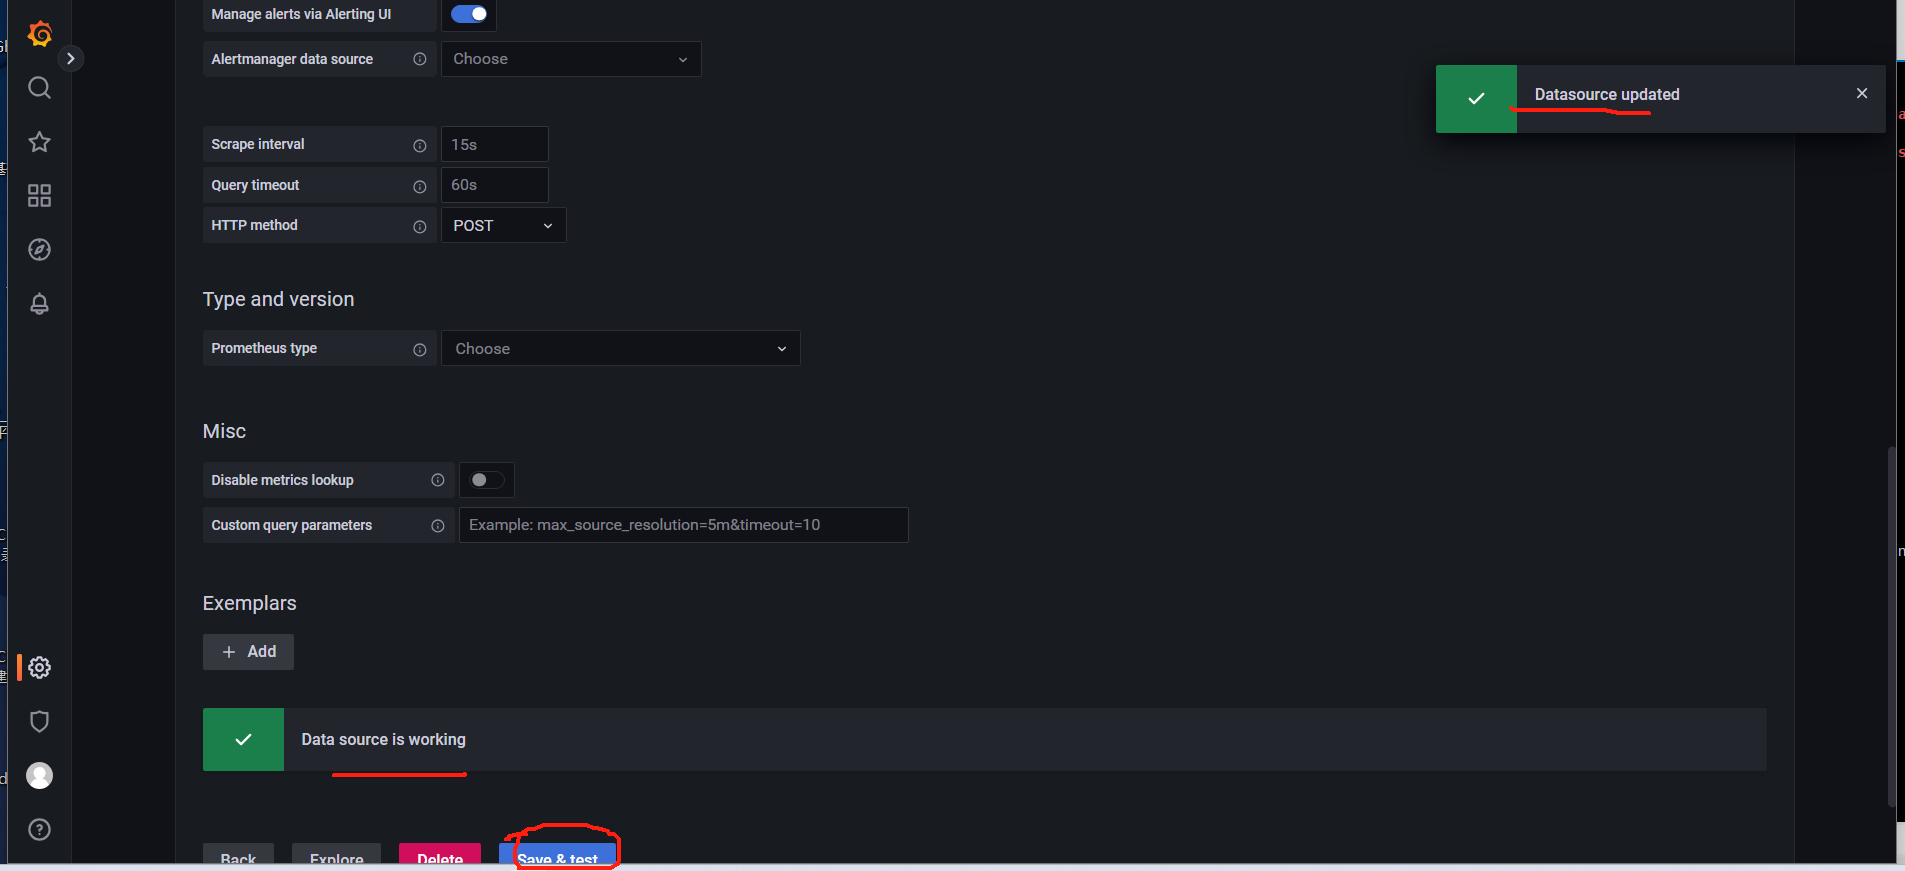
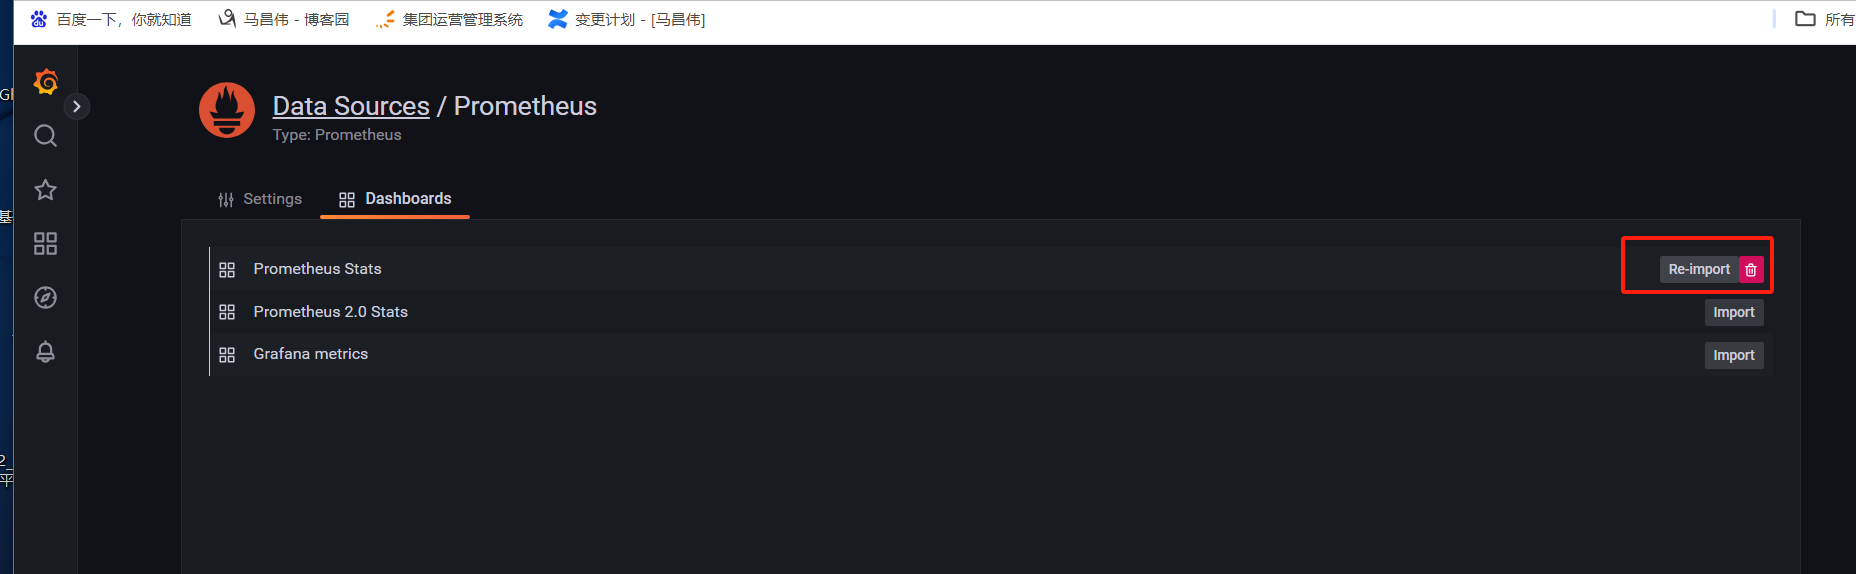
这里以pulsar服务为例:
(1)Dashboard 模板从 github 这里(https://github.com/bilahepan/Pulsar-Simple-Dashboard)获取,下载到本地
(2)选择上传导入 Dashboard模版(这里以 “Pulsar 集群总况.json” 模板为例)
https://grafana.com/grafana/dashboards/
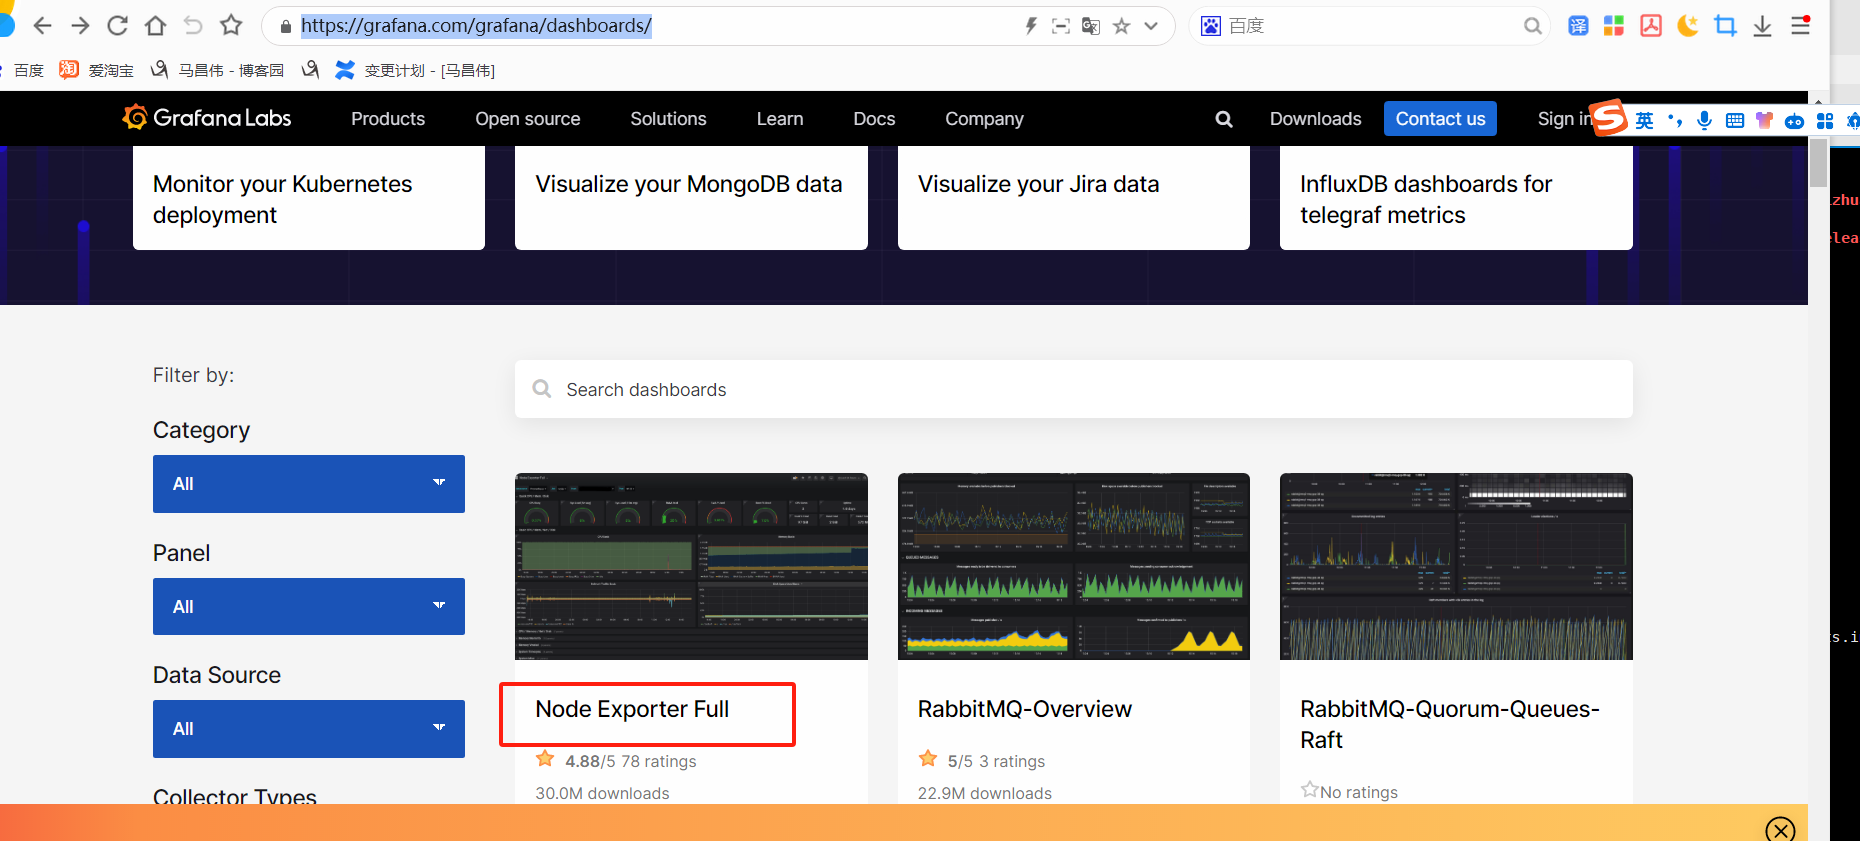
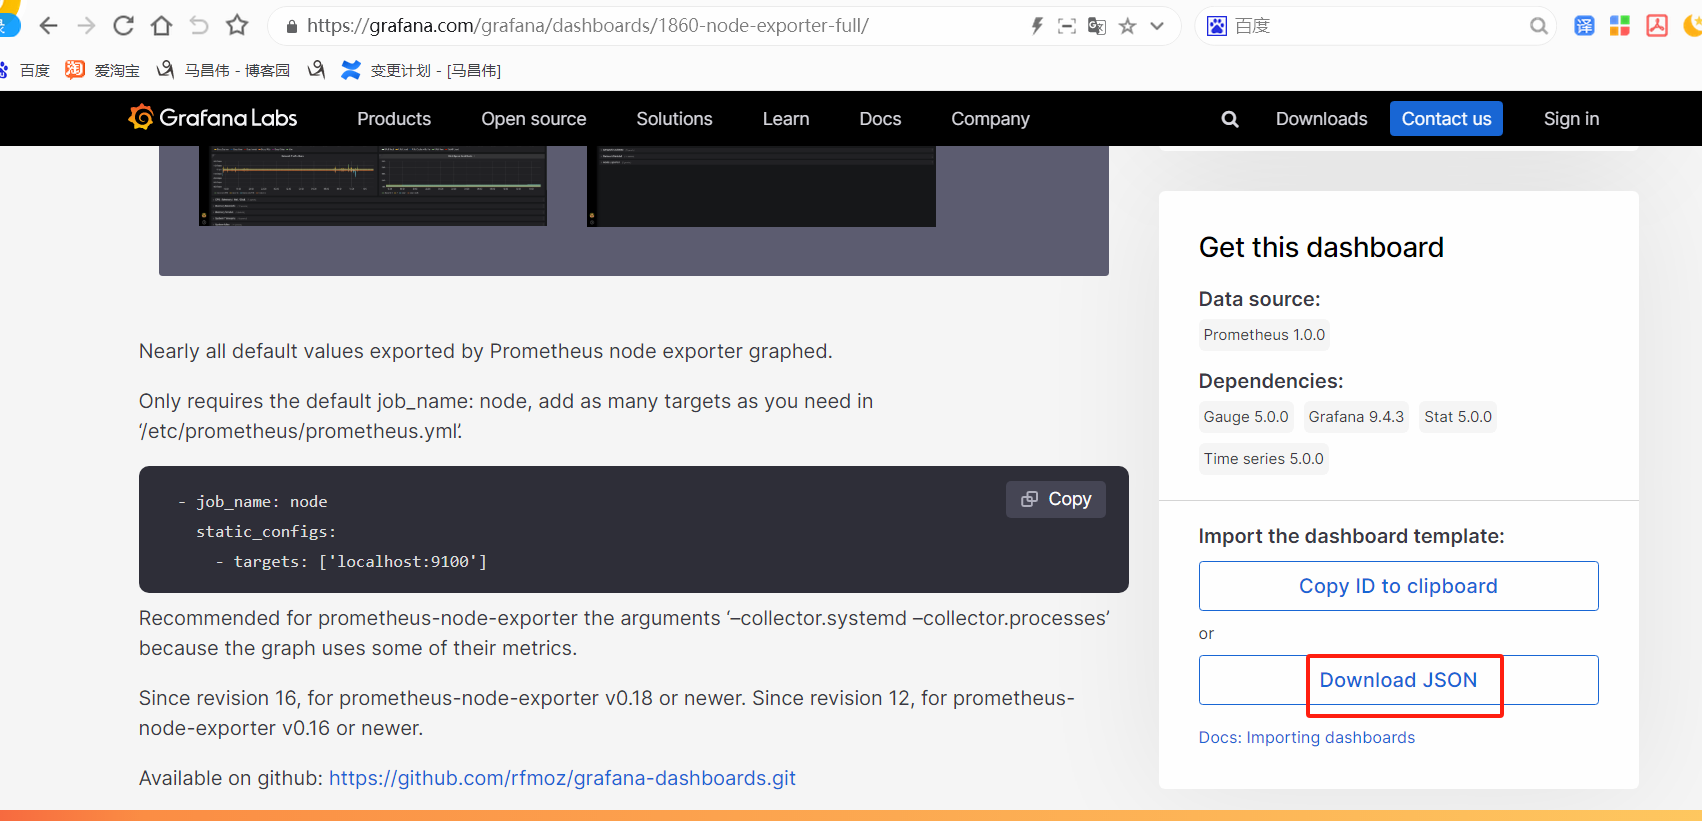

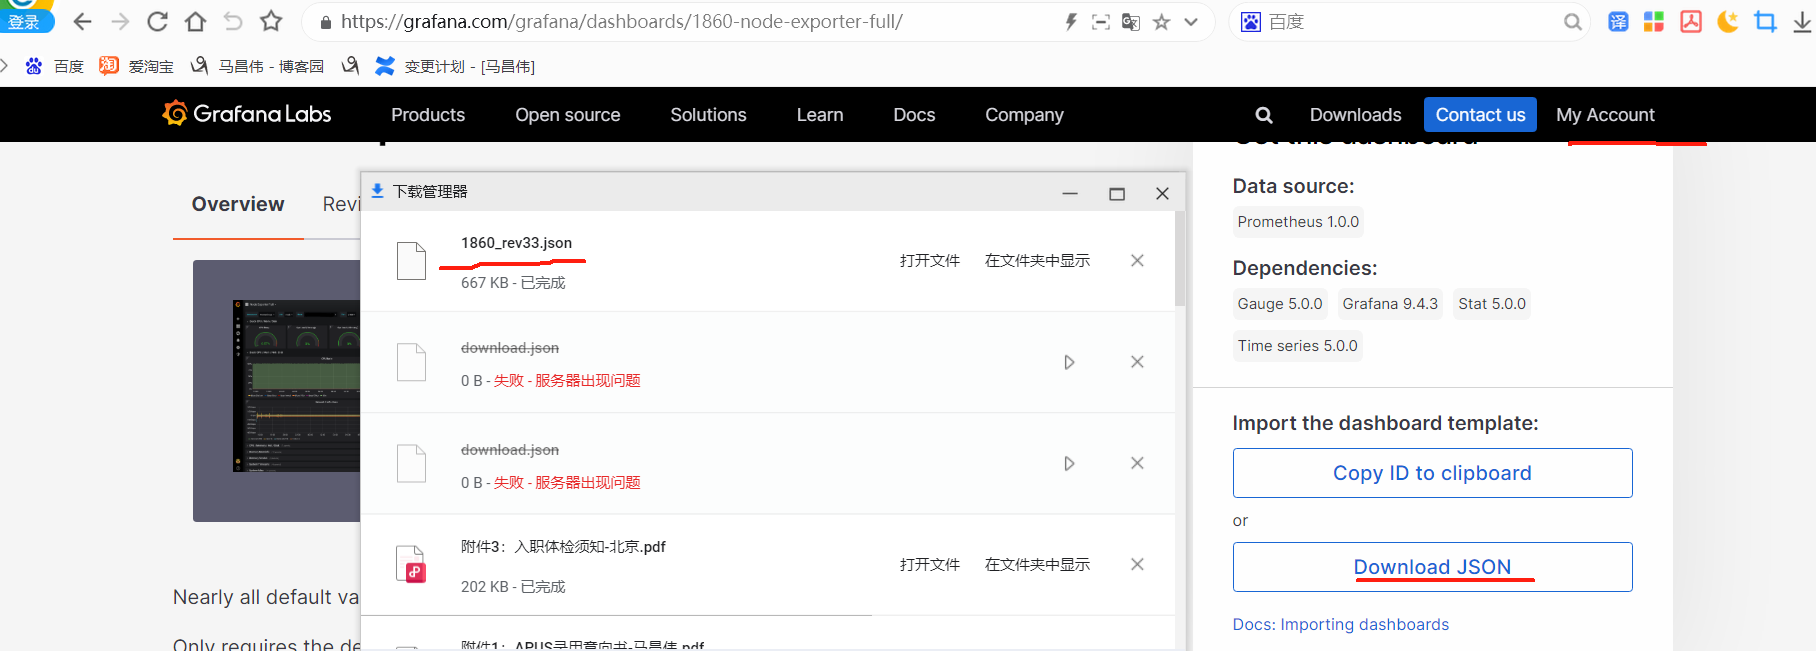
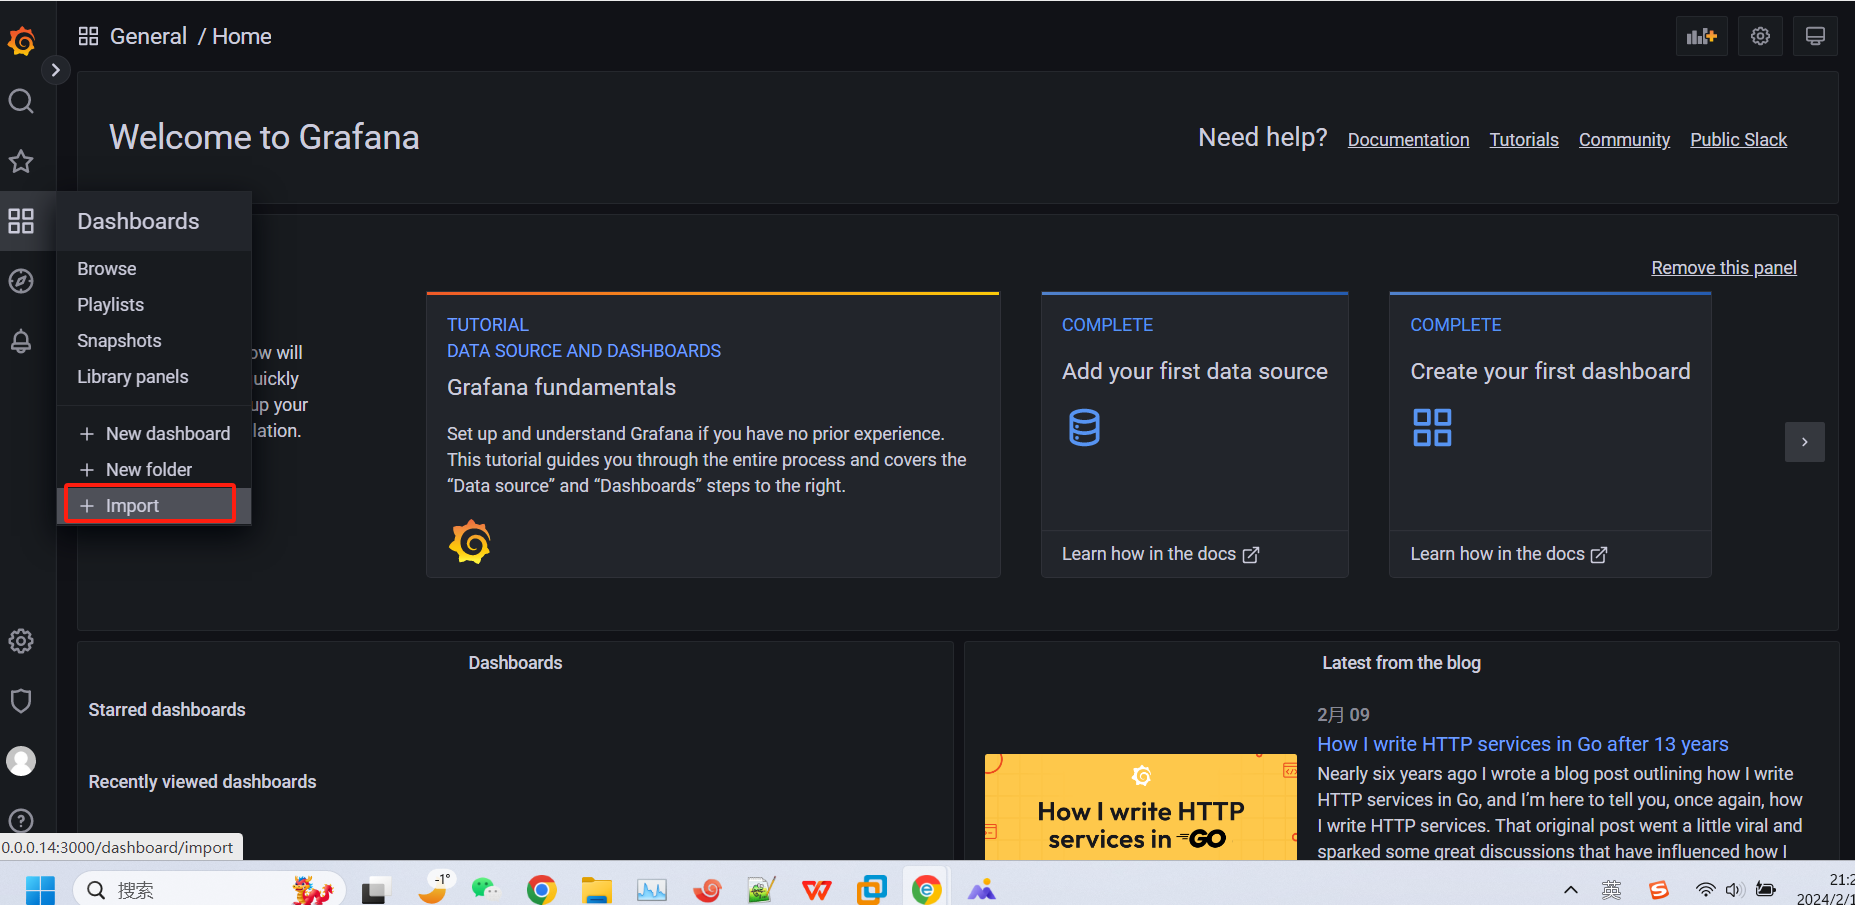
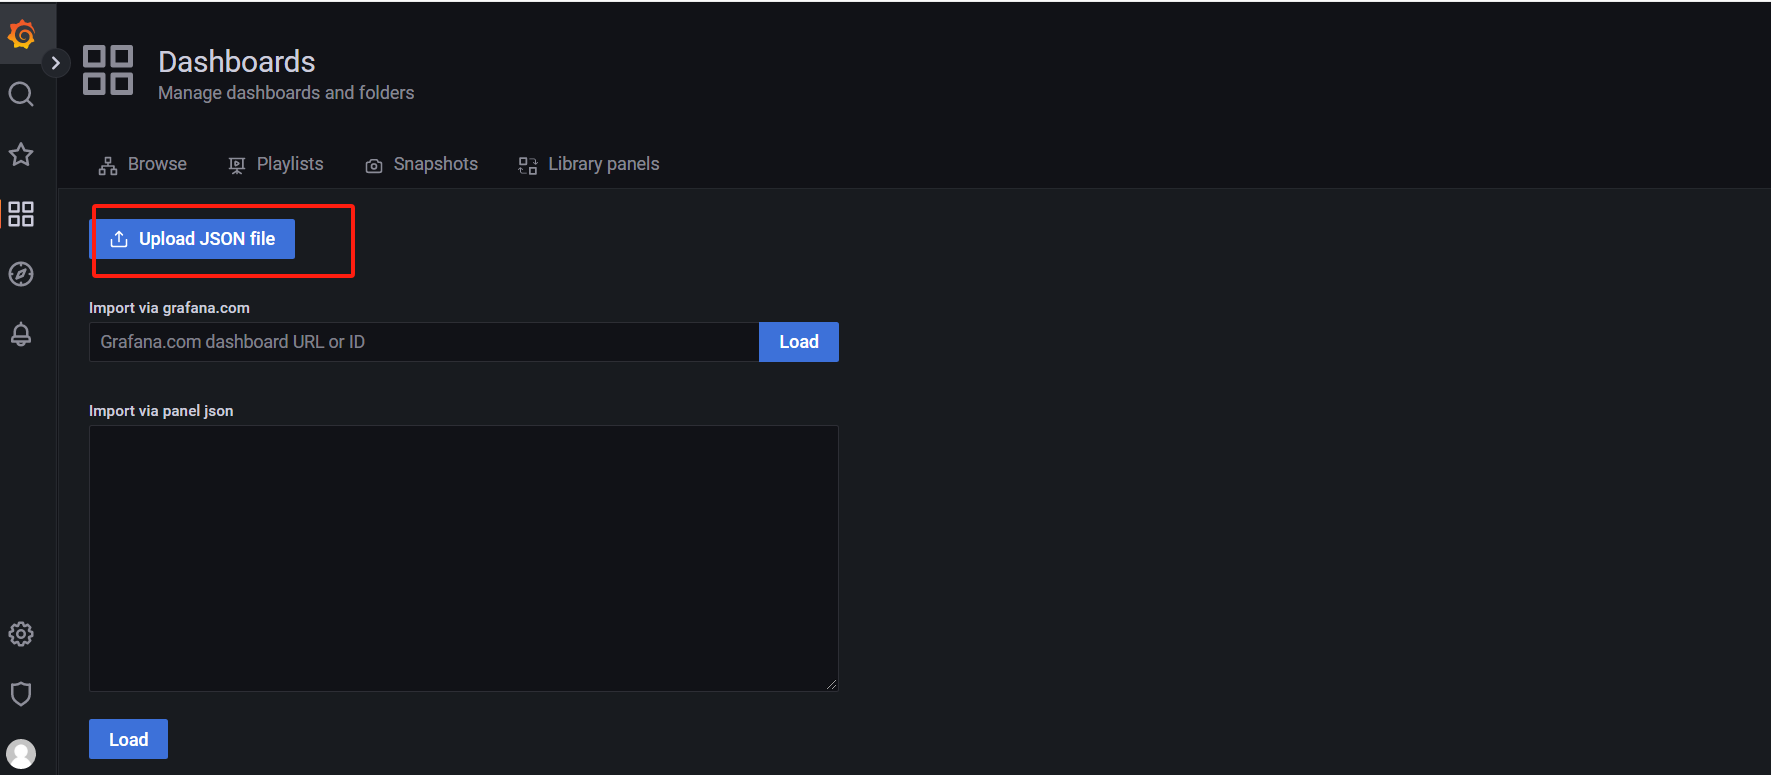
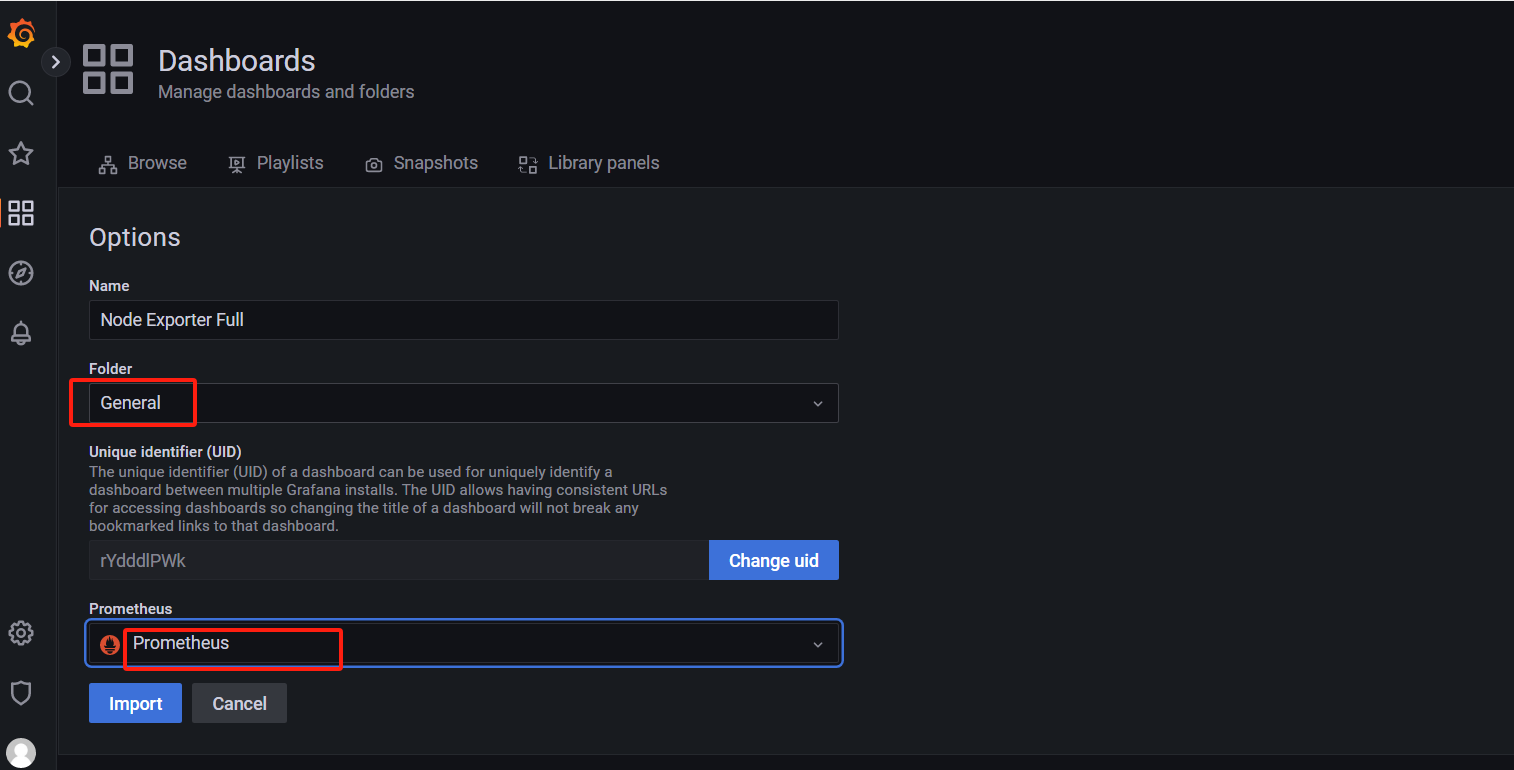
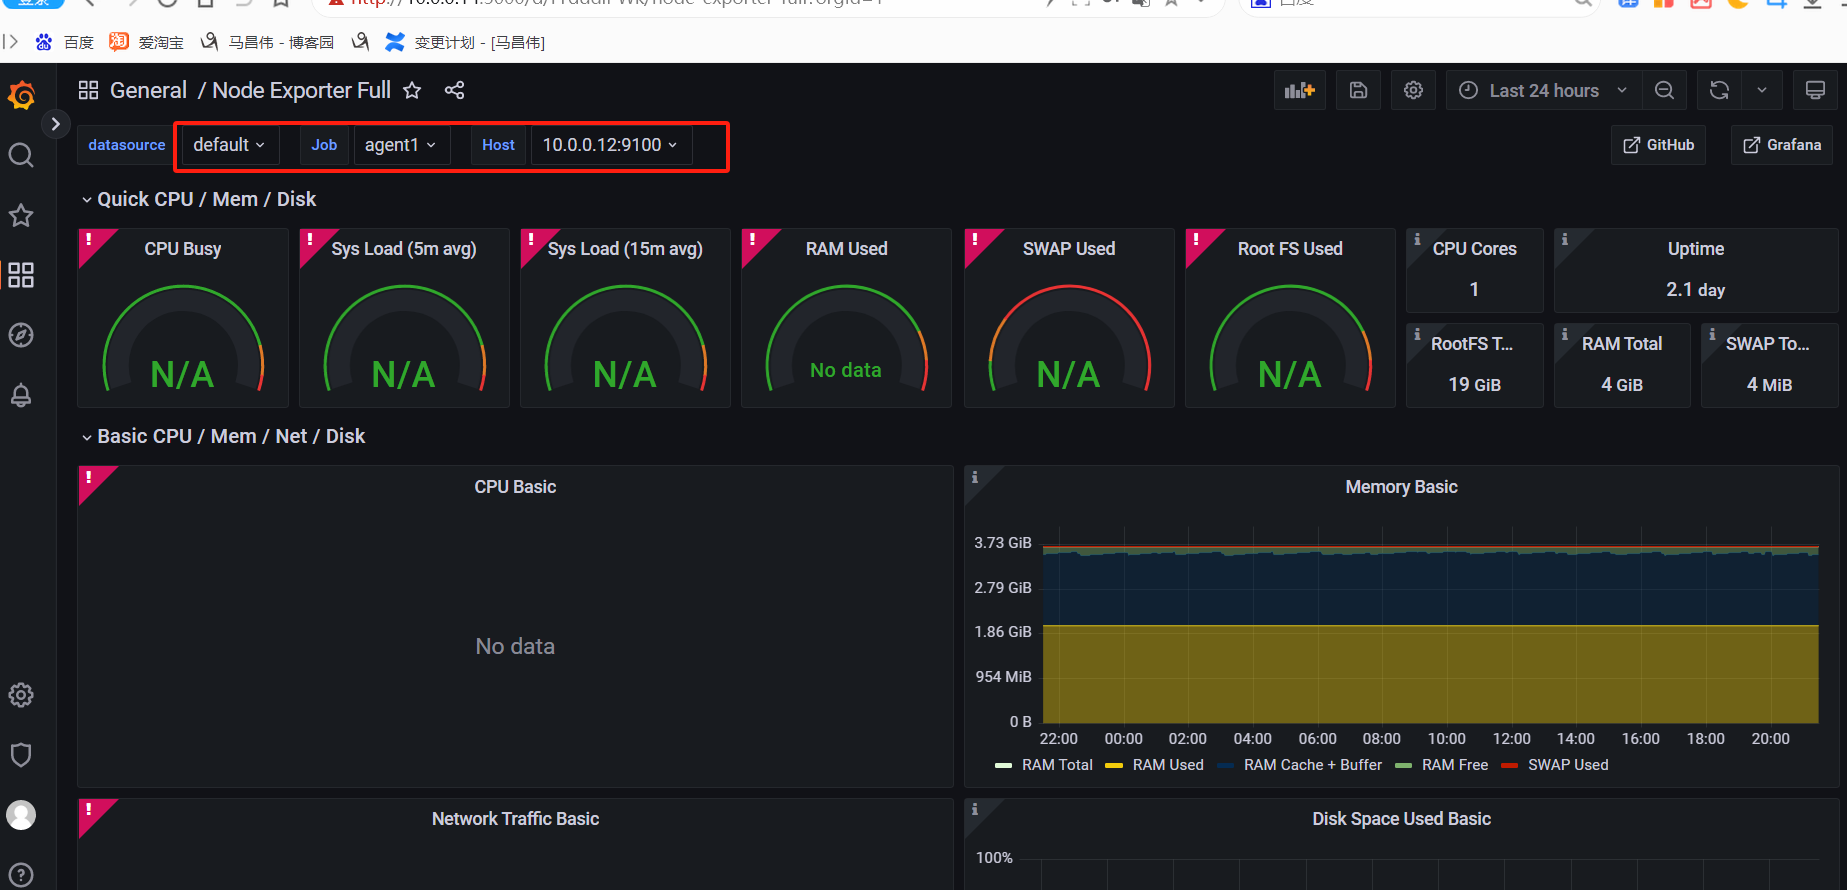
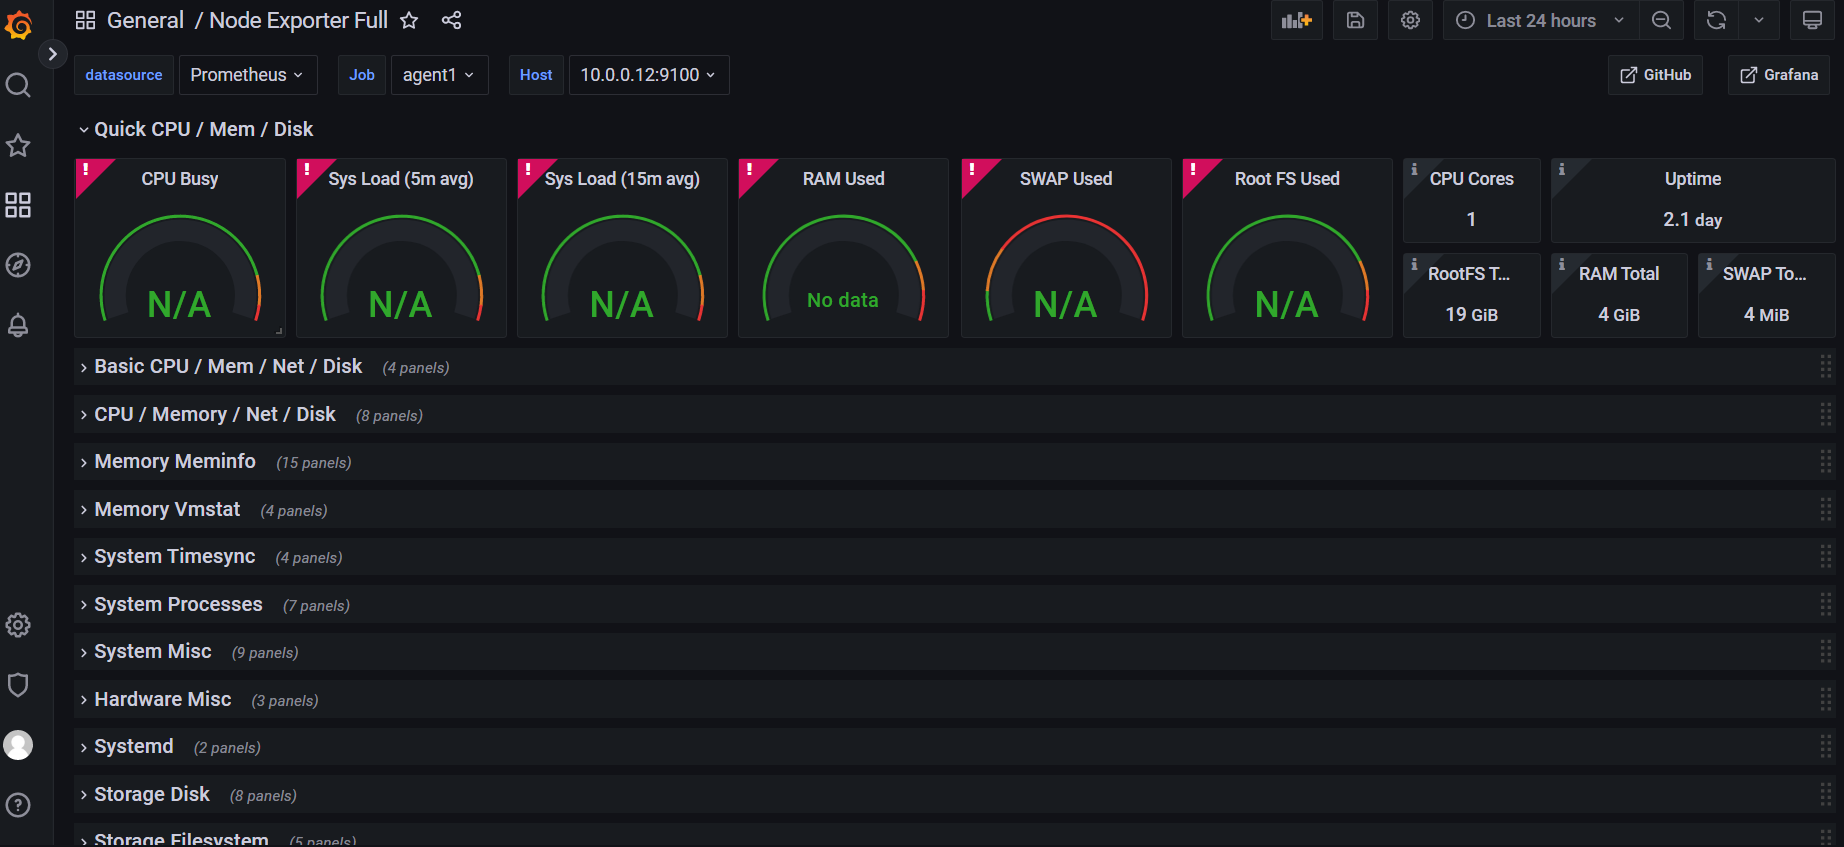
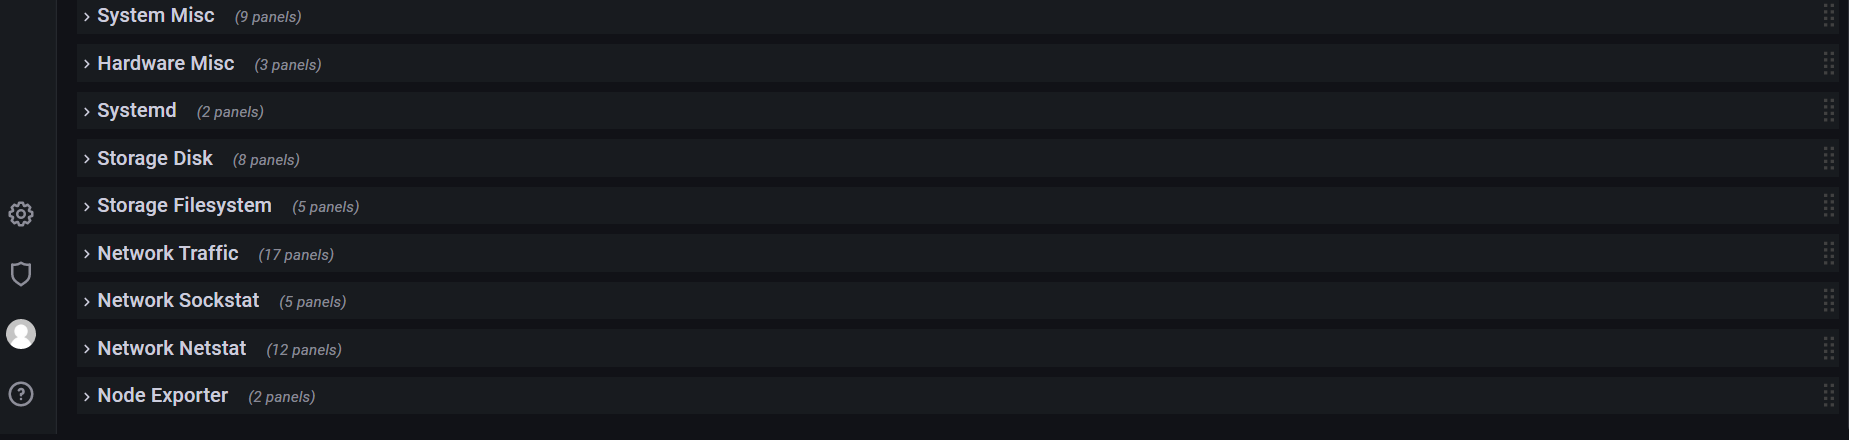
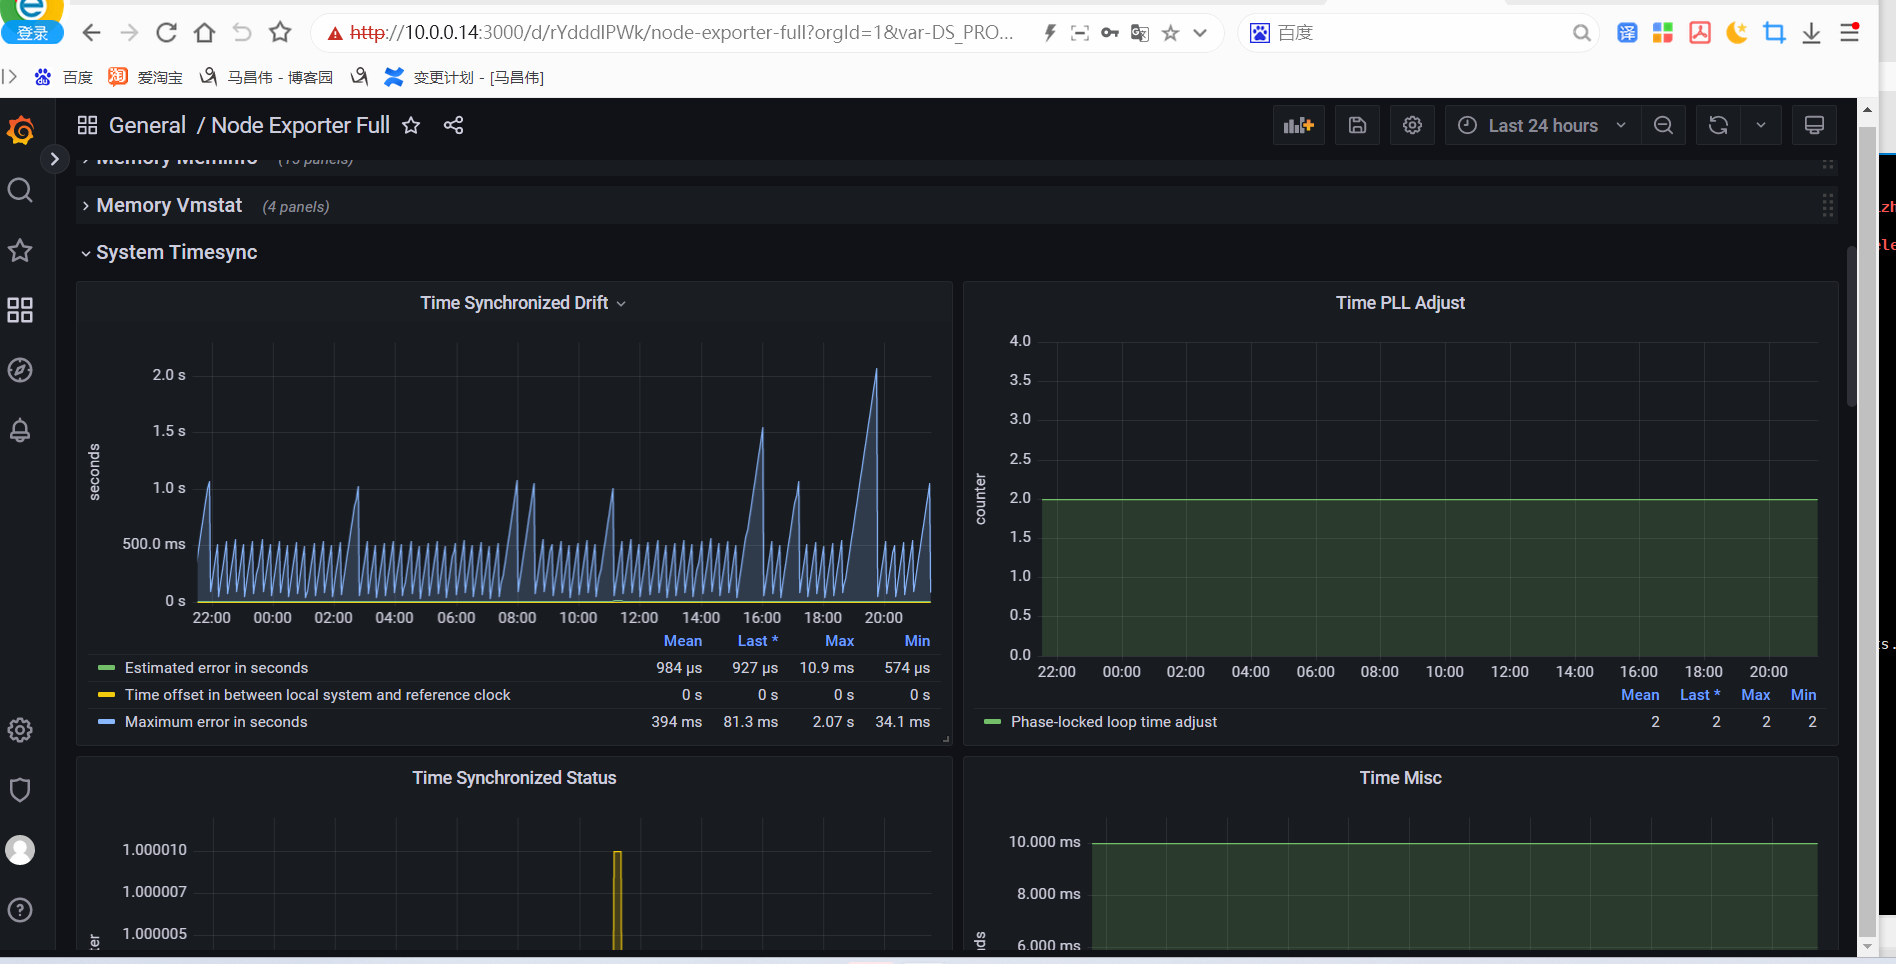
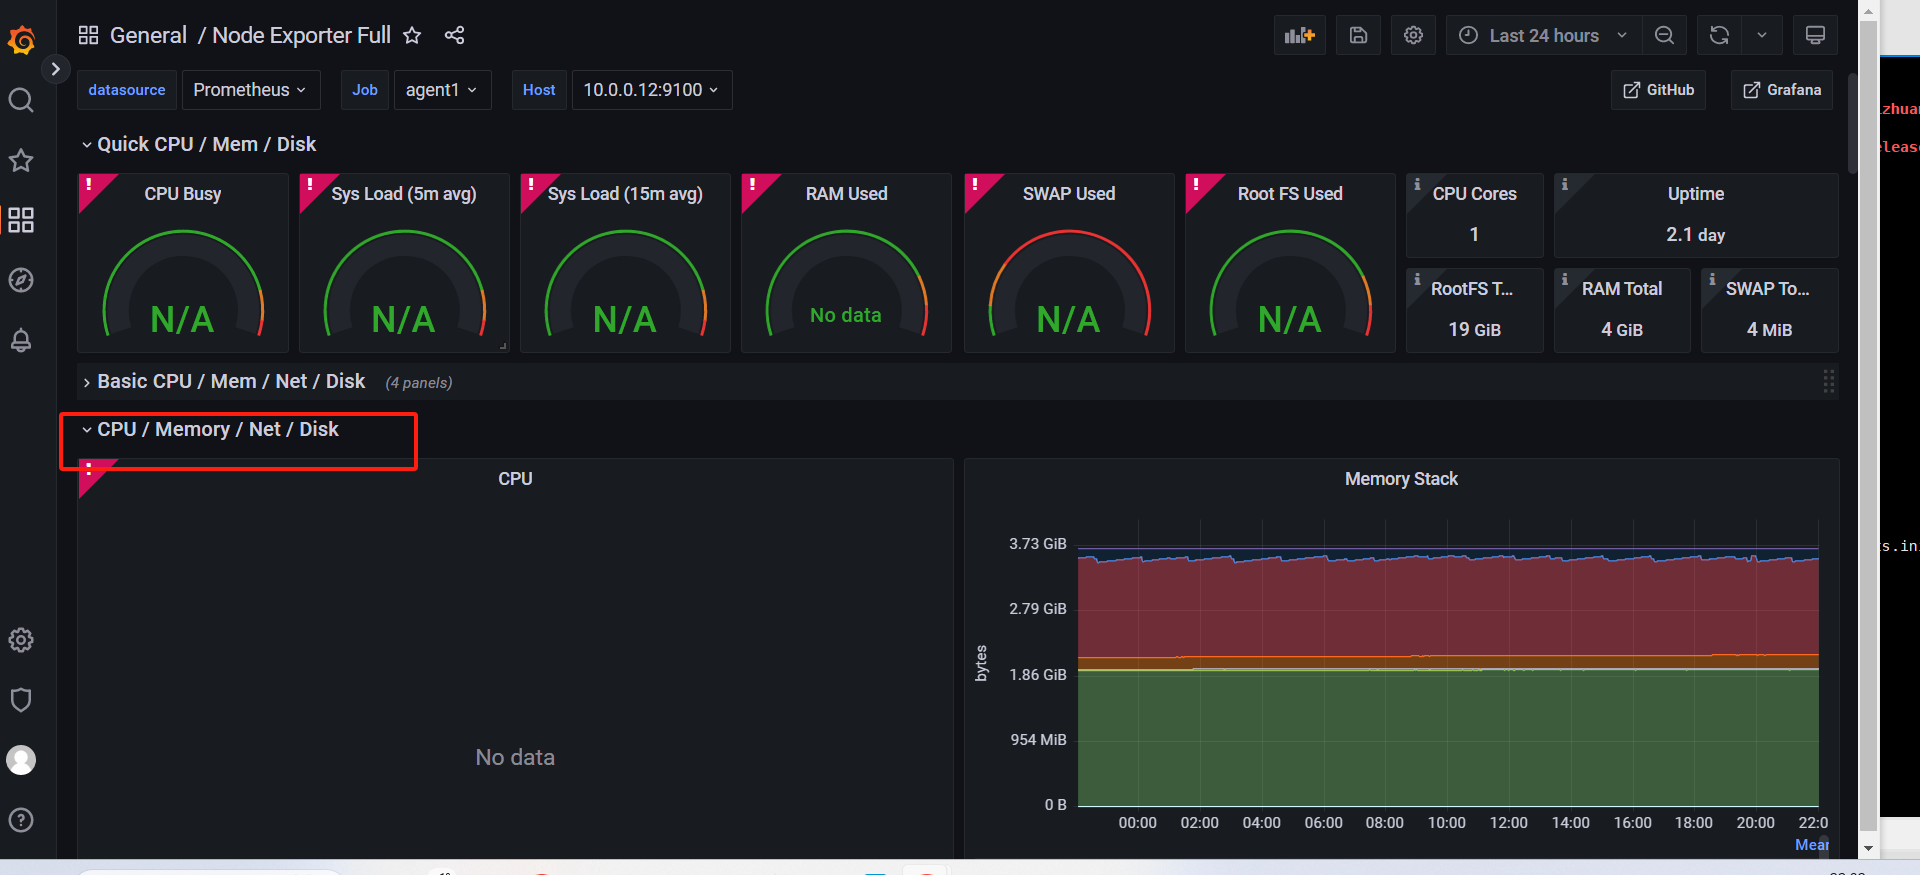
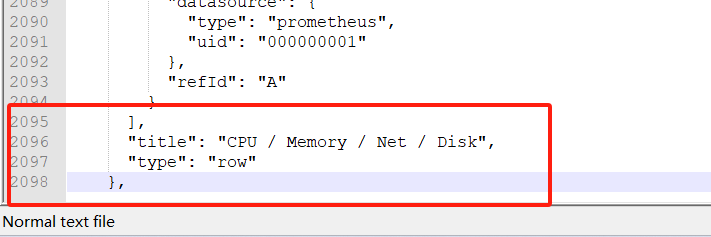

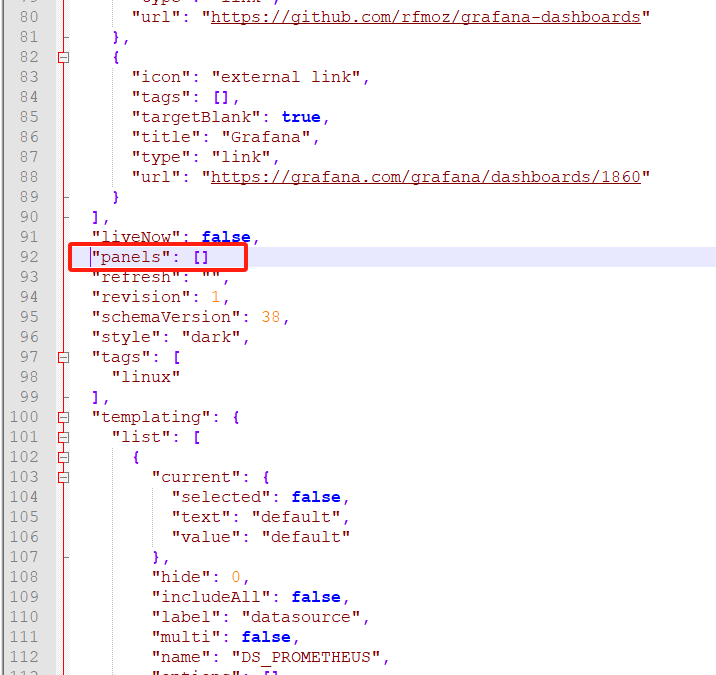
创建目录和使用没有面板的josn

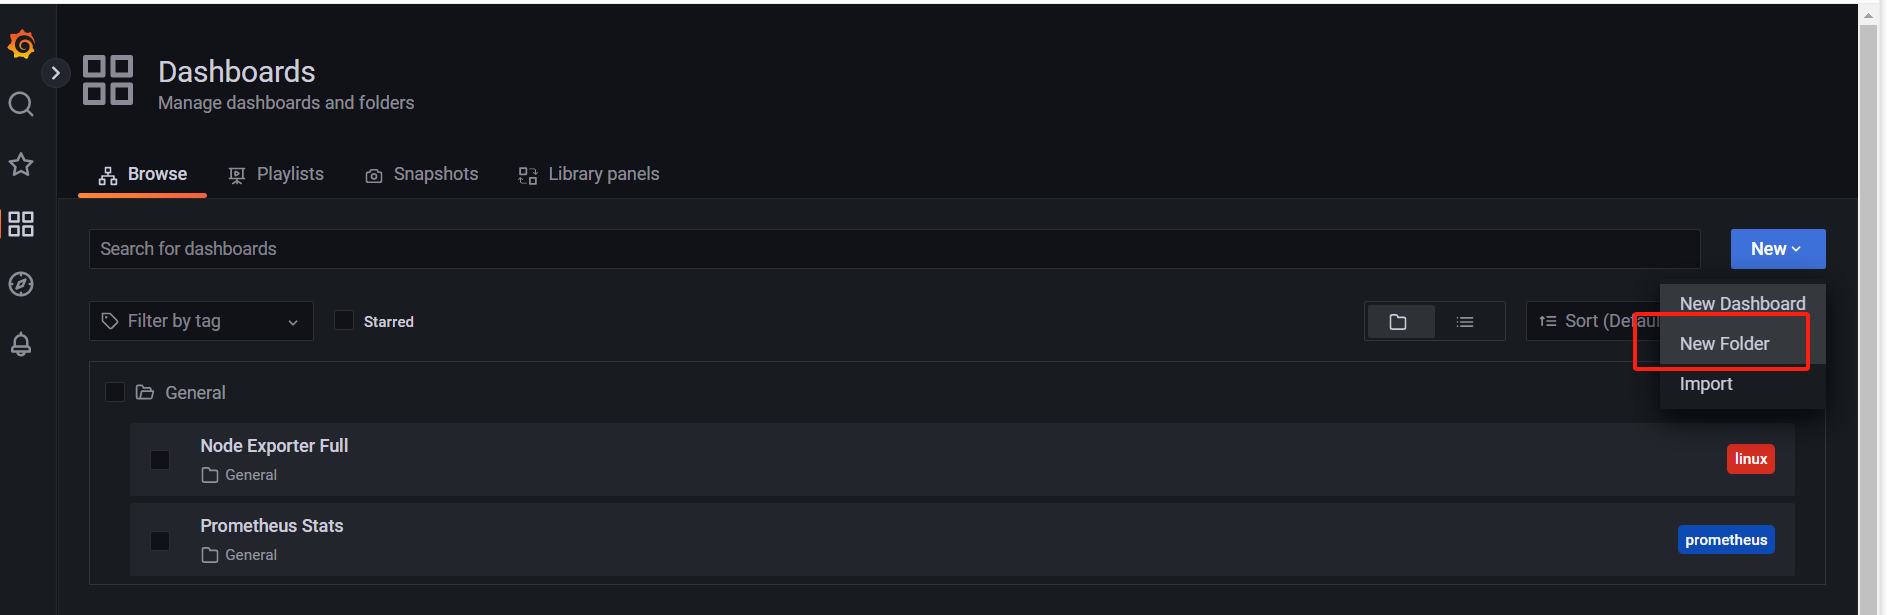
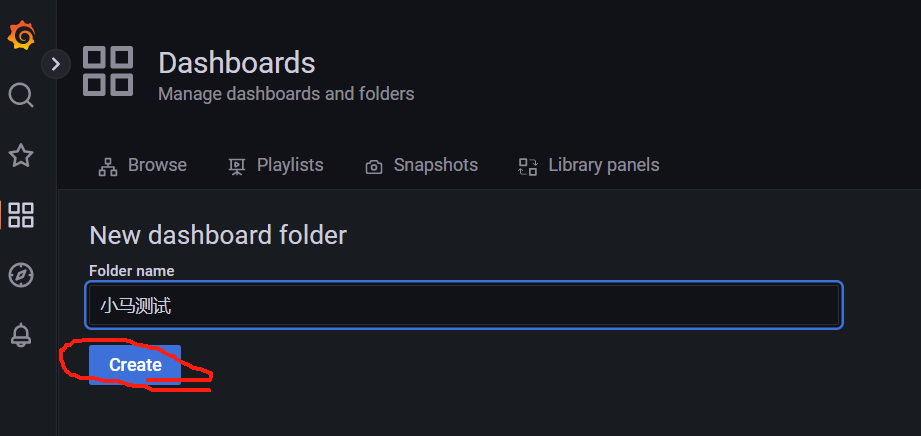
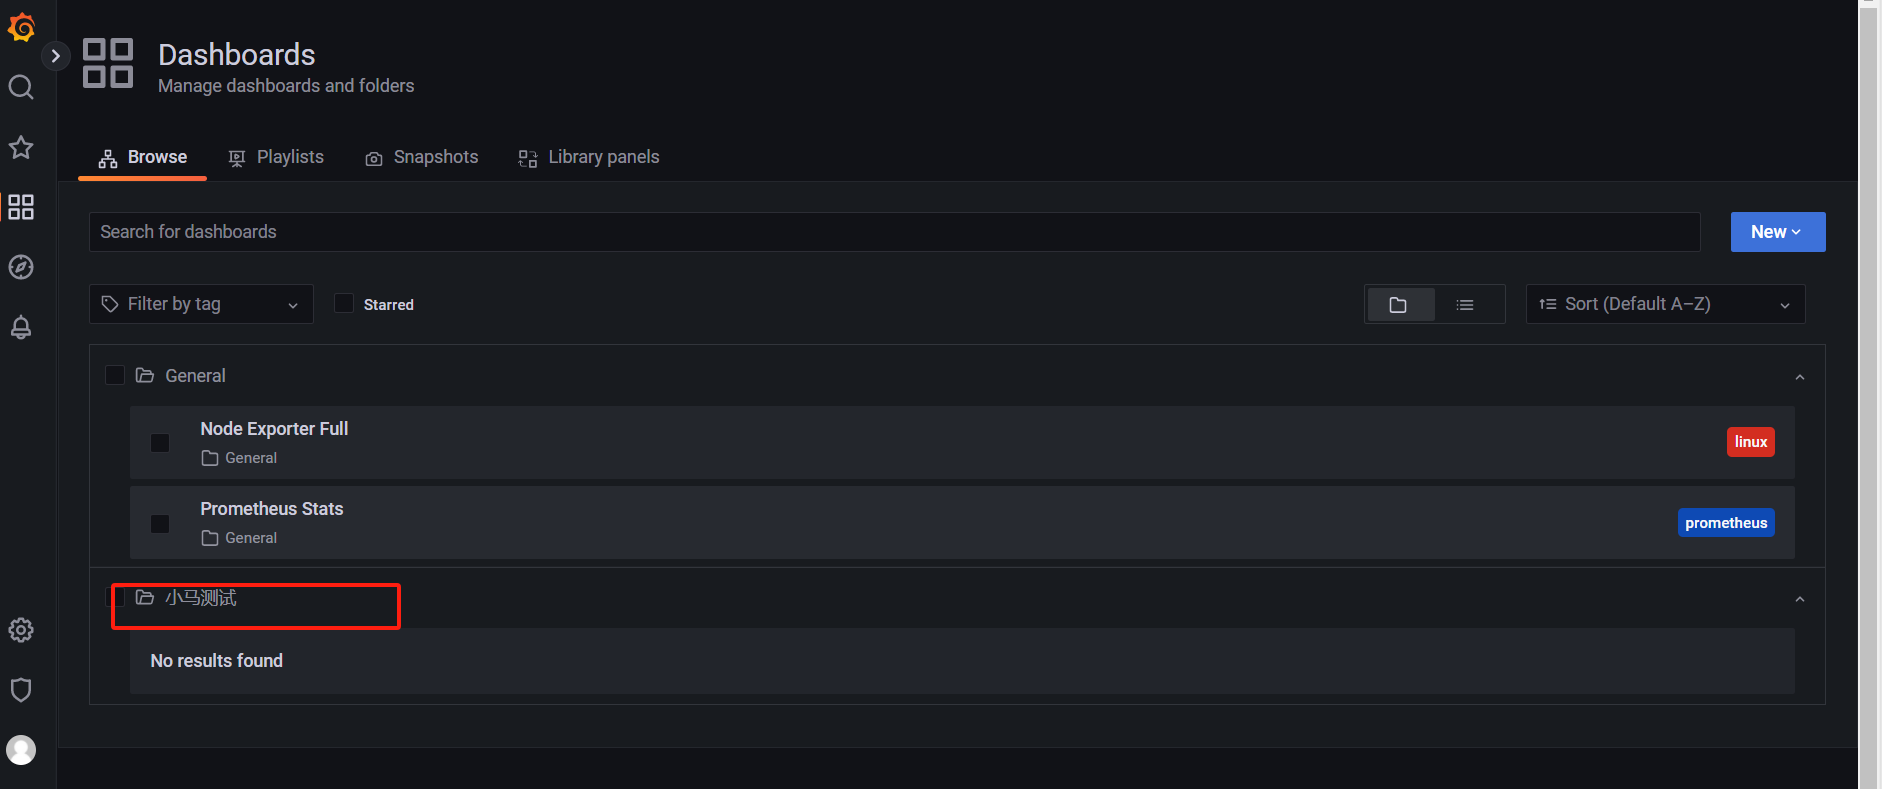
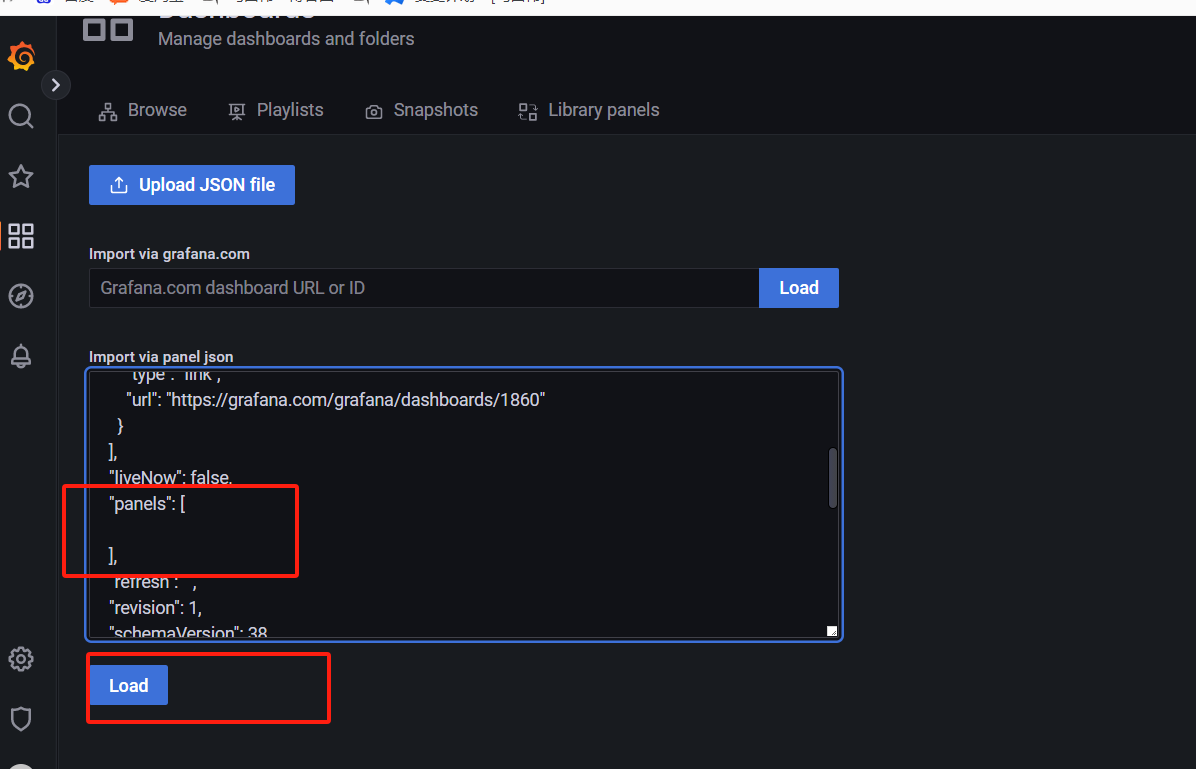
因为模板之前导入过了,那些需要变化的值,需要修改下,如下
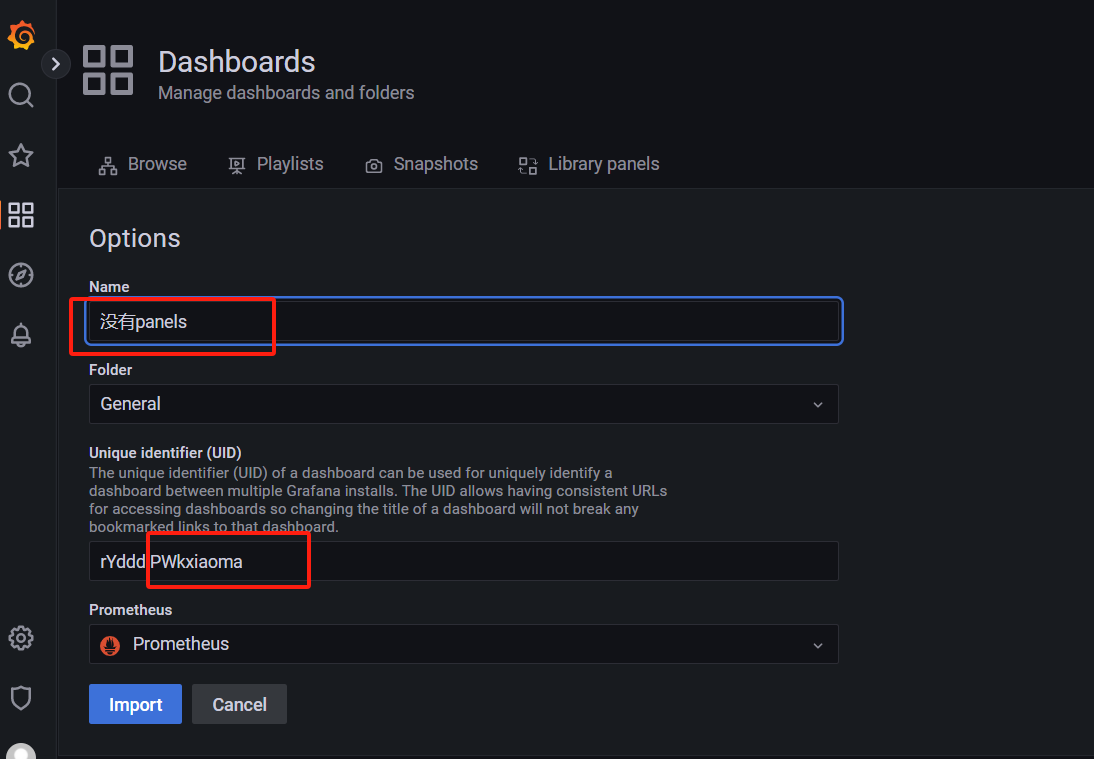
导入之后,可以看到没有面板
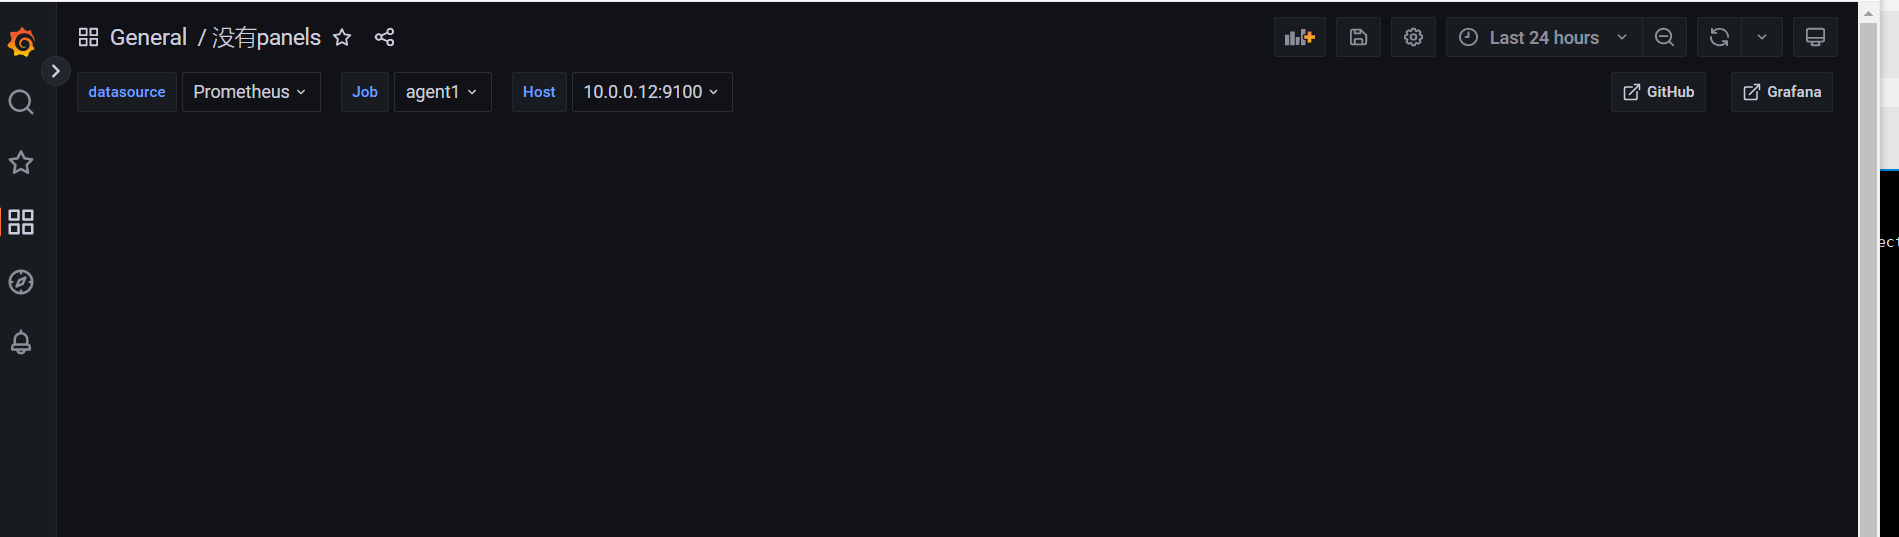
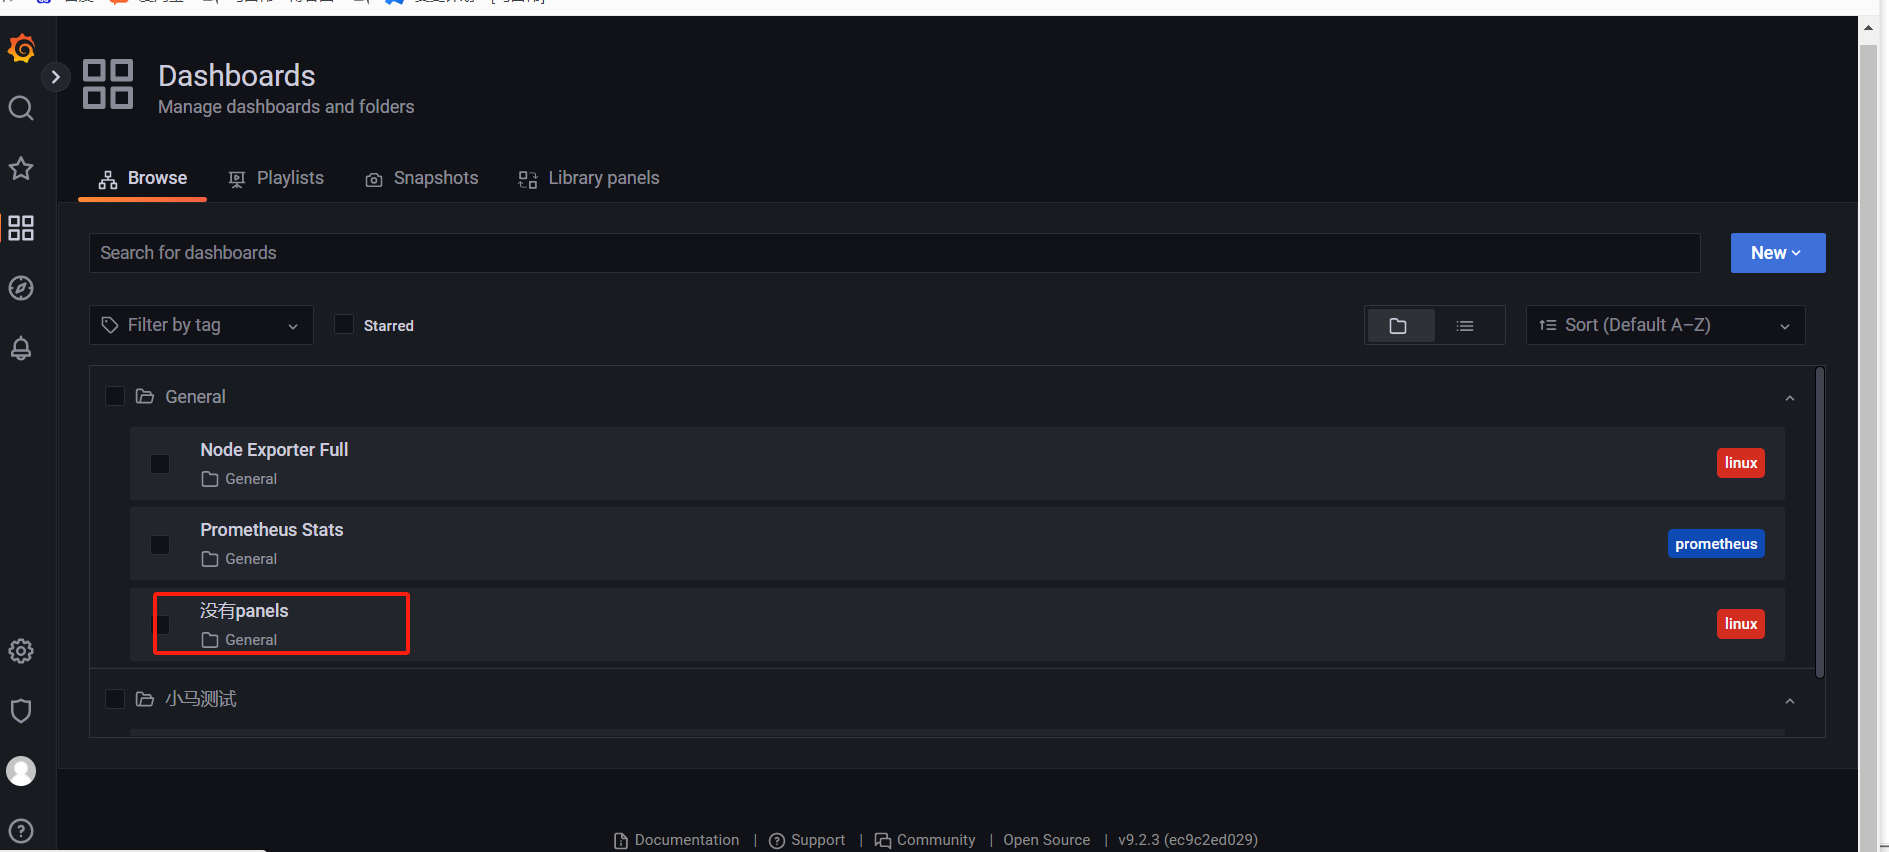
添加之前复制到别处的一部分面板
panels里面加了一个字典
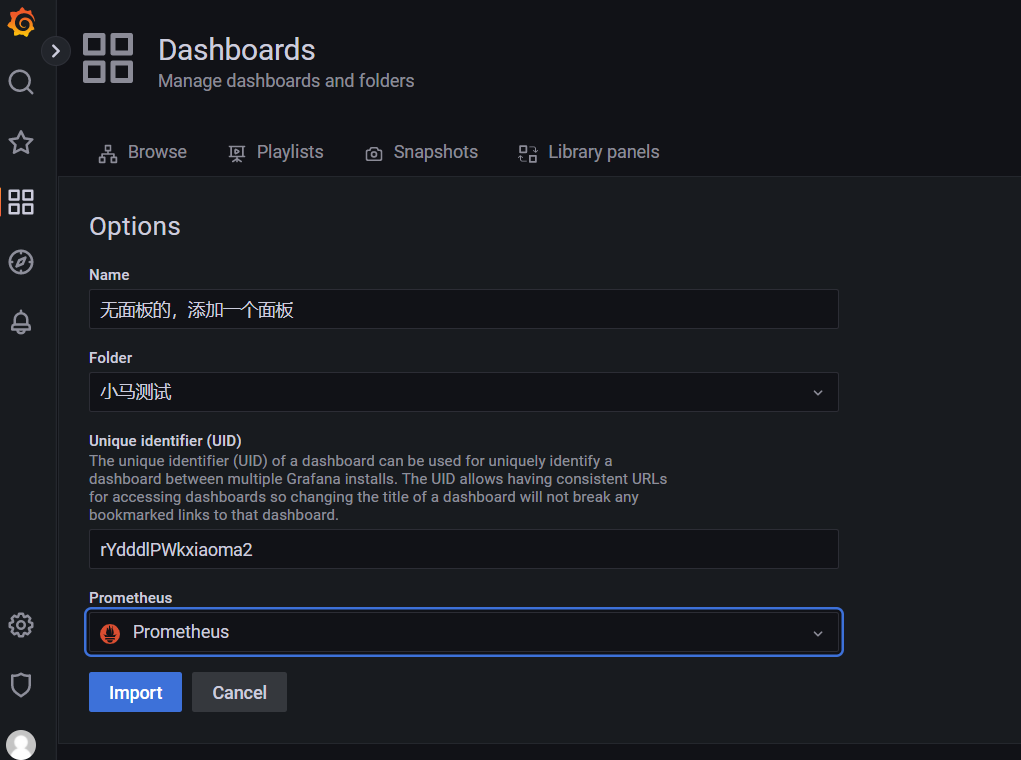
可以看到,正是我们需要的那个数据
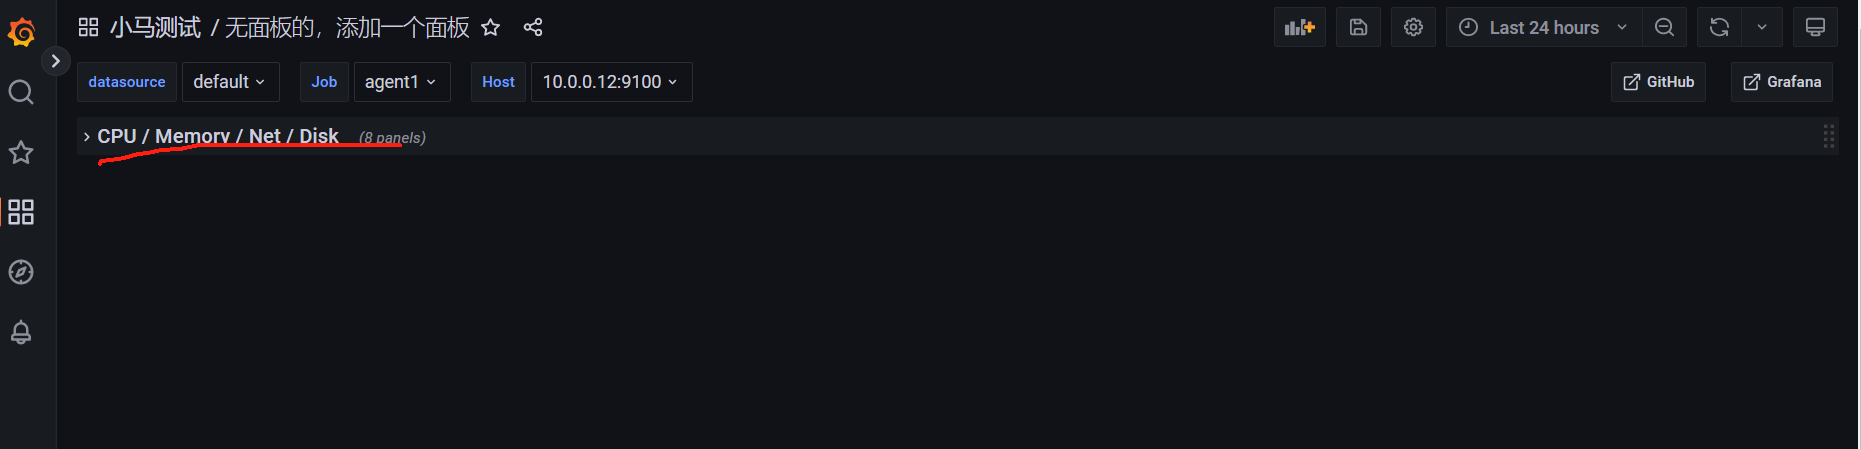
把没有数据的去掉
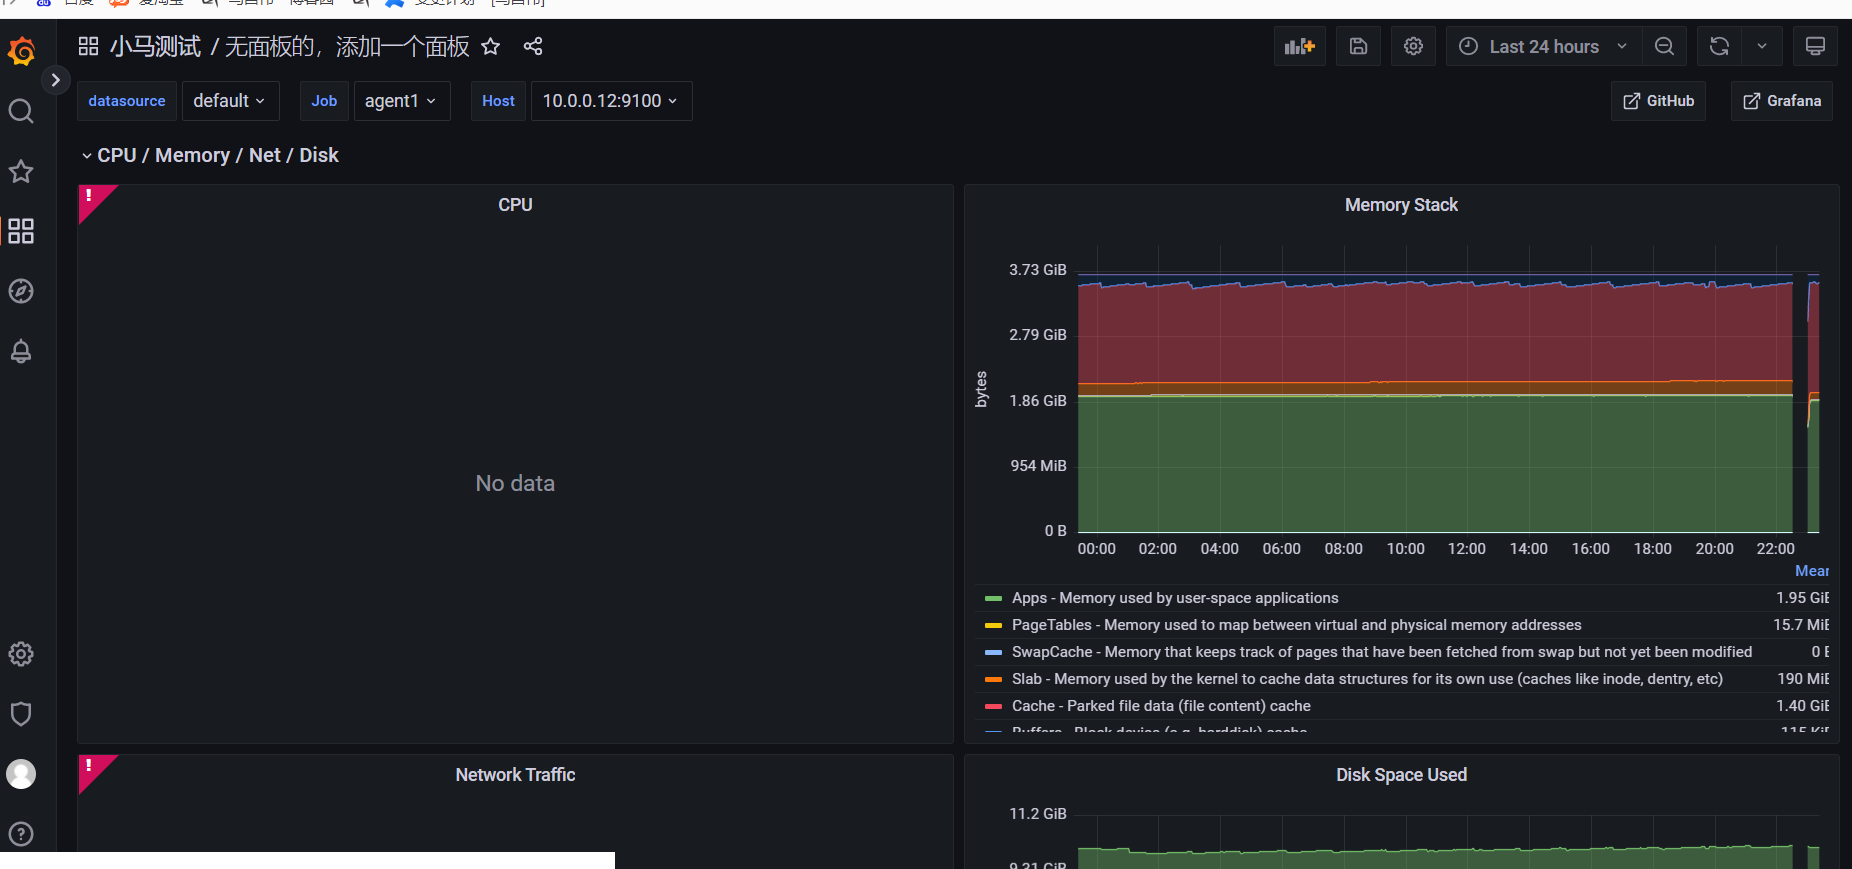
可以看到,里面又有panels。外层的,标题,类型,等参数,决定是在面板中怎么摆放。内层的panels,是真正的一层层图形存放的地方

这是内层panels的标题
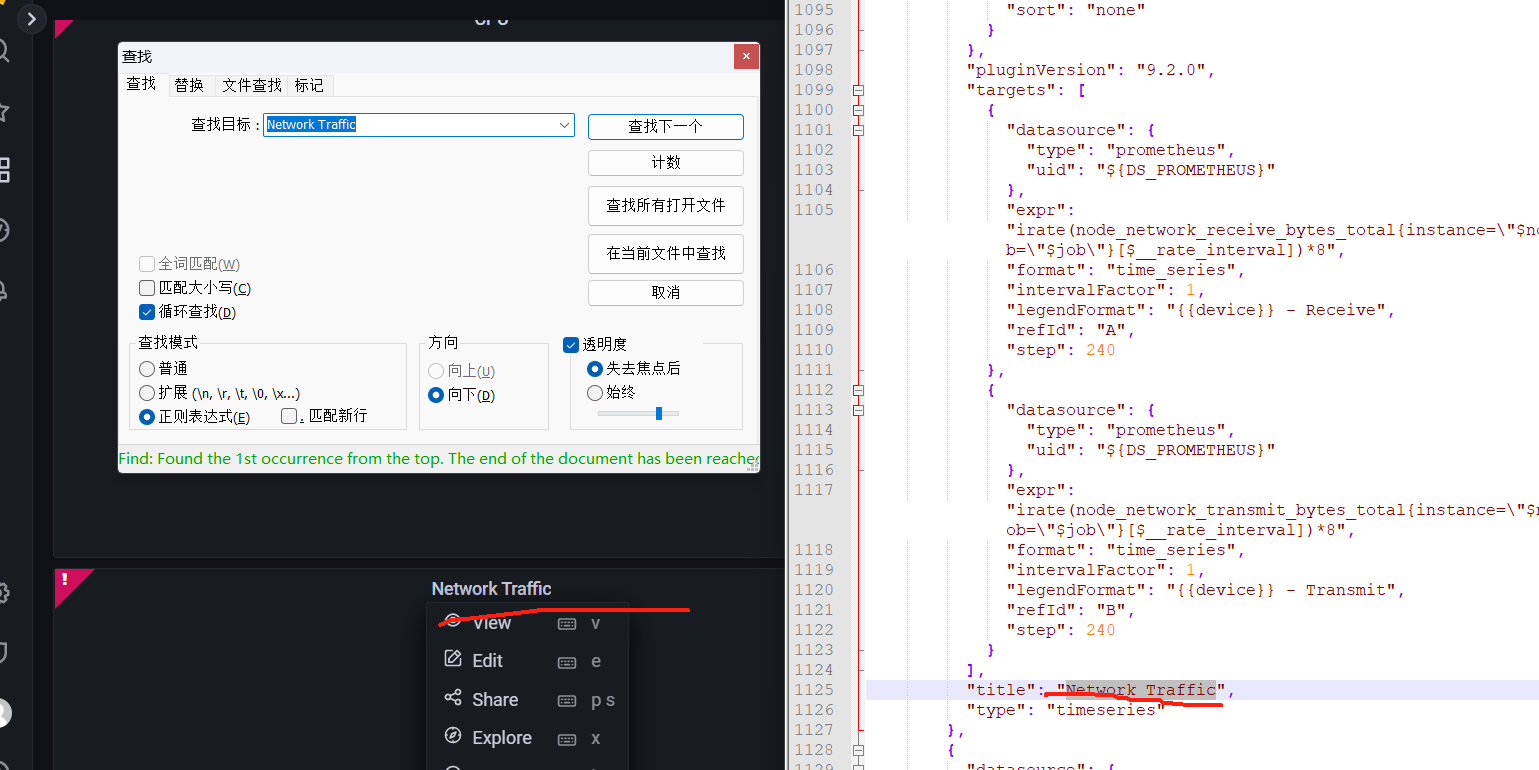
删除一部分没有数据内层面板字典,重新上传
json有问题,在线校验下找到错误
去掉没有数据的之后,还是有点问题
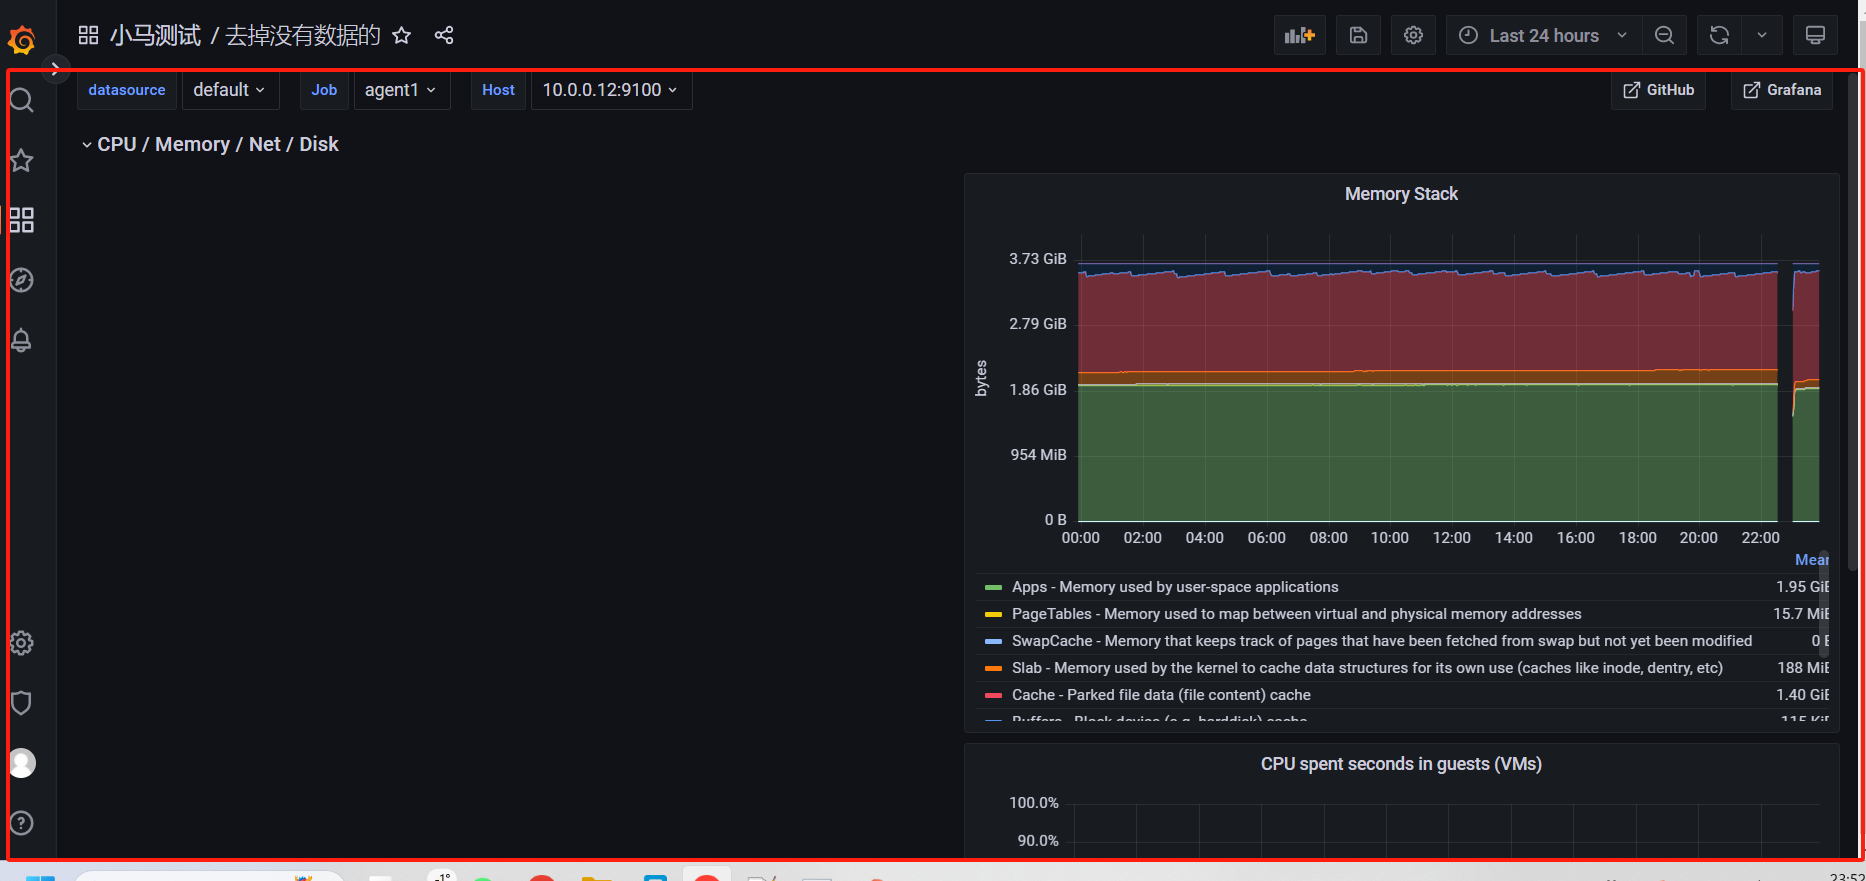
此时很少了,只有1000行
有时间研究下那个是调整长宽,左右的
{ "__inputs": [ { "name": "DS_PROMETHEUS", "label": "Prometheus", "description": "", "type": "datasource", "pluginId": "prometheus", "pluginName": "Prometheus" } ], "__elements": {}, "__requires": [ { "type": "panel", "id": "gauge", "name": "Gauge", "version": "" }, { "type": "grafana", "id": "grafana", "name": "Grafana", "version": "9.4.3" }, { "type": "datasource", "id": "prometheus", "name": "Prometheus", "version": "1.0.0" }, { "type": "panel", "id": "stat", "name": "Stat", "version": "" }, { "type": "panel", "id": "timeseries", "name": "Time series", "version": "" } ], "annotations": { "list": [ { "$$hashKey": "object:1058", "builtIn": 1, "datasource": { "type": "datasource", "uid": "grafana" }, "enable": true, "hide": true, "iconColor": "rgba(0, 211, 255, 1)", "name": "Annotations & Alerts", "target": { "limit": 100, "matchAny": false, "tags": [], "type": "dashboard" }, "type": "dashboard" } ] }, "editable": true, "fiscalYearStartMonth": 0, "gnetId": 1860, "graphTooltip": 1, "id": null, "links": [ { "icon": "external link", "tags": [], "targetBlank": true, "title": "GitHub", "type": "link", "url": "https://github.com/rfmoz/grafana-dashboards" }, { "icon": "external link", "tags": [], "targetBlank": true, "title": "Grafana", "type": "link", "url": "https://grafana.com/grafana/dashboards/1860" } ], "liveNow": false, "panels": [ { "collapsed": true, "datasource": { "type": "prometheus", "uid": "000000001" }, "gridPos": { "h": 1, "w": 24, "x": 12, "y": 20 }, "id": 265, "panels": [ { "datasource": { "type": "prometheus", "uid": "${DS_PROMETHEUS}" }, "description": "", "fieldConfig": { "defaults": { "color": { "mode": "palette-classic" }, "custom": { "axisCenteredZero": false, "axisColorMode": "text", "axisLabel": "bytes", "axisPlacement": "auto", "barAlignment": 0, "drawStyle": "line", "fillOpacity": 40, "gradientMode": "none", "hideFrom": { "legend": false, "tooltip": false, "viz": false }, "lineInterpolation": "linear", "lineWidth": 1, "pointSize": 5, "scaleDistribution": { "type": "linear" }, "showPoints": "never", "spanNulls": false, "stacking": { "group": "A", "mode": "normal" }, "thresholdsStyle": { "mode": "off" } }, "links": [], "mappings": [], "min": 0, "thresholds": { "mode": "absolute", "steps": [ { "color": "green" }, { "color": "red", "value": 80 } ] }, "unit": "bytes" }, "overrides": [ { "matcher": { "id": "byName", "options": "Apps" }, "properties": [ { "id": "color", "value": { "fixedColor": "#629E51", "mode": "fixed" } } ] }, { "matcher": { "id": "byName", "options": "Buffers" }, "properties": [ { "id": "color", "value": { "fixedColor": "#614D93", "mode": "fixed" } } ] }, { "matcher": { "id": "byName", "options": "Cache" }, "properties": [ { "id": "color", "value": { "fixedColor": "#6D1F62", "mode": "fixed" } } ] }, { "matcher": { "id": "byName", "options": "Cached" }, "properties": [ { "id": "color", "value": { "fixedColor": "#511749", "mode": "fixed" } } ] }, { "matcher": { "id": "byName", "options": "Committed" }, "properties": [ { "id": "color", "value": { "fixedColor": "#508642", "mode": "fixed" } } ] }, { "matcher": { "id": "byName", "options": "Free" }, "properties": [ { "id": "color", "value": { "fixedColor": "#0A437C", "mode": "fixed" } } ] }, { "matcher": { "id": "byName", "options": "Hardware Corrupted - Amount of RAM that the kernel identified as corrupted / not working" }, "properties": [ { "id": "color", "value": { "fixedColor": "#CFFAFF", "mode": "fixed" } } ] }, { "matcher": { "id": "byName", "options": "Inactive" }, "properties": [ { "id": "color", "value": { "fixedColor": "#584477", "mode": "fixed" } } ] }, { "matcher": { "id": "byName", "options": "PageTables" }, "properties": [ { "id": "color", "value": { "fixedColor": "#0A50A1", "mode": "fixed" } } ] }, { "matcher": { "id": "byName", "options": "Page_Tables" }, "properties": [ { "id": "color", "value": { "fixedColor": "#0A50A1", "mode": "fixed" } } ] }, { "matcher": { "id": "byName", "options": "RAM_Free" }, "properties": [ { "id": "color", "value": { "fixedColor": "#E0F9D7", "mode": "fixed" } } ] }, { "matcher": { "id": "byName", "options": "Slab" }, "properties": [ { "id": "color", "value": { "fixedColor": "#806EB7", "mode": "fixed" } } ] }, { "matcher": { "id": "byName", "options": "Slab_Cache" }, "properties": [ { "id": "color", "value": { "fixedColor": "#E0752D", "mode": "fixed" } } ] }, { "matcher": { "id": "byName", "options": "Swap" }, "properties": [ { "id": "color", "value": { "fixedColor": "#BF1B00", "mode": "fixed" } } ] }, { "matcher": { "id": "byName", "options": "Swap - Swap memory usage" }, "properties": [ { "id": "color", "value": { "fixedColor": "#BF1B00", "mode": "fixed" } } ] }, { "matcher": { "id": "byName", "options": "Swap_Cache" }, "properties": [ { "id": "color", "value": { "fixedColor": "#C15C17", "mode": "fixed" } } ] }, { "matcher": { "id": "byName", "options": "Swap_Free" }, "properties": [ { "id": "color", "value": { "fixedColor": "#2F575E", "mode": "fixed" } } ] }, { "matcher": { "id": "byName", "options": "Unused" }, "properties": [ { "id": "color", "value": { "fixedColor": "#EAB839", "mode": "fixed" } } ] }, { "matcher": { "id": "byName", "options": "Unused - Free memory unassigned" }, "properties": [ { "id": "color", "value": { "fixedColor": "#052B51", "mode": "fixed" } } ] }, { "matcher": { "id": "byRegexp", "options": "/.*Hardware Corrupted - *./" }, "properties": [ { "id": "custom.stacking", "value": { "group": false, "mode": "normal" } } ] } ] }, "gridPos": { "h": 12, "w": 12, "x": 12, "y": 23 }, "id": 24, "links": [], "options": { "legend": { "calcs": [ "mean", "lastNotNull", "max", "min" ], "displayMode": "table", "placement": "bottom", "showLegend": true, "width": 350 }, "tooltip": { "mode": "multi", "sort": "none" } }, "pluginVersion": "9.2.0", "targets": [ { "datasource": { "type": "prometheus", "uid": "${DS_PROMETHEUS}" }, "expr": "node_memory_MemTotal_bytes{instance=\"$node\",job=\"$job\"} - node_memory_MemFree_bytes{instance=\"$node\",job=\"$job\"} - node_memory_Buffers_bytes{instance=\"$node\",job=\"$job\"} - node_memory_Cached_bytes{instance=\"$node\",job=\"$job\"} - node_memory_Slab_bytes{instance=\"$node\",job=\"$job\"} - node_memory_PageTables_bytes{instance=\"$node\",job=\"$job\"} - node_memory_SwapCached_bytes{instance=\"$node\",job=\"$job\"}", "format": "time_series", "hide": false, "intervalFactor": 1, "legendFormat": "Apps - Memory used by user-space applications", "refId": "A", "step": 240 }, { "datasource": { "type": "prometheus", "uid": "${DS_PROMETHEUS}" }, "expr": "node_memory_PageTables_bytes{instance=\"$node\",job=\"$job\"}", "format": "time_series", "hide": false, "intervalFactor": 1, "legendFormat": "PageTables - Memory used to map between virtual and physical memory addresses", "refId": "B", "step": 240 }, { "datasource": { "type": "prometheus", "uid": "${DS_PROMETHEUS}" }, "expr": "node_memory_SwapCached_bytes{instance=\"$node\",job=\"$job\"}", "format": "time_series", "intervalFactor": 1, "legendFormat": "SwapCache - Memory that keeps track of pages that have been fetched from swap but not yet been modified", "refId": "C", "step": 240 }, { "datasource": { "type": "prometheus", "uid": "${DS_PROMETHEUS}" }, "expr": "node_memory_Slab_bytes{instance=\"$node\",job=\"$job\"}", "format": "time_series", "hide": false, "intervalFactor": 1, "legendFormat": "Slab - Memory used by the kernel to cache data structures for its own use (caches like inode, dentry, etc)", "refId": "D", "step": 240 }, { "datasource": { "type": "prometheus", "uid": "${DS_PROMETHEUS}" }, "expr": "node_memory_Cached_bytes{instance=\"$node\",job=\"$job\"}", "format": "time_series", "hide": false, "intervalFactor": 1, "legendFormat": "Cache - Parked file data (file content) cache", "refId": "E", "step": 240 }, { "datasource": { "type": "prometheus", "uid": "${DS_PROMETHEUS}" }, "expr": "node_memory_Buffers_bytes{instance=\"$node\",job=\"$job\"}", "format": "time_series", "hide": false, "intervalFactor": 1, "legendFormat": "Buffers - Block device (e.g. harddisk) cache", "refId": "F", "step": 240 }, { "datasource": { "type": "prometheus", "uid": "${DS_PROMETHEUS}" }, "expr": "node_memory_MemFree_bytes{instance=\"$node\",job=\"$job\"}", "format": "time_series", "hide": false, "intervalFactor": 1, "legendFormat": "Unused - Free memory unassigned", "refId": "G", "step": 240 }, { "datasource": { "type": "prometheus", "uid": "${DS_PROMETHEUS}" }, "expr": "(node_memory_SwapTotal_bytes{instance=\"$node\",job=\"$job\"} - node_memory_SwapFree_bytes{instance=\"$node\",job=\"$job\"})", "format": "time_series", "hide": false, "intervalFactor": 1, "legendFormat": "Swap - Swap space used", "refId": "H", "step": 240 }, { "datasource": { "type": "prometheus", "uid": "${DS_PROMETHEUS}" }, "expr": "node_memory_HardwareCorrupted_bytes{instance=\"$node\",job=\"$job\"}", "format": "time_series", "hide": false, "intervalFactor": 1, "legendFormat": "Hardware Corrupted - Amount of RAM that the kernel identified as corrupted / not working", "refId": "I", "step": 240 } ], "title": "Memory Stack", "type": "timeseries" }, { "datasource": { "type": "prometheus", "uid": "${DS_PROMETHEUS}" }, "fieldConfig": { "defaults": { "color": { "mode": "palette-classic" }, "custom": { "axisCenteredZero": false, "axisColorMode": "text", "axisLabel": "percentage", "axisPlacement": "auto", "barAlignment": 0, "drawStyle": "bars", "fillOpacity": 70, "gradientMode": "none", "hideFrom": { "legend": false, "tooltip": false, "viz": false }, "lineInterpolation": "smooth", "lineWidth": 2, "pointSize": 3, "scaleDistribution": { "type": "linear" }, "showPoints": "never", "spanNulls": false, "stacking": { "group": "A", "mode": "none" }, "thresholdsStyle": { "mode": "off" } }, "mappings": [], "max": 1, "thresholds": { "mode": "absolute", "steps": [ { "color": "green" }, { "color": "red", "value": 80 } ] }, "unit": "percentunit" }, "overrides": [ { "matcher": { "id": "byRegexp", "options": "/^Guest - /" }, "properties": [ { "id": "color", "value": { "fixedColor": "#5195ce", "mode": "fixed" } } ] }, { "matcher": { "id": "byRegexp", "options": "/^GuestNice - /" }, "properties": [ { "id": "color", "value": { "fixedColor": "#c15c17", "mode": "fixed" } } ] } ] }, "gridPos": { "h": 12, "w": 12, "x": 12, "y": 59 }, "id": 319, "options": { "legend": { "calcs": [ "mean", "lastNotNull", "max", "min" ], "displayMode": "table", "placement": "bottom", "showLegend": true }, "tooltip": { "mode": "multi", "sort": "desc" } }, "targets": [ { "datasource": { "type": "prometheus", "uid": "${DS_PROMETHEUS}" }, "editorMode": "code", "expr": "sum by(instance) (irate(node_cpu_guest_seconds_total{instance=\"$node\",job=\"$job\", mode=\"user\"}[1m])) / on(instance) group_left sum by (instance)((irate(node_cpu_seconds_total{instance=\"$node\",job=\"$job\"}[1m])))", "hide": false, "legendFormat": "Guest - Time spent running a virtual CPU for a guest operating system", "range": true, "refId": "A" }, { "datasource": { "type": "prometheus", "uid": "${DS_PROMETHEUS}" }, "editorMode": "code", "expr": "sum by(instance) (irate(node_cpu_guest_seconds_total{instance=\"$node\",job=\"$job\", mode=\"nice\"}[1m])) / on(instance) group_left sum by (instance)((irate(node_cpu_seconds_total{instance=\"$node\",job=\"$job\"}[1m])))", "hide": false, "legendFormat": "GuestNice - Time spent running a niced guest (virtual CPU for guest operating system)", "range": true, "refId": "B" } ], "title": "CPU spent seconds in guests (VMs)", "type": "timeseries" } ], "targets": [ { "datasource": { "type": "prometheus", "uid": "000000001" }, "refId": "A" } ], "title": "CPU / Memory / Net / Disk", "type": "row" } ], "refresh": "", "revision": 1, "schemaVersion": 38, "style": "dark", "tags": [ "linux" ], "templating": { "list": [ { "current": { "selected": false, "text": "default", "value": "default" }, "hide": 0, "includeAll": false, "label": "datasource", "multi": false, "name": "DS_PROMETHEUS", "options": [], "query": "prometheus", "refresh": 1, "regex": "", "skipUrlSync": false, "type": "datasource" }, { "current": {}, "datasource": { "type": "prometheus", "uid": "${DS_PROMETHEUS}" }, "definition": "", "hide": 0, "includeAll": false, "label": "Job", "multi": false, "name": "job", "options": [], "query": { "query": "label_values(node_uname_info, job)", "refId": "Prometheus-job-Variable-Query" }, "refresh": 1, "regex": "", "skipUrlSync": false, "sort": 1, "tagValuesQuery": "", "tagsQuery": "", "type": "query", "useTags": false }, { "current": {}, "datasource": { "type": "prometheus", "uid": "${DS_PROMETHEUS}" }, "definition": "label_values(node_uname_info{job=\"$job\"}, instance)", "hide": 0, "includeAll": false, "label": "Host", "multi": false, "name": "node", "options": [], "query": { "query": "label_values(node_uname_info{job=\"$job\"}, instance)", "refId": "Prometheus-node-Variable-Query" }, "refresh": 1, "regex": "", "skipUrlSync": false, "sort": 1, "tagValuesQuery": "", "tagsQuery": "", "type": "query", "useTags": false }, { "current": { "selected": false, "text": "[a-z]+|nvme[0-9]+n[0-9]+|mmcblk[0-9]+", "value": "[a-z]+|nvme[0-9]+n[0-9]+|mmcblk[0-9]+" }, "hide": 2, "includeAll": false, "multi": false, "name": "diskdevices", "options": [ { "selected": true, "text": "[a-z]+|nvme[0-9]+n[0-9]+|mmcblk[0-9]+", "value": "[a-z]+|nvme[0-9]+n[0-9]+|mmcblk[0-9]+" } ], "query": "[a-z]+|nvme[0-9]+n[0-9]+|mmcblk[0-9]+", "skipUrlSync": false, "type": "custom" } ] }, "time": { "from": "now-24h", "to": "now" }, "timepicker": { "refresh_intervals": [ "5s", "10s", "30s", "1m", "5m", "15m", "30m", "1h", "2h", "1d" ], "time_options": [ "5m", "15m", "1h", "6h", "12h", "24h", "2d", "7d", "30d" ] }, "timezone": "browser", "title": "Node Exporter Full", "uid": "rYdddlPWk", "version": 87, "weekStart": "" }

 浙公网安备 33010602011771号