
[转帖]Google Maps API for Flash and ArcGIS Server REST API Integration
慢慢翻译慢慢看。
Google Maps API for Flash and ArcGIS Server REST API Integration - Part 1
五月 12, 2009 14:14
Overview
This is the first post in a series where I will discuss techniques for interacting with the ArcGIS Server REST API from within a Flex 3 application built with the Google Maps API for Flash.
With this post, we start with a simple example that demonstrates how to stream features from ArcGIS Server and overlay them on top of Google Maps data. In this case, we will be working with parcel data.
This first example serves to demonstrate the basic concepts as succinctly as possible. In future posts, I will gradually refactor and improve upon the code to create reusable components.
Background
You may be asking yourself “ESRI has a Flex API, why aren’t we using that?” Yes, ESRI does have an excellent Flex API - but it lacks the ability to show Google Maps data or use the Google Geocode API.
This is probably more of a Google licensing issue than anything else. But as of today, if you want to display your own ArcGIS Server content on top of Google Maps data in a Flex/Flash project, you can’t use the ESRI Flex API to do it without violating the Google Maps Terms of Service.
If Google were to open up its TOS to allow direct access to the map tiles (as many have called for) that would solve part of the problem. But you would still have the issue of being restricted in what you can do with the results of a call to the Geocode API. My understanding is that you are only allowed to display the result(s) on a Google Map, not in any other mapping system.
In my experience, the Google Maps data and Geocode functions are superior to the ArcGIS Online equivalents that are accessible from the ESRI Flex API. If you want to take advantage of Google’s map content and Geocode functionality, it’s worth the effort to integrate the ArcGIS Server REST API with the Google Maps API for Flash .
Don’t take this to mean I don’t like ESRI’s Flex API – it has many strengths which I’ll cover in future posts. In the meantime, if you’re going that route, check out Thunderhead Explorer - an excellent blog by ESRI’s Mansour Raad featuring “Tips and Tricks with ArcGIS Flex Mapping API”.
Sample Application Concepts
Our simple sample application works as follows:
- The Google Maps API for Flash is embedded in a Flex 3 application.
- The parcels are served via an ArcGIS Server Map Service, accessible via ArcGIS Server’s REST API.
- The parcels are displayed at zoom levels 17 - 19.
- The parcels are fetched via an HTTPService each time the map extent changes.
- The parcels are returned in JSON format.
- The JSON response is decoded using the open source JSON decoder in as3corelib.
- Each parcel’s geometry is converted to a Polygon Overlay and added to the map.
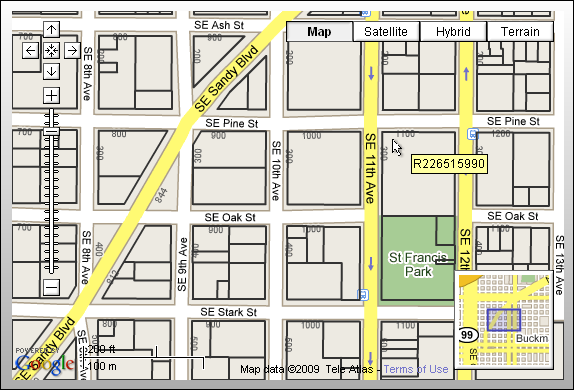
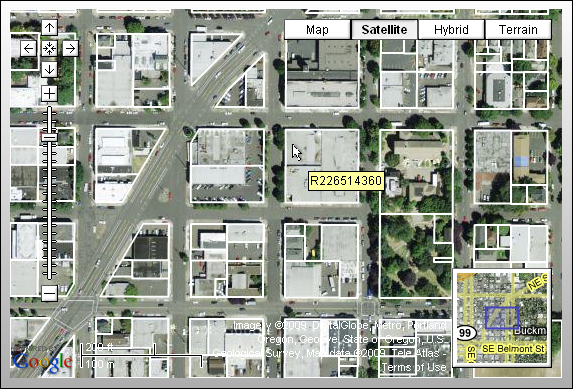
- Parcels are drawn with dark grey lines when the normal map is selected and white lines when the Satellite or Hybrid map is selected.
- When the user hovers the mouse over a parcel, it’s parcel number is displayed in a tooltip.
Here are a couple of screenshots:
Live example is here, and source code is here.
Discussion
Starting with a basic Flex Application, we have a single map with a specified “map ready” event:
Next, we declare a few member variables at the top of the script block:
With the parcelsUrl variable, we are specifying an endpoint to an ArcGIS Server REST API query function on a Layer in a MapService. See the ESRI ArcGIS Server REST API Reference for more information on the specific URL format for calling this operation.
For this example, we have chosen an ESRI sample server that has a parcels layer available for Portland, Oregon. We can explore this MapService and other sample services using the interactive SDK located at the following URL: http://sampleserver1.arcgisonline.com/arcgis/rest/services
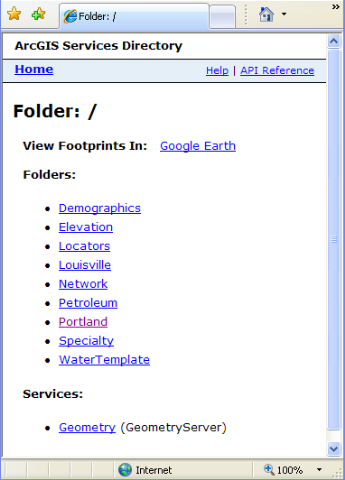
By drilling down into the Portland Folder and MapServices, we can learn about the functionality and data layers that are available for consumption. If we drill down to the layer in question, we can see a few interesting things about it, including the field names and aliases.
We also see that the layer has a spatial reference well known id (wkid) of 102113 – also known as Web Mercator. This is great if you need to overlay the layer as map tiles on Google Maps, because Google’s map tiles are also in Web Mercator. However, streamed geometries with coordinates in the Web Mercator spatial reference will not overlay properly on top of Google Maps. They must be in WGS 84 (Lat/Lon).
Therefore, we have a wgs84wkid variable which holds the well known id for WGS 84. As you will see, the ArcGIS Server REST API allows us to specify input and output spatial references that are different from the spatial reference of the MapService – and it will perform the coordinate conversions on fly.
The map_mapReady function is filled in next:


 alpha:
In the map_mapReady function, we setup a transparent fill style and stroke styles for the dark grey and white lines. We also initialize the map controls and add an event listener for the map’s “move end” event. This event is where we will call the ArcGIS Server REST API to get the parcels for the current map extent. Finally, we center the map and zoom in on an area of Portland so that we’ll have something to look at when the application starts.
The map’s “move end” event is where we send an http request to ArcGIS Server to get the parcels:
First, we get the current zoom level. If the level is less than 17, we clear all overlays and exit. This is a shortcut to keep the example simple. If we were drawing any other overlays besides parcels, this would obviously be a problem. We’ll look at a better way to handle clearing the parcels in a future post.
Next, we get the LatLngBounds of the map and convert it into a string representation of an ESRI envelope that can be passed to the ArcGIS Server REST API.
Before making a new request through the HTTPService, we cancel it in case a prior request was sent that hasn’t come back yet.
Next we assign the URL endpoint to the HTTP Service and set up the event listeners.
In Flex 3 (like in Javascript), you can create an anonymous object and add properties to it “on the fly”. Here we create a new Object named params and add all of the parameters we want to pass as arguments in the URL query string. See the ESRI ArcGIS Server REST API Reference for more information on what parameters are available when calling the query operation on a layer.
Once the params Object is constructed, it is passed to the send method on the parcelsService (HTTPService). The HTTPService converts each property into a query string argument before sending the request to the REST API for the MapService.
The “on parcel result” event will be fired by the HTTPService when a response is received.
The ResultEvent’s result property contains the JSON string returned from the server. We use the ascorelib JSON serializer to decode the returned string into an Object. From there, we can access the properties of the result object defined for the ArcGIS Server response.
The JSON Response Syntax is defined as follows:
In this case, since we are requesting polygons, the JSON Response Syntax for the geometries is defined as follows:
 {
{2
 "rings" : [
 3
[ [<x11>, <y11>], [<x12>, <y12>],  , [<x11>, <y11>] ],
 4
[ [<x21>, <y21>], [<x22>, <y22>], , [<x21>, <y21>] ]5
],6
 "spatialReference" : {<spatialReference>}
7
 }
} 8

9
Once we get the features array from the Object we iterate each feature, get its attributes and geometry, construct a Google Maps Polygon Overlay, and add it to the map.
When constructing the Polygon, a PolygonOptions object is created to define its look and behavior. We use this object to define the symbology, choosing dark grey lines if the map type is Normal, and white lines if the map type is one of the others such as Satellite or Hybrid. The PolygonOptions object is also used to define the tool tip that will be displayed when the user hovers the mouse over the Polygon.
Note that if the ESRI polygon has multiple rings, we simply create a separate Google Polygon for each ring. This is necessary because the Google Polygon constructor can only take one array of points and does not handle multiple rings.
There is a way to create multi-ringed Google Polygons using the Polygon.fromEncoded() static method, but this turns out to be problematic due to the rounding errors introduced by the encoding algorithm.
Default 500 Feature Limit
ArcGIS Server MapServices have a default limit of 500 features that can be returned from a layer query request. If you Pan/Zoom around the live example application, you might notice missing parcels if you are in a dense area and the limit is reached. The limit can be changed by modifying the MaxRecordCount in the MapService’s configuration file on the server. But since we’re using an ESRI sample server, I can’t very well make that change.
Wrap Up
This simple application has served to demonstrate the basics of communicating with the ArcGIS Server REST API and overlaying the results on a Google Map built with the Google Maps API for Flash.
Stay tuned for future posts, where we will refactor and improve upon the code to create reusable components.
Live example is here, and source code is here.
Resources
Downloads
Documentation and Sample Servers
- Google Maps API for Flash Reference
- ESRI ArcGIS Server REST API Reference
- ESRI ArcGIS Server Live Sample Servers
Blogs and Forums
Google Maps API for Flash and ArcGIS Server REST API Integration - Part 1
六月 15, 2009 13:11
Overview
This is the second post in a series where I discuss techniques for interacting with the ArcGIS Server REST API from within a Flex 3 application built with the Google Maps API for Flash. If you haven’t read the first post yet, I encourage you to do so now.
The first post presented a simple example that demonstrated how to stream features from ArcGIS Server and overlay them on top of Google Maps data. In this second post, we will reorganize the code for better reusability and add some geocoding functionality.
I’ll keep this post pretty brief and only cover the major points. Feel free to check out the live example and dive into the source code!
Reorganizing the Code
In the previous post all code was presented in-line in a single mxml file. While this helped illustrate the concepts simply and succinctly, the code was not really reusable other than by the old copy/paste method. In this updated example, all of the feature streaming and drawing code has been placed in its own PolygonOverlay class.
This new class has a number of advantages over the old one. Many of the hard coded values, such as minimum and maximum zoom levels, the tool tip field and symbolization options are now encapsulated in the class definition.
The PolygonOverlay class’s constructor takes a number of these options, making it more flexible. For example:
In the previous post, all graphics on the map were erased each time the polygons needed to be redrawn. This is a problem if there are other graphics on the map. Now that we have added geocoding functionality to the sample application, we will draw the geocode results as a marker on the map along with an info window. We don't want these graphics to be erased when the user pans or zooms and the parcel polygons are redrawn.
The new PolygonOverlay class handles this by keeping track of all the Google Polygon objects that it draws on the map. When it needs to redraw the polygons, only the previous polygons are removed from the map, while the other graphics are left on the map. Check out the PolygonOverlay.as class for more details.
Adding Geocode Functionality
The new sample application also adds geocoding using the ClientGeocoder class. The findAddress function sets up the client geocoder and dispatches the request:
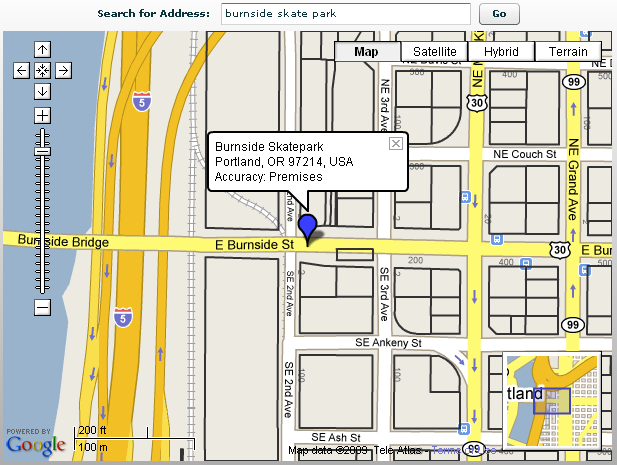
One interesting thing that’s happening here is that we’re constraining the geocode request to a viewport that is in/around the Portland, Oregon area. Google’s geocoding service will attempt to find the best match in that area.
I don’t know much about Portland (I’ve never been there) but I do know that it’s home to a number of microbreweries as well as the historic Burnside Skate Park. Try entering these addresses and place names:
- 206 SW Morrison St (Location of the Rock Bottom Brewery)
- Burnside Skate Park
One of the interesting things about using the Geocoding Service with a viewport is that many place names get resolved to actual locations without having to go through a confirmation step. This won’t work everywhere for every place name, but it helps narrow things down a bit so Google’s Geocoding Service can work its magic.
Wrap Up
That’s all the detail I’ll cover in the post, but be sure to check out the source code for more goodies like how to add the address marker and pop up an info window.
Stay tuned for future posts, where we will continue to add functionality and improve upon the code.
Live example is here, and source code is here.

 浙公网安备 33010602011771号