<!--
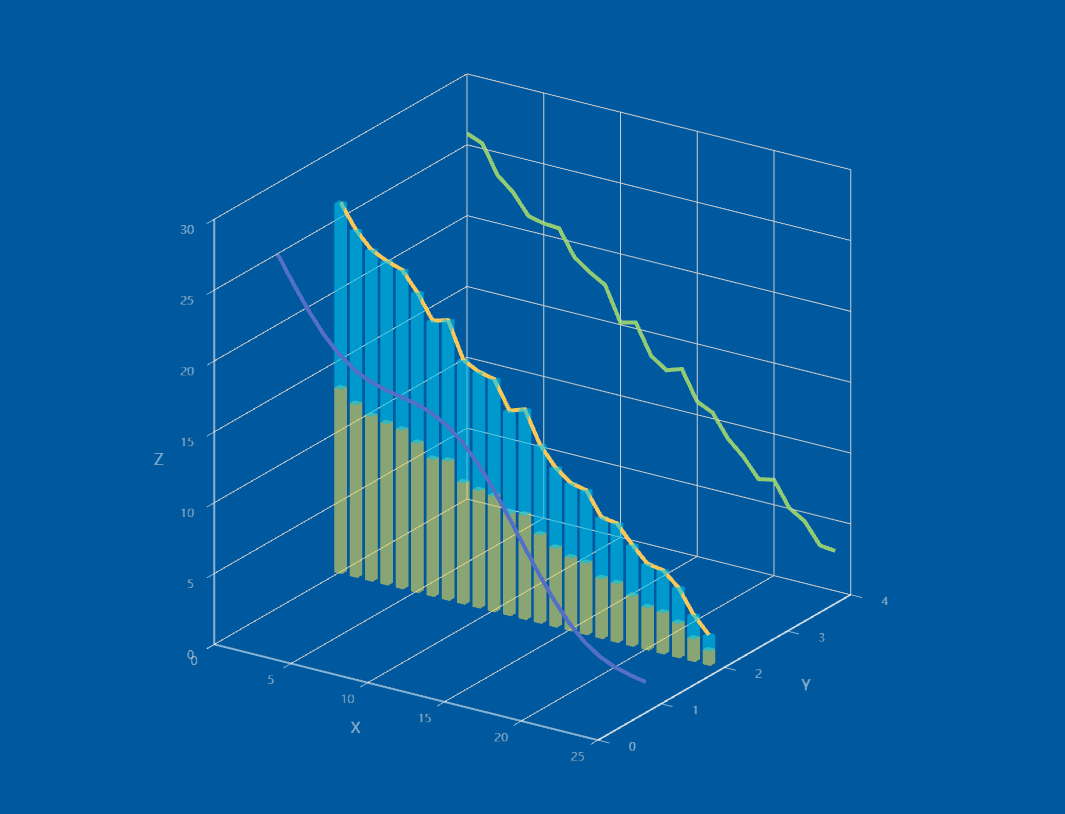
⚠ 请注意,该图表不是 Apache ECharts 官方示例,而是由用户代码生成的。请注意鉴别其内容。
-->
<!DOCTYPE html>
<html lang="zh-CN" style="height: 100%">
<head>
<meta charset="utf-8">
</head>
<body style="height: 100%; margin: 0">
<div id="container" style="height: 100%"></div>
<script type="text/javascript" src="https://fastly.jsdelivr.net/npm/echarts@5.4.2/dist/echarts.min.js"></script>
<!-- Uncomment this line if you want to dataTool extension
<script type="text/javascript" src="https://fastly.jsdelivr.net/npm/echarts@5.4.2/dist/extension/dataTool.min.js"></script>
-->
<!-- Uncomment this line if you want to use gl extension
<script type="text/javascript" src="https://fastly.jsdelivr.net/npm/echarts-gl@2/dist/echarts-gl.min.js"></script>
-->
<!-- Uncomment this line if you want to echarts-stat extension
<script type="text/javascript" src="https://fastly.jsdelivr.net/npm/echarts-stat@latest/dist/ecStat.min.js"></script>
-->
<!-- Uncomment this line if you want to use map
<script type="text/javascript" src="https://fastly.jsdelivr.net/npm/echarts@4.9.0/map/js/china.js"></script>
<script type="text/javascript" src="https://fastly.jsdelivr.net/npm/echarts@4.9.0/map/js/world.js"></script>
-->
<!-- Uncomment these two lines if you want to use bmap extension
<script type="text/javascript" src="https://api.map.baidu.com/api?v=3.0&ak=YOUR_API_KEY"></script>
<script type="text/javascript" src="https://fastly.jsdelivr.net/npm/echarts@5.4.2/dist/extension/bmap.min.js"></script>
-->
<script type="text/javascript">
var dom = document.getElementById('container');
var myChart = echarts.init(dom, null, {
renderer: 'canvas',
useDirtyRect: false
});
var app = {};
var option;
var data = [];
var data1 = [];
var data2 = [];
var data3 = [];
var data4 = [];
// Parametric curve
for (var t = 0; t < 25; t += 1) {
var y = t;
var z = 25- t + 2.0 * Math.sin(75 * t);
var z1 =25- t + 2.0 * Math.random().toFixed(2);
var z2 =25- t + 2.0 * Math.random().toFixed(2);
data.push([y, 1, z]);
data1.push([y, 4, z1]);
data2.push([y, 2, z2 / 2]);
data3.push([y, 2, z2]);
data4.push([y, 2, z2 / 2]);
}
console.log(data.length);
option = {
tooltip: {},
backgroundColor: '#00599f',
// visualMap: {
// show: false,
// dimension: 2,
// min: 0,
// max: 30,
// inRange: {
// color: [
// '#313695',
// '#4575b4',
// '#74add1',
// '#abd9e9',
// '#e0f3f8',
// '#ffffbf',
// '#fee090',
// '#fdae61',
// '#f46d43',
// '#d73027',
// '#a50026'
// ]
// }
// },
xAxis3D: {
type: 'value'
},
yAxis3D: {
type: 'value',
splitLine: {
show: false
}
},
zAxis3D: {
type: 'value'
},
grid3D: {
viewControl: {
projection: 'orthographic'
},
axisLine: {
lineStyle: { color: '#ffffff88' }
},
// axisPointer: {
// lineStyle: { color: '#ffffff33' }
// },
light: {
main: {
shadow: true,
quality: 'ultra',
intensity: 1.5
}
}
},
series: [
{
type: 'line3D',
data: data,
lineStyle: {
width: 4
}
},
{
type: 'line3D',
data: data1,
lineStyle: {
width: 4
}
},
{
type: 'line3D',
data: data3,
lineStyle: {
width: 4
}
},
{
type: 'bar3D',
barSize: [2, 2],
data: data2.map(function (item) {
return {
value: [item[0], item[1], item[2]]
};
}),
shading: 'color',
label: {
show: false,
fontSize: 16,
borderWidth: 1
},
itemStyle: {
color: '#e5d856',
opacity: 0.6
},
stack: 'stack',
// shading: 'lambert',
emphasis: {
label: {
fontSize: 20,
color: '#900'
},
itemStyle: {
color: '#900'
}
}
},
{
type: 'bar3D',
barSize: [2, 2],
data: data4.map(function (item) {
return {
value: [item[0], item[1], item[2]]
};
}),
shading: 'color',
label: {
show: false,
fontSize: 16,
borderWidth: 1
},
itemStyle: {
color: '#00c4ec',
opacity: 0.6
},
stack: 'stack',
// shading: 'lambert',
emphasis: {
label: {
fontSize: 20,
color: '#900'
},
itemStyle: {
color: '#900'
}
}
}
]
};
if (option && typeof option === 'object') {
myChart.setOption(option);
}
window.addEventListener('resize', myChart.resize);
</script>
</body>
</html>

 浙公网安备 33010602011771号