
python 性能测试之获取app 电量消耗
一、实现代码
import os,csv
import time
import numpy as np
from matplotlib import pyplot as plt
from check_package import check_package
import math

battery_list=[]
time_list=[]
adress='app'
package_name,activity=check_package(adress)

# 写入表头
def write_head():
    headers = []
    headers.append('time')
    headers.append('init_battery')
    with open('files/batteryinfo.csv','w+',newline='') as f:
        writer = csv.DictWriter(f,fieldnames=headers)
        writer.writeheader()
# 控制获取cpu时间
def time_control():
    while True:
        end_time = time.time()
        # 通过开始时间和结束时间计算时间差判断是否在输入的时间内,超过输入时间则结束获取cpu值
        if (end_time-start_time)/60>=total_time:
            break
        # 检测一次某app的电量占用情况,先设置为未充电状态
        cmd = "adb shell dumpsys battery set status 1"
        os.popen(cmd)
        adb = 'adb shell dumpsys battery > files/battery_adb_info.csv'
        d = os.system(adb)
        get_battery()

# 获取cpu
def get_battery():
    with open('files/battery_adb_info.csv',encoding='utf-8',mode='r') as f:
        lines = f.readlines()
        for line in lines:
            if 'level' in line:
                now = time.strftime('%H:%M:%S',time.localtime())
                time_list.append(now)
                power = line.split(":")[1]
                print(power)
                battery_list.append(power)

# 将数据写入csv
def write_report():
    with open('files/batteryinfo.csv','a+',newline='') as f:
        writer = csv.writer(f)
        for i in range(0,len(battery_list)):
            writer.writerow([time_list[i],battery_list[i]])
        print('数据插入成功')

# 绘制折线图
def mapping():
    hights = battery_list
    # 将cpu值转换为浮点类型数据
    hights_float = list(map(float,hights))
    wights = time_list
    total=0
    for hight in hights_float:
        total+=hight
    ave = round(total/len(hights_float),2)
    # 计算cpu最高值和最低值
    sort_hights_float = sorted(hights_float)
    min_hight = round(sort_hights_float[0],2)
    max_hight = round(sort_hights_float[-1],2)
    print('最大值为:%.2f,最小值为%.2f,平均值为%.2f'%(max_hight,min_hight,ave))
    # 根据数据绘制图形
    # 创建自定义图像
    plt.figure(figsize=(11,4),dpi=600)
    # 生成网格,只展示y轴
    plt.grid(axis='y')
    # 绘制折线图
    plt.plot(wights,hights_float,'c-',linewidth=1,label=app_name)
    # 设置坐标轴范围
    plt.xlabel('time(H:Min:S)',fontsize=16)
    plt.ylabel('battery_realtime(%)',fontsize=16)
    plt.title('{} battery occupation'.format(app_name),fontsize=24)
    # 显示label
    plt.legend()
    # 横坐标显示间隔
    # 进行时间列表去重
    wights = list(set(wights))
    if len(wights)<=15:
        pass
    else:
        t = int(len(wights)/15)
        # 显示x轴的刻标,以时间间隔t展示
        plt.xticks(range(0,len(wights),t))
    # 旋转横坐标日期
    plt.gcf().autofmt_xdate()
    time_now = time.strftime('%H:%M:%S',time.localtime())
    save_path = 'pack/pictures/'+'{}_battery_occupation_'.format(app_name)+ time_now
    plt.savefig(save_path)

if __name__=='__main__':
    total_time = math.ceil(float(input('请输入脚本执行时间(分钟):')))
    app_name = input('请输入app名称:')
    start_time = time.time()
    write_head()
    time_control()
    write_report()
    mapping()
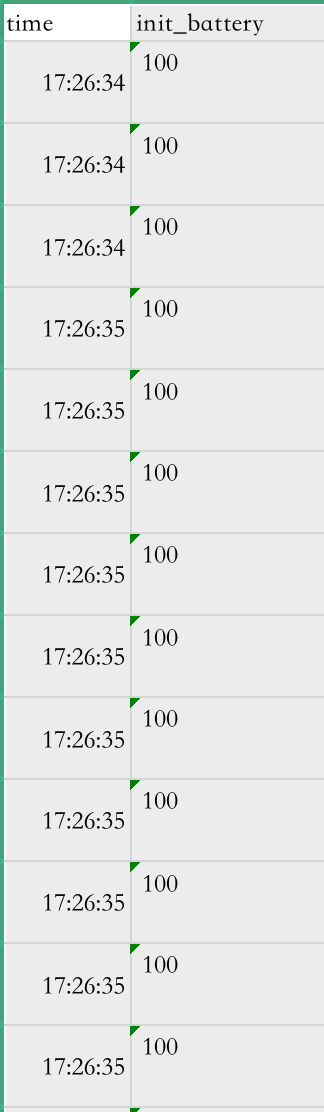
二、数据采集
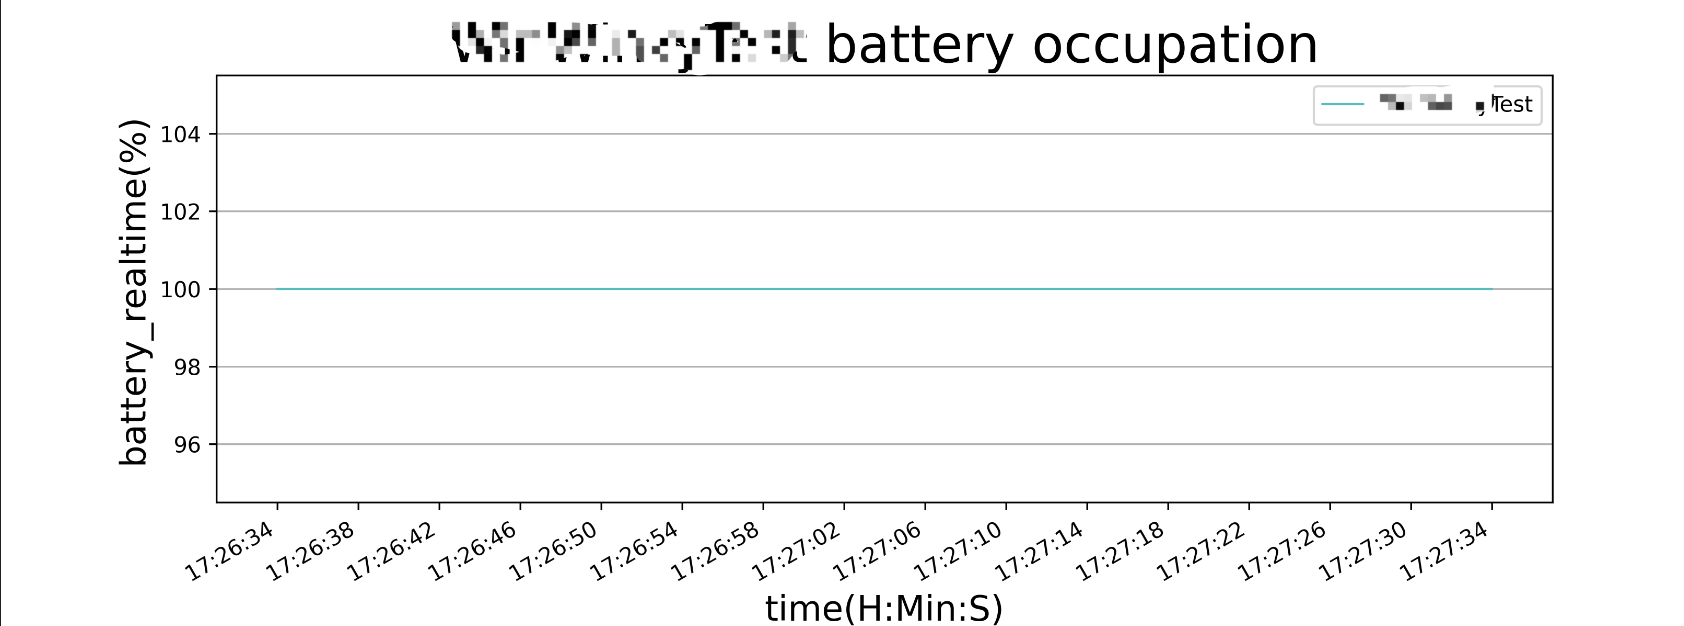
三、曲线图

 浙公网安备 33010602011771号