
Arthas
1.火焰图
profiler start 启动采集(默认是CPU)
profiler getSamples 查看采样的数量
profiler status 查看采样的状态(是否在运行,运行了多久)
profiler stop 停止并生成火焰图
通过路径或web打开http://localhost:3658/arthas-output/
1.1 解析
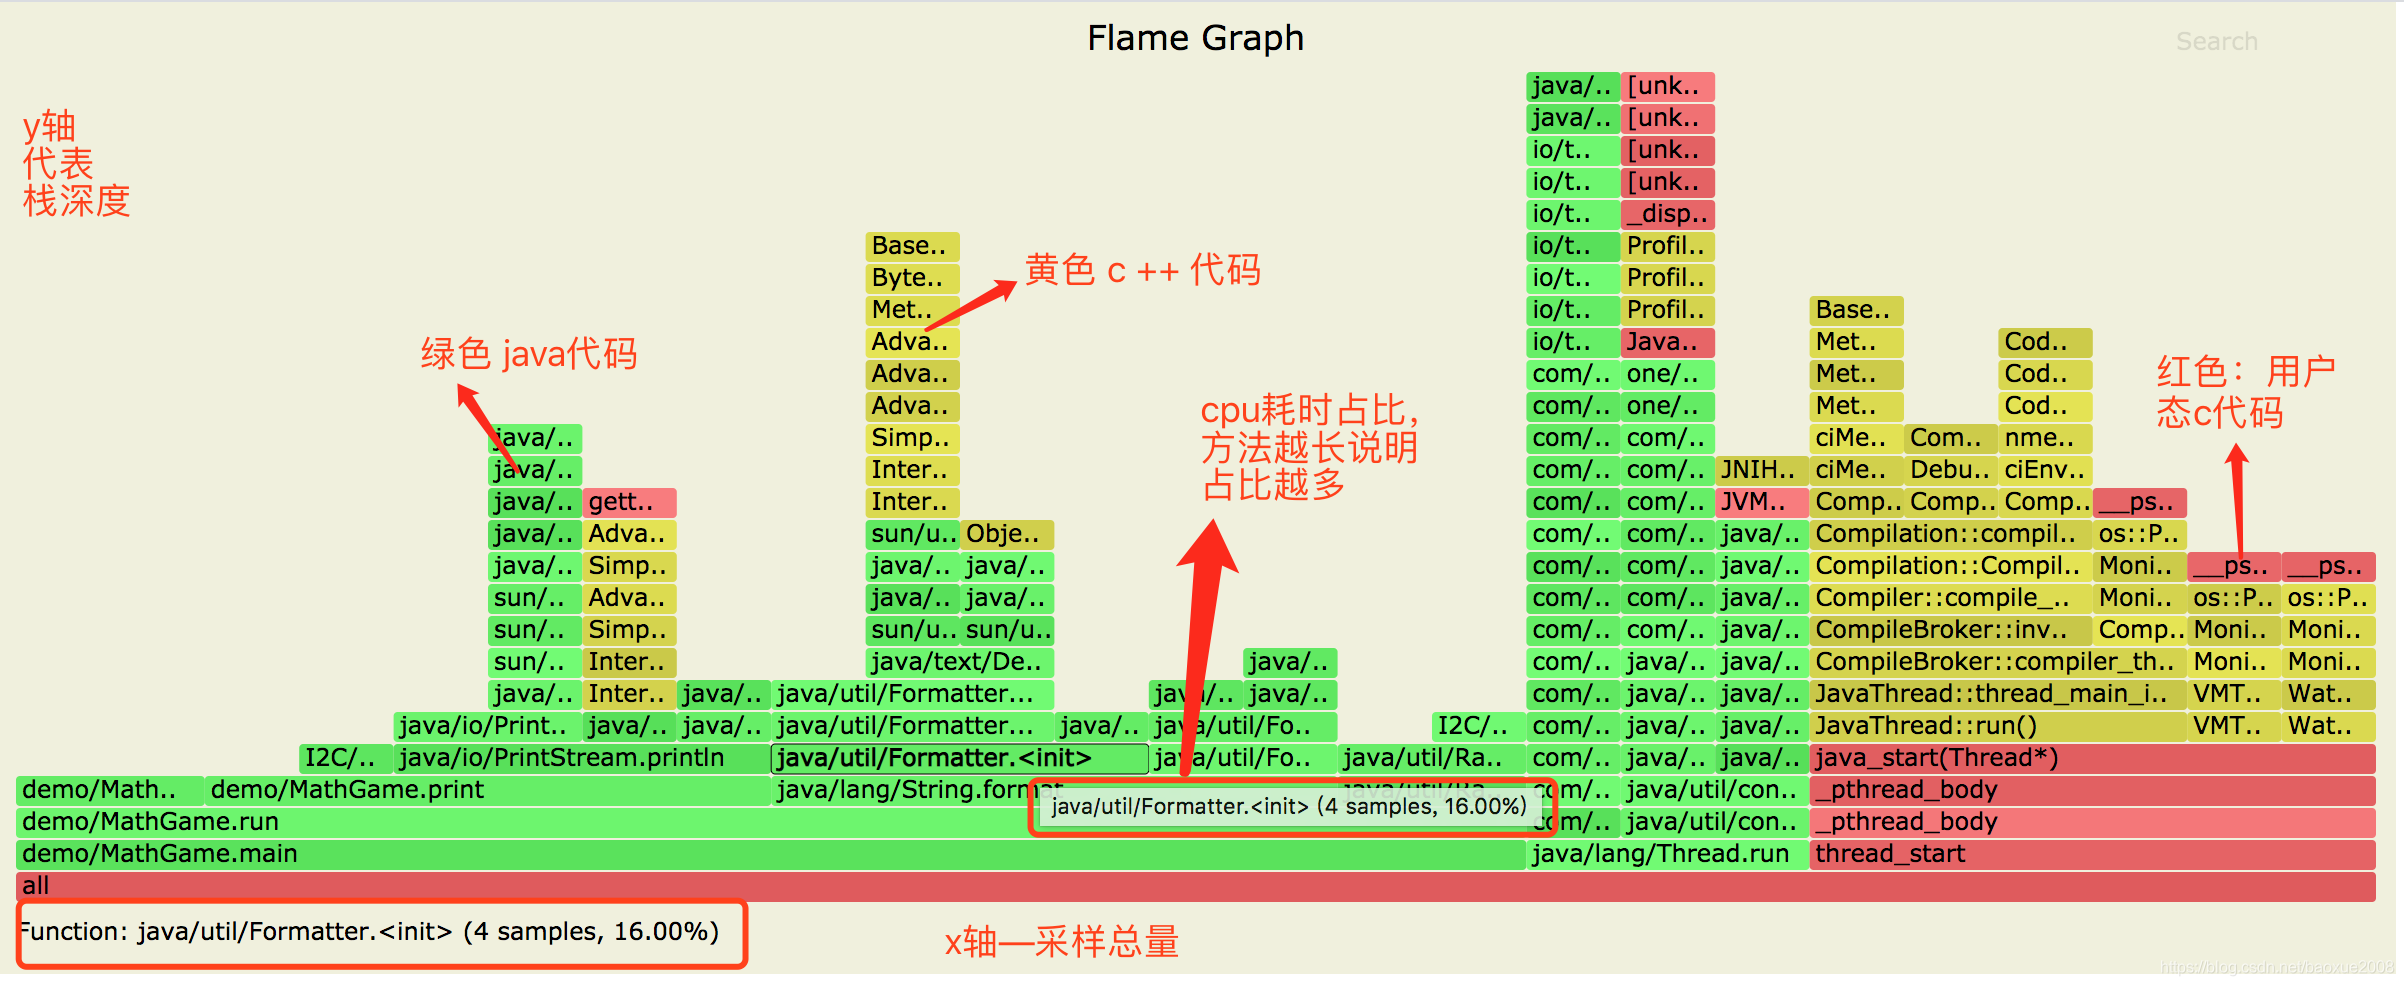
占比比较宽的框就表示:
a.该函数运行时间较长(单次时间长)
b.被调用次数较多.(调用频率高)
进而被采样的次数比较多,占用的CPU时间多。

 浙公网安备 33010602011771号