随机采样一致性算法(一)初识
转载自:http://www.cnblogs.com/xingshansi/p/6763668.html
前言
理解最小二乘、霍夫变换、RANSAC在直线拟合上的区别。昨天梳理了霍夫变换,今天打算抽空梳理一下RANSAC算法,主要包括:
1)RANSAC理论介绍
2)RANSAC应用简介;
内容为自己的学习记录,其中很多地方借鉴了别人,最后一起给出链接。
一、RANSAC理论介绍
普通最小二乘是保守派:在现有数据下,如何实现最优。是从一个整体误差最小的角度去考虑,尽量谁也不得罪。
RANSAC是改革派:首先假设数据具有某种特性(目的),为了达到目的,适当割舍一些现有的数据。
给出最小二乘拟合(红线)、RANSAC(绿线)对于一阶直线、二阶曲线的拟合对比:

可以看到RANSAC可以很好的拟合。RANSAC可以理解为一种采样的方式,所以对于多项式拟合、混合高斯模型(GMM)等理论上都是适用的。
RANSAC的算法大致可以表述为(来自wikipedia):
Given:
    data – a set of observed data points
    model – a model that can be fitted to data points
    n – the minimum number of data values required to fit the model
    k – the maximum number of iterations allowed in the algorithm
    t – a threshold value for determining when a data point fits a model
    d – the number of close data values required to assert that a model fits well to data

Return:
    bestfit – model parameters which best fit the data (or nul if no good model is found)

iterations = 0
bestfit = nul
besterr = something really large
while iterations < k {
    maybeinliers = n randomly selected values from data
    maybemodel = model parameters fitted to maybeinliers
    alsoinliers = empty set
    for every point in data not in maybeinliers {
        if point fits maybemodel with an error smaller than t
             add point to alsoinliers
    }
    if the number of elements in alsoinliers is > d {
        % this implies that we may have found a good model
        % now test how good it is
        bettermodel = model parameters fitted to all points in maybeinliers and alsoinliers
        thiserr = a measure of how well model fits these points
        if thiserr < besterr {
            bestfit = bettermodel
            besterr = thiserr
        }
    }
    increment iterations
}
return bestfit
RANSAC简化版的思路就是:
第一步:假定模型(如直线方程),并随机抽取Nums个(以2个为例)样本点,对模型进行拟合:
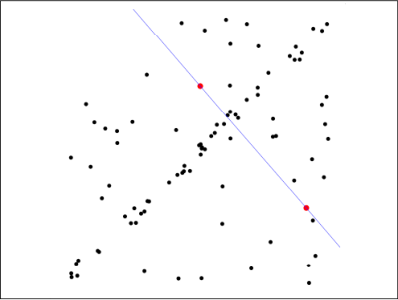
第二步:由于不是严格线性,数据点都有一定波动,假设容差范围为:sigma,找出距离拟合曲线容差范围内的点,并统计点的个数:
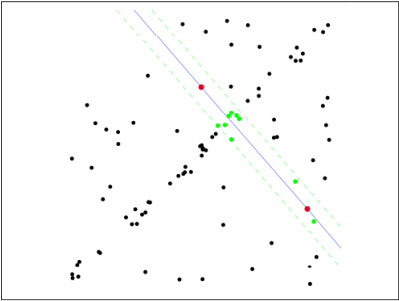
第三步:重新随机选取Nums个点,重复第一步~第二步的操作,直到结束迭代:

第四步:每一次拟合后,容差范围内都有对应的数据点数,找出数据点个数最多的情况,就是最终的拟合结果:
至此:完成了RANSAC的简化版求解。
这个RANSAC的简化版,只是给定迭代次数,迭代结束找出最优。如果样本个数非常多的情况下,难不成一直迭代下去?其实RANSAC忽略了几个问题:
- 每一次随机样本数Nums的选取:如二次曲线最少需要3个点确定,一般来说,Nums少一些易得出较优结果;
- 抽样迭代次数Iter的选取:即重复多少次抽取,就认为是符合要求从而停止运算?太多计算量大,太少性能可能不够理想;
- 容差Sigma的选取:sigma取大取小,对最终结果影响较大;
这些参数细节信息参考:维基百科。
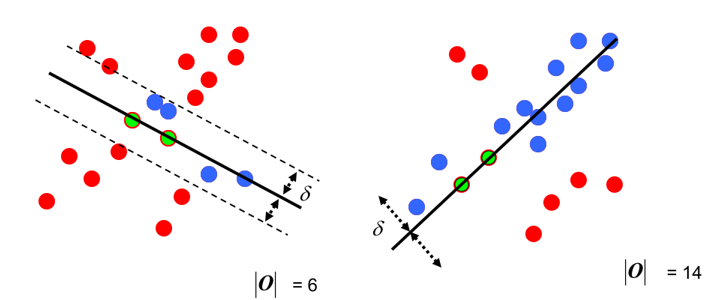
RANSAC的作用有点类似:将数据一切两段,一部分是自己人,一部分是敌人,自己人留下商量事,敌人赶出去。RANSAC开的是家庭会议,不像最小二乘总是开全体会议。
附上最开始一阶直线、二阶曲线拟合的code(只是为了说明最基本的思路,用的是RANSAC的简化版):
一阶直线拟合:
 1 %随机一致性采样
 2 clc;clear all;close all;
 3 set(0,'defaultfigurecolor','w');
 4 %Generate data
 5 param = [3 2];
 6 npa = length(param);
 7 x = -20:20;
 8 noise = 3 * randn(1, length(x));
 9 y = param*[x; ones(1,length(x))]+3*randn(1,length(x));
10 data = [x randi(20,1,30);...
11         y randi(20,1,30)];
12 %figure
13 figure
14 subplot 121
15 plot(data(1,:),data(2,:),'k*');hold on;
16 %Ordinary least square mean
17 p = polyfit(data(1,:),data(2,:),npa-1);
18 flms = polyval(p,x);
19 plot(x,flms,'r','linewidth',2);hold on;
20 title('最小二乘拟合');
21 %Ransac
22 Iter = 100;
23 sigma = 1;
24 Nums = 2;%number select
25 res = zeros(Iter,npa+1);
26 for i = 1:Iter
27 idx = randperm(size(data,2),Nums);
28 if diff(idx) ==0
29     continue;
30 end
31 sample = data(:,idx);
32 pest = polyfit(sample(1,:),sample(2,:),npa-1);%parameter estimate
33 res(i,1:npa) = pest;
34 res(i,npa+1) = numel(find(abs(polyval(pest,data(1,:))-data(2,:))<sigma));
35 end
36 [~,pos] = max(res(:,npa+1));
37 pest = res(pos,1:npa);
38 fransac = polyval(pest,x);
39 %figure
40 subplot 122
41 plot(data(1,:),data(2,:),'k*');hold on;
42 plot(x,flms,'r','linewidth',2);hold on;
43 plot(x,fransac,'g','linewidth',2);hold on;
44 title('RANSAC');
二阶曲线拟合:
|
1
2
3
4
5
6
7
8
9
10
11
12
13
14
15
16
17
18
19
20
21
22
23
24
25
26
27
28
29
30
31
32
33
34
35
36
37
38
39
40
41
|
clc;clear all; set(0,'defaultfigurecolor','w');%Generate dataparam = [3 2 5];npa = length(param);x = -20:20;y = param*[x.^2;x;ones(1,length(x))]+3*randn(1,length(x));data = [x randi(20,1,30);... y randi(200,1,30)];%figuresubplot 223plot(data(1,:),data(2,:),'k*');hold on;%Ordinary least square meanp = polyfit(data(1,:),data(2,:),npa-1);flms = polyval(p,x);plot(x,flms,'r','linewidth',2);hold on;title('最小二乘拟合');%RansacIter = 100;sigma = 1;Nums = 3;%number selectres = zeros(Iter,npa+1);for i = 1:Iteridx = randperm(size(data,2),Nums); if diff(idx) ==0 continue;endsample = data(:,idx);pest = polyfit(sample(1,:),sample(2,:),npa-1);%parameter estimateres(i,1:npa) = pest;res(i,npa+1) = numel(find(abs(polyval(pest,data(1,:))-data(2,:))<sigma));end[~,pos] = max(res(:,npa+1));pest = res(pos,1:npa);fransac = polyval(pest,x);%figuresubplot 224plot(data(1,:),data(2,:),'k*');hold on;plot(x,flms,'r','linewidth',2);hold on;plot(x,fransac,'g','linewidth',2);hold on;title('RANSAC'); |
二、RANSAC应用简介
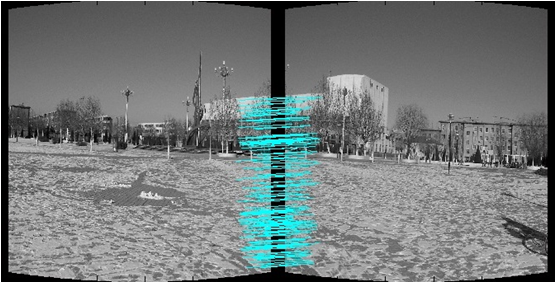
RANSAC其实就是一种采样方式,例如在图像拼接(Image stitching)技术中:
第一步:预处理后(据说桶形变换,没有去了解过)提取图像特征(如SIFT)
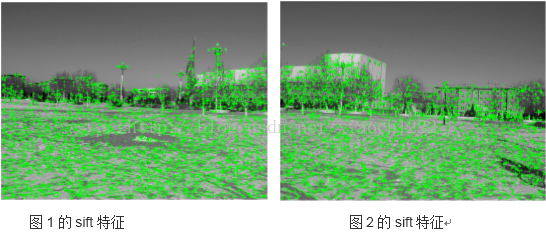
第二步:特征点进行匹配,可利用归一化互相关(Normalized Cross Correlation method, NCC)等方法。
但这个时候会有很多匹配错误的点:

这就好比拟合曲线,有很多的误差点,这个时候就想到了RANSAC算法:我不要再兼顾所有了,每次选取Nums个点匹配 → 计算匹配后容差范围内的点数 → 重复实验,迭代结束后,找出点数最多的情况,就是最优的匹配。
利用RANSAC匹配:
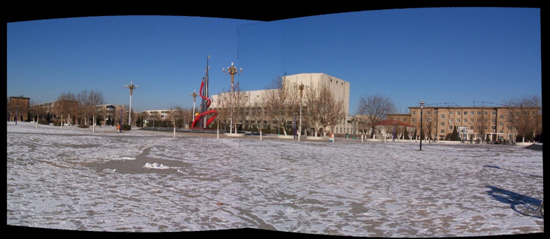
第三步:图像拼接,这个就涉及拼接技术了,直接给出结果:
参考:
作者:白菜菜白
出处:http://www.cnblogs.com/lvchaoshun/
本文版权归作者和博客园共有,欢迎转载,但未经作者同意必须保留此段声明,且在文章页面明显位置给出原文连接,否则保留追究法律责任的权利。

 浙公网安备 33010602011771号