基于Pandas
# 绘制图形时,须作一些基本设置
%config InlineBackend.figure_format='retina' # 提高图形显示的清晰度
import matplotlib.pyplot as plt # 加载基本绘图包
import pandas as pd
BSdata=pd.read_excel('data/BSdata.xlsx','Sheet1');BSdata #读取数据
| Region/Country/Area | Unnamed: 1 | Year | Series | Value | Footnotes | Source | |
|---|---|---|---|---|---|---|---|
| 0 | 1 | Total, all countries or areas | 2010 | Population mid-year estimates (millions) | 6956.82 | NaN | United Nations Population Division, New York, ... |
| 1 | 1 | Total, all countries or areas | 2010 | Population mid-year estimates for males (milli... | 3507.70 | NaN | United Nations Population Division, New York, ... |
| 2 | 1 | Total, all countries or areas | 2010 | Population mid-year estimates for females (mil... | 3449.12 | NaN | United Nations Population Division, New York, ... |
| 3 | 1 | Total, all countries or areas | 2010 | Sex ratio (males per 100 females) | 101.70 | NaN | United Nations Population Division, New York, ... |
| 4 | 1 | Total, all countries or areas | 2010 | Population aged 0 to 14 years old (percentage) | 27.00 | NaN | United Nations Population Division, New York, ... |
| 5 | 1 | Total, all countries or areas | 2010 | Population aged 60+ years old (percentage) | 11.00 | NaN | United Nations Population Division, New York, ... |
| 6 | 1 | Total, all countries or areas | 2010 | Population density | 53.50 | NaN | United Nations Population Division, New York, ... |
| 7 | 1 | Total, all countries or areas | 2015 | Population mid-year estimates (millions) | 7379.80 | NaN | United Nations Population Division, New York, ... |
| 8 | 1 | Total, all countries or areas | 2015 | Population mid-year estimates for males (milli... | 3720.70 | NaN | United Nations Population Division, New York, ... |
| 9 | 1 | Total, all countries or areas | 2015 | Population mid-year estimates for females (mil... | 3659.10 | NaN | United Nations Population Division, New York, ... |
| 10 | 1 | Total, all countries or areas | 2015 | Sex ratio (males per 100 females) | 101.70 | NaN | United Nations Population Division, New York, ... |
| 11 | 1 | Total, all countries or areas | 2015 | Population aged 0 to 14 years old (percentage) | 26.20 | NaN | United Nations Population Division, New York, ... |
| 12 | 1 | Total, all countries or areas | 2015 | Population aged 60+ years old (percentage) | 12.20 | NaN | United Nations Population Division, New York, ... |
| 13 | 1 | Total, all countries or areas | 2015 | Population density | 56.70 | NaN | United Nations Population Division, New York, ... |
| 14 | 1 | Total, all countries or areas | 2015 | Surface area (thousand km2) | 136162.00 | NaN | United Nations Statistics Division, New York, ... |
| 15 | 1 | Total, all countries or areas | 2019 | Population mid-year estimates (millions) | 7713.47 | NaN | United Nations Population Division, New York, ... |
| 16 | 1 | Total, all countries or areas | 2019 | Population mid-year estimates for males (milli... | 3889.03 | NaN | United Nations Population Division, New York, ... |
| 17 | 1 | Total, all countries or areas | 2019 | Population mid-year estimates for females (mil... | 3824.43 | NaN | United Nations Population Division, New York, ... |
| 18 | 1 | Total, all countries or areas | 2019 | Sex ratio (males per 100 females) | 101.70 | NaN | United Nations Population Division, New York, ... |
| 19 | 1 | Total, all countries or areas | 2019 | Population aged 0 to 14 years old (percentage) | 25.60 | NaN | United Nations Population Division, New York, ... |
| 20 | 1 | Total, all countries or areas | 2019 | Population aged 60+ years old (percentage) | 13.20 | NaN | United Nations Population Division, New York, ... |
| 21 | 1 | Total, all countries or areas | 2019 | Population density | 59.30 | NaN | United Nations Population Division, New York, ... |
| 22 | 1 | Total, all countries or areas | 2019 | Surface area (thousand km2) | 130094.00 | NaN | United Nations Statistics Division, New York, ... |
| 23 | 1 | Total, all countries or areas | 2021 | Population mid-year estimates (millions) | 7874.97 | Projected estimate (medium fertility variant). | United Nations Population Division, New York, ... |
| 24 | 1 | Total, all countries or areas | 2021 | Population mid-year estimates for males (milli... | 3970.24 | Projected estimate (medium fertility variant). | United Nations Population Division, New York, ... |
4.2.2 基于 Pandas 的绘图
在pandas中,数据框有行标签、列标签及分组信息等,即要制作一张完整的图表,原本需要很多行matplotlib代码,现在只需一两条简洁的语句就可以了。
4.2.2.1 计量数据统计图
plt.rcParams['font.sans-serif']=['SimHei']; # 设置中文黑体
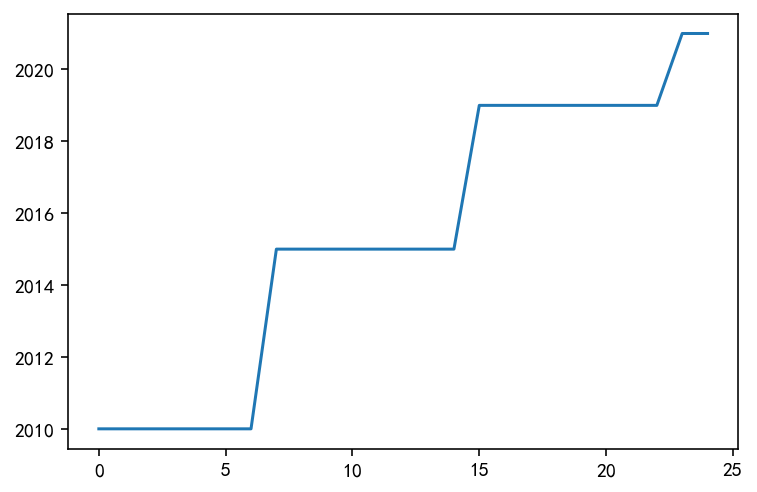
BSdata['Year'].plot(kind='line'); # 线图
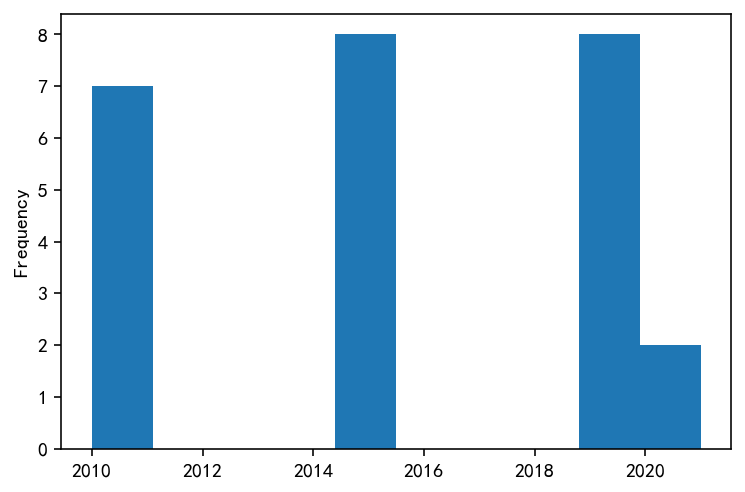
BSdata['Year'].plot(kind='hist'); # 直方图
def stats(x):
    stat=[x.count(),x.min(),x.quantile(.25),x.mean(),x.median(),x.quantile(.75),x.max(),x.max()-x.min(),x.var(),x.std(),x.skew(),x.kurt()]
    stat=pd.Series(stat,index=['Count','Min','Q1(25%)','Mean','Median','Q3(75%)','Max','Range','Var','Std','Skew','Kurt'])
    return stat
stats(BSdata['Year'])
Count        25.000000
Min        2010.000000
Q1(25%)    2010.000000
Mean       2015.360000
Median     2015.000000
Q3(75%)    2019.000000
Max        2021.000000
Range        11.000000
Var          15.490000
Std           3.935734
Skew         -0.247878
Kurt         -1.361406
dtype: float64
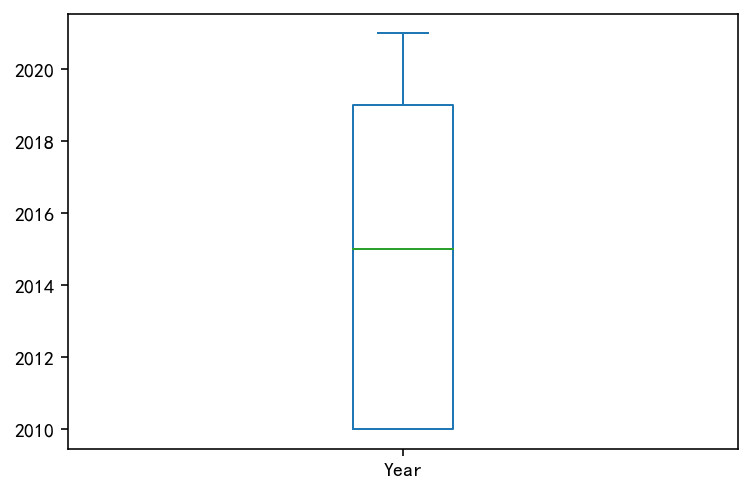
BSdata['Year'].plot(kind='box'); # 箱型图
BSdata['Year'].plot(kind='hist') # 实际的
<AxesSubplot:ylabel='Frequency'>

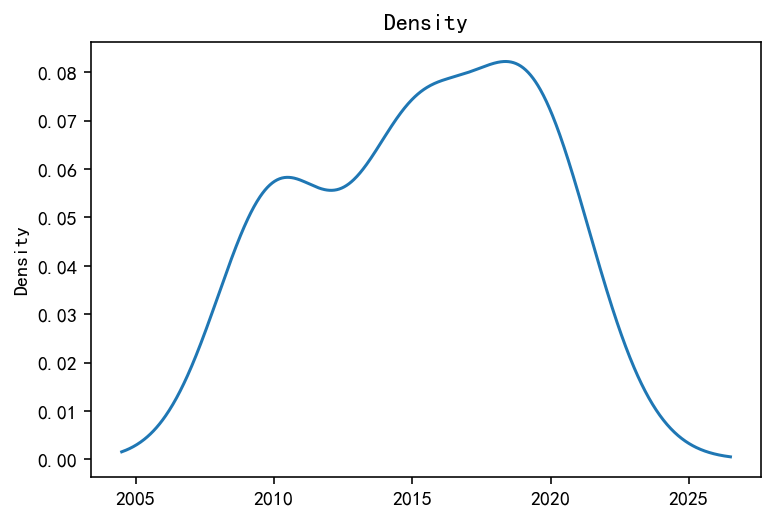
BSdata['Year'].plot(kind='density',title='Density'); # 上面直方图的估计 理论的
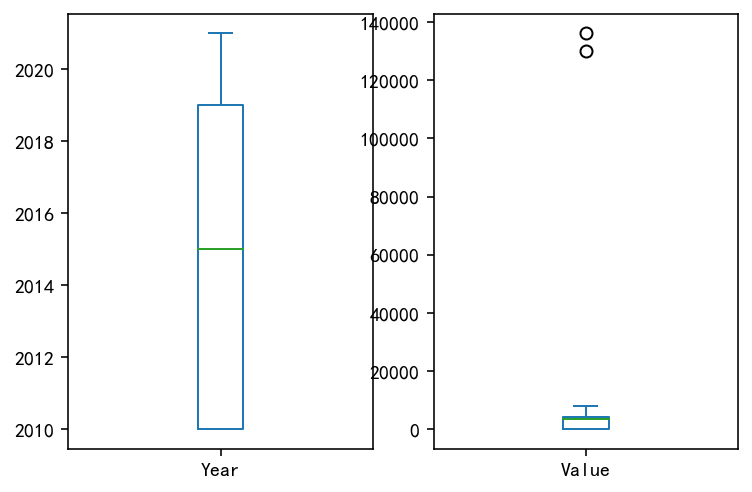
BSdata[['Year','Value']].plot(subplots=True,layout=(1,2),kind='box');
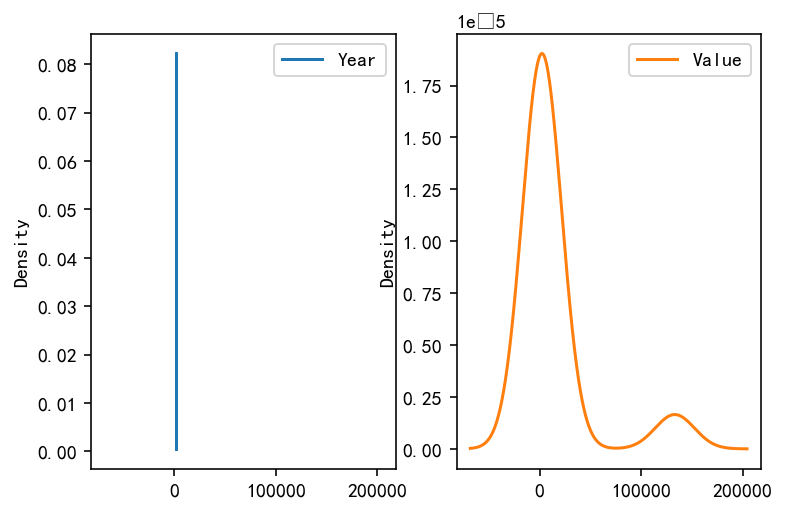
BSdata[['Year','Value']].plot(subplots=True,layout=(1,2),kind='density');
C:\Users\Luna\anaconda3\lib\site-packages\matplotlib\backends\backend_agg.py:240: RuntimeWarning: Glyph 8722 missing from current font.
  font.set_text(s, 0.0, flags=flags)
C:\Users\Luna\anaconda3\lib\site-packages\matplotlib\backends\backend_agg.py:203: RuntimeWarning: Glyph 8722 missing from current font.
  font.set_text(s, 0, flags=flags)
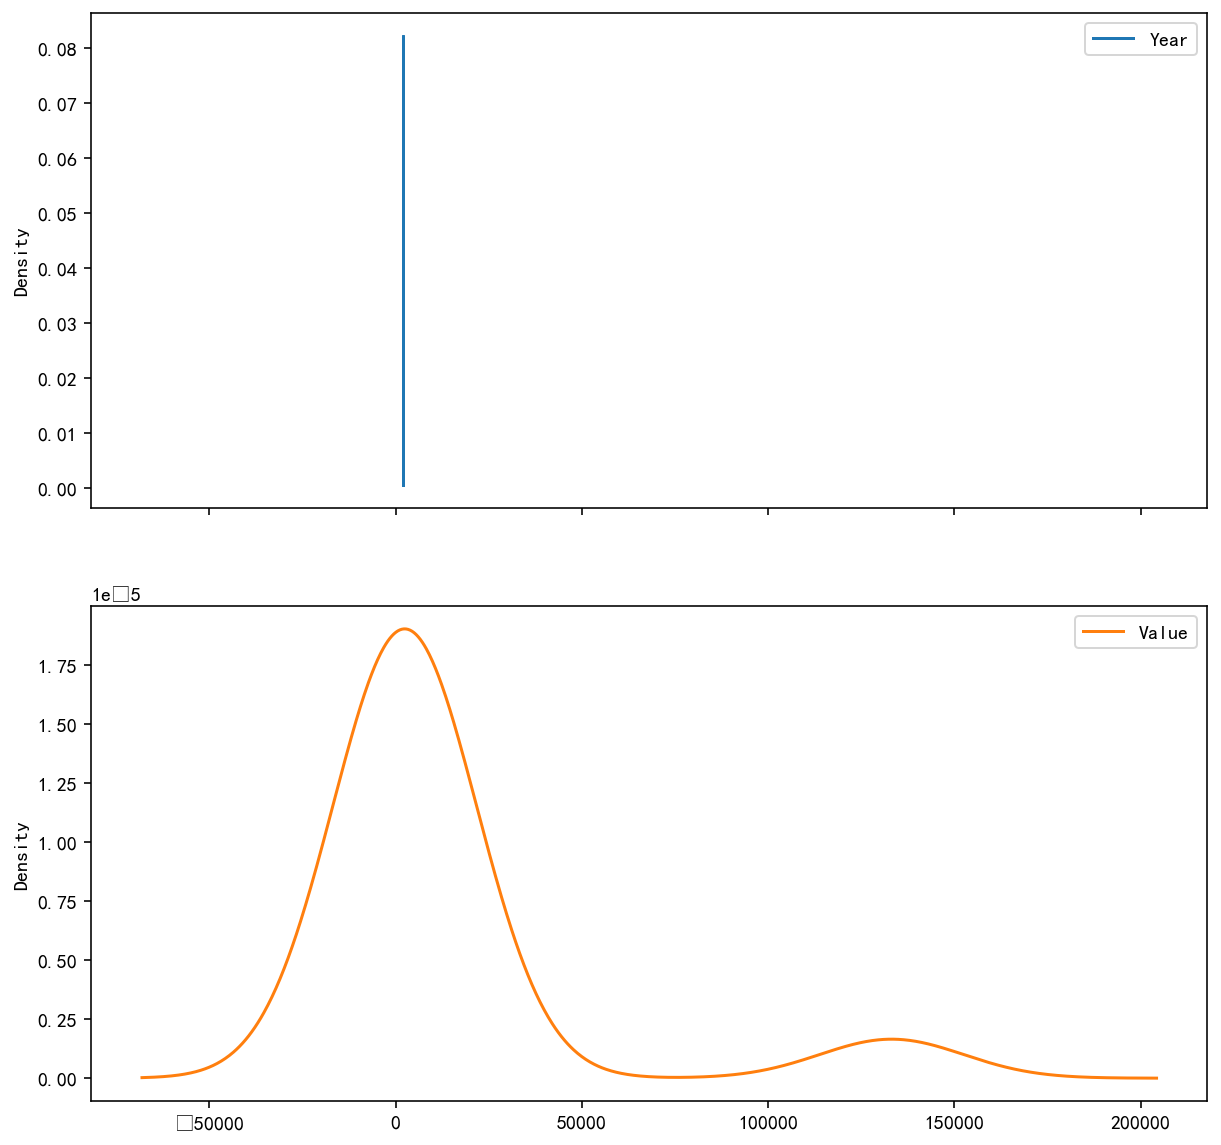
BSdata[['Year','Value']].plot(subplots=True,layout=(2,1),kind='density',figsize=(10,10))
array([[<AxesSubplot:ylabel='Density'>],
       [<AxesSubplot:ylabel='Density'>]], dtype=object)


\anaconda3\lib\site-packages\matplotlib\backends\backend_agg.py:240: RuntimeWarning: Glyph 8722 missing from current font.
  font.set_text(s, 0.0, flags=flags)
\anaconda3\lib\site-packages\matplotlib\backends\backend_agg.py:203: RuntimeWarning: Glyph 8722 missing from current font.
  font.set_text(s, 0, flags=flags)
4.2.2.2 计数数据统计图
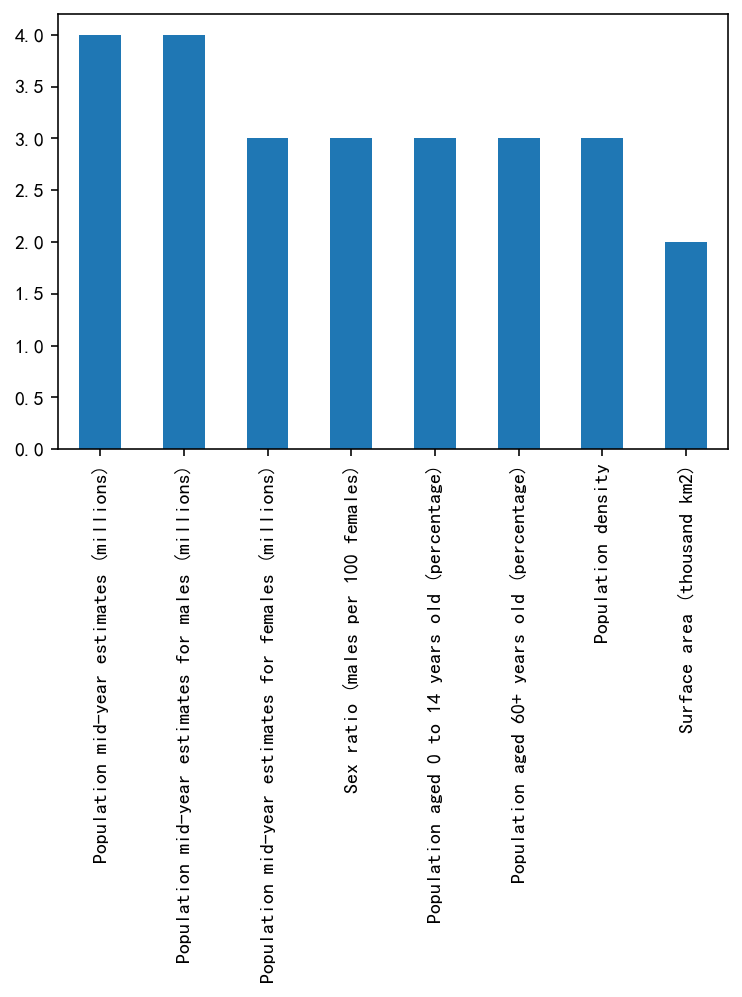
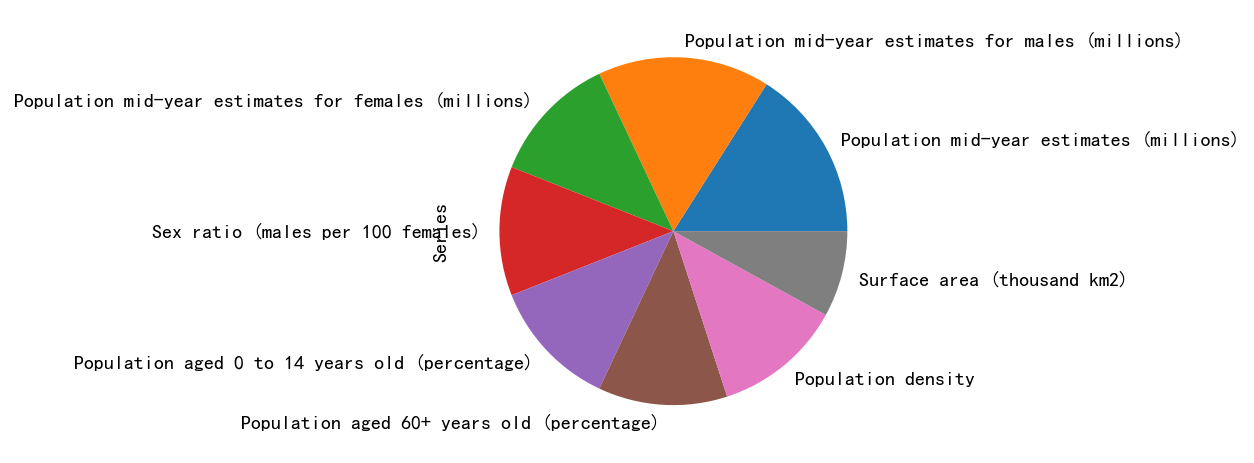
T1=BSdata['Series'].value_counts();T1
Population mid-year estimates (millions)                4
Population mid-year estimates for males (millions)      4
Population mid-year estimates for females (millions)    3
Sex ratio (males per 100 females)                       3
Population aged 0 to 14 years old (percentage)          3
Population aged 60+ years old (percentage)              3
Population density                                      3
Surface area (thousand km2)                             2
Name: Series, dtype: int64
pd.DataFrame({'频数':T1,'频率': T1/T1.sum()*100})
| 频数 | 频率 | |
|---|---|---|
| Population mid-year estimates (millions) | 4 | 16.0 |
| Population mid-year estimates for males (millions) | 4 | 16.0 |
| Population mid-year estimates for females (millions) | 3 | 12.0 |
| Sex ratio (males per 100 females) | 3 | 12.0 |
| Population aged 0 to 14 years old (percentage) | 3 | 12.0 |
| Population aged 60+ years old (percentage) | 3 | 12.0 |
| Population density | 3 | 12.0 |
| Surface area (thousand km2) | 2 | 8.0 |
T1.plot(kind='bar');
T1.plot(kind='pie');

 浙公网安备 33010602011771号