
对RC4算法的单字节偏差攻击
RC4算法的实现:https://www.cnblogs.com/luminescence/p/19225698
单字节偏差分析
偏差分析理论基础
在理想的流密码中,密钥流应该与真正的随机序列不可区分。然而,RC4算法在特定条件下会产生可测量的统计偏差。
统计偏差定义
对于位置i和字节值v,定义偏差为:
其中,\(Pr[Z_i = v]\)表示在位置i处密钥流字节等于v的实际概率,\(\frac{1}{256}\)是期望的均匀分布概率。
偏差倍数
为了更直观地表示偏差强度,定义偏差倍数:
分析方法
数据收集
为了进行可靠的统计分析,需要收集大量独立的密钥流样本。本实验使用1,000,000个随机生成的16字节密钥,对每个密钥收集前256个密钥流字节。
统计检验
采用卡方检验(χ² test)评估每个位置字节分布的随机性。检验统计量为:
其中,\(O_v\)是字节值v的观察频数,\(E_v\)是期望频数。
显著性水平
由于进行了多重比较(256个位置×256个字节值),采用Bonferroni校正控制总体错误率。显著性水平设为:
Z值计算
为了量化每个字节值偏差的显著性,计算Z值:
Z值的绝对值越大,表明偏差越显著
实验结果与分析
实验设置
- 样本数量: 1,000,000个独立密钥
- 密钥长度: 16字节
- 分析范围: 前256个密钥流位置
- 显著性水平: α = 0.05/256 (Bonferroni校正)
全局统计结果
通过对1,000,000个样本的统计分析,获得以下全局统计信息:
- 总样本数: 1,000,000
- 显著偏差数量: 4
- 偏差覆盖率: 1.56%
- 最强偏差倍数: 2.014x
- 最强偏差位置: 1
详细偏差分析
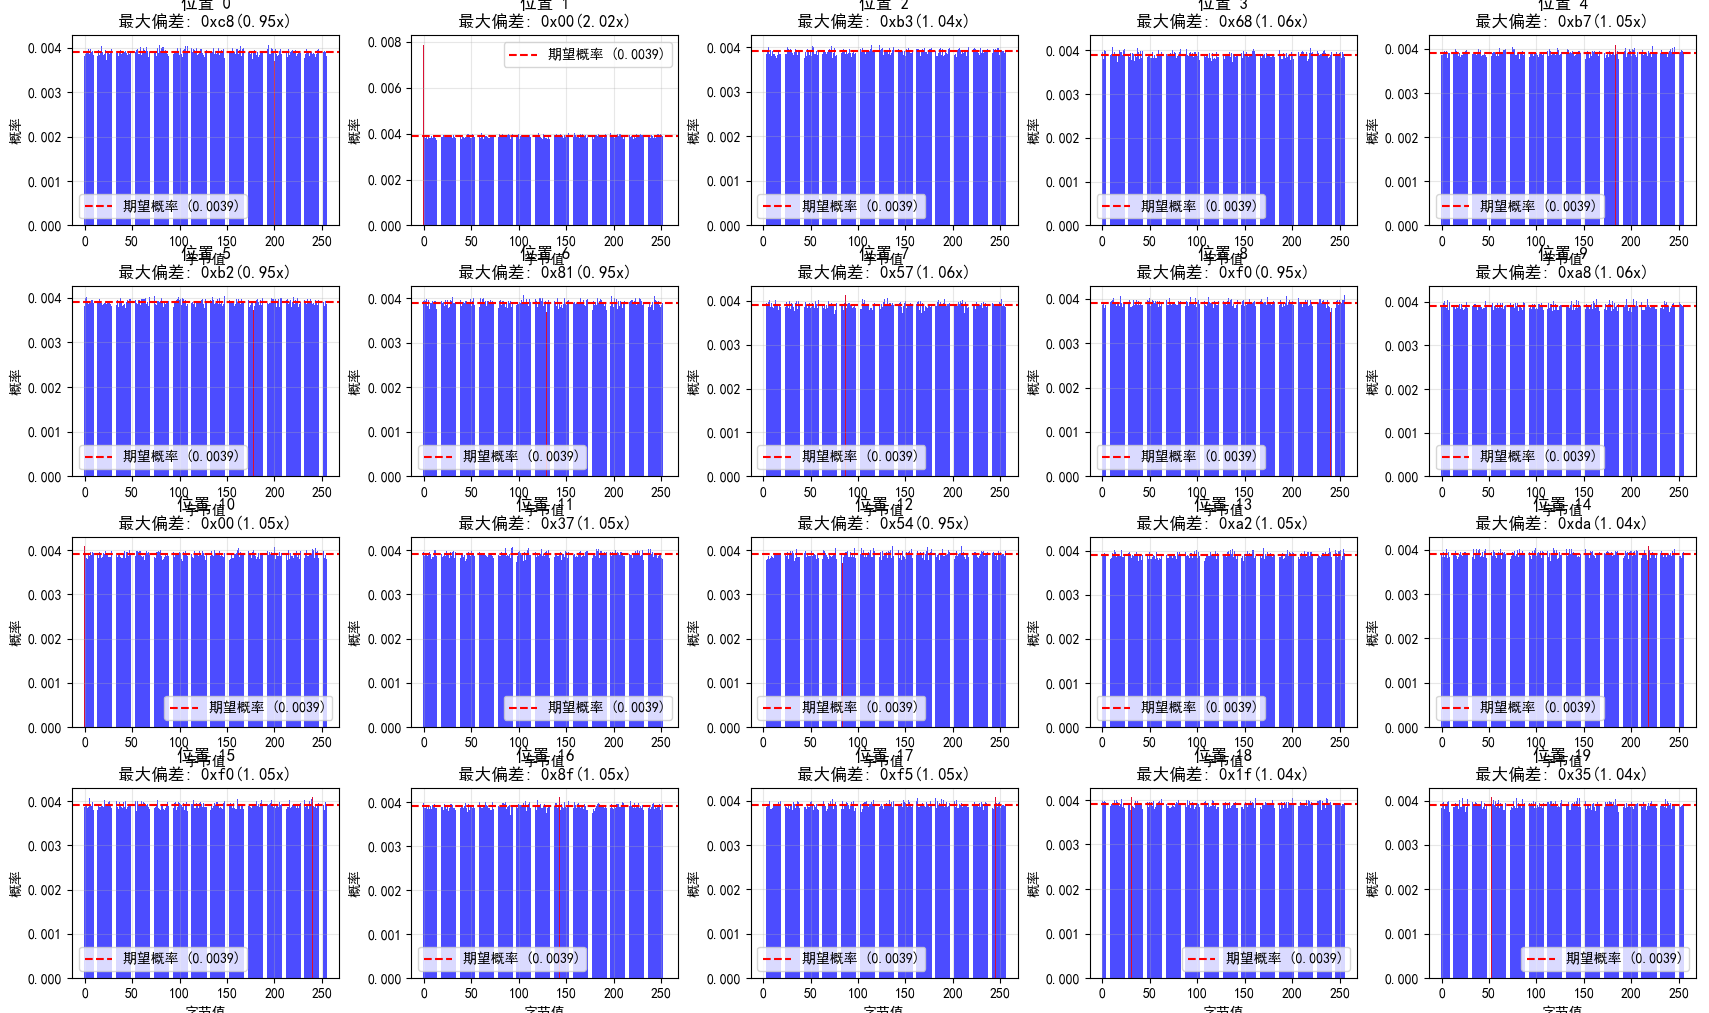
位置1的显著偏差
位置1表现出最强的统计偏差,具体特征如下:
| 字节值 | 偏差倍数 | Z值 | p值 | 显著性 |
|---|---|---|---|---|
| 0x00 | 2.014x | 63.53 | < 10⁻¹⁰⁰ | 高 |
| 0x6b | 1.052x | 3.25 | < 10⁻¹⁰⁰ | 高 |
| 0xf5 | 0.958x | -2.60 | < 10⁻¹⁰⁰ | 高 |
| 0x1e | 0.959x | -2.55 | < 10⁻¹⁰⁰ | 高 |
偏差模式分析
位置1的偏差呈现明显的非对称性:
- 正偏差: 字节0x00和0x6b出现频率显著高于期望值
- 负偏差: 字节0xf5和0x1e出现频率显著低于期望值
- 最强偏差: 字节0x00的出现概率是期望值的2.014倍
与其他位置对比
值得注意的是,在分析的256个位置中,只有位置1表现出统计显著的偏差。其他255个位置的字节分布与均匀分布无显著差异,这表明:
- RC4的偏差具有位置特异性
- 位置1是RC4算法最脆弱的部分
- 大部分密钥流输出具有良好的随机性
安全性影响评估
攻击可行性分析
区分攻击
基于位置1的强偏差,攻击者可以构建有效的区分器。给定足够多的密文样本,攻击者能够以高概率区分RC4输出与真随机序列。
区分攻击的成功率可通过以下公式估算:
其中,Φ是标准正态分布函数,N是样本数量,Bias是偏差大小。
5.1.2 明文恢复攻击
在已知明文攻击场景下,攻击者可以利用偏差恢复部分明文。对于位置1,恢复公式为:
其中,\(\hat{P}_1\)是恢复的明文字节估计值,\(C_1\)是观察到的密文字节。
具体实现
rc4_attack_keystream_bias.py
import numpy as np
import collections
import pickle
import os
from typing import List, Dict, Tuple, Optional
import matplotlib.pyplot as plt
from multiprocessing import Pool, cpu_count
import time
import scipy.stats as stats
from dataclasses import dataclass
@dataclass
class BiasResult:
"""偏差分析结果"""
position: int
byte_value: int
observed_prob: float
expected_prob: float
bias_ratio: float
z_score: float
p_value: float
significance_level: str
class RC4BiasAnalyzer:
def __init__(self, data_file: str = "rc4_bias_analysis.pkl"):
self.data_file = data_file
self.keystreams: Optional[np.ndarray] = None
self.bias_results: List[BiasResult] = []
self.position_analysis: Dict[int, Dict] = {}
self.global_stats: Dict = {}
def _worker_generate_ks(self, args: Tuple[int, int, int]) -> Tuple[np.ndarray, int]:
"""生成一部分密钥流"""
start_idx, num_keys, key_length = args
def ksa(key: bytes) -> List[int]:
key_len = len(key)
s = list(range(256))
j = 0
for i in range(256):
j = (j + s[i] + key[i % key_len]) & 0xFF
s[i], s[j] = s[j], s[i]
return s
def prga(s: List[int]):
s = s.copy()
i = 0
j = 0
while True:
i = (i + 1) & 0xFF
j = (j + s[i]) & 0xFF
s[i], s[j] = s[j], s[i]
t = (s[i] + s[j]) & 0xFF
yield s[t]
local_keystreams = np.zeros((num_keys, 256), dtype=np.uint8)
for i in range(num_keys):
key = np.random.randint(0, 256, size=key_length, dtype=np.uint8).tobytes()
s = ksa(key)
gen = prga(s)
for j in range(256):
local_keystreams[i, j] = next(gen)
return local_keystreams, start_idx
def generate_keystream_data(self, num_keys: int, key_length: int = 16,
n_processes: Optional[int] = None):
"""并行生成密钥流数据"""
if n_processes is None:
n_processes = cpu_count()
print(f"生成密钥流数据中")
start_time = time.time()
chunk_size = num_keys // n_processes
tasks = []
for i in range(n_processes):
start = i * chunk_size
end = (i + 1) * chunk_size if i < n_processes - 1 else num_keys
tasks.append((start, end - start, key_length))
with Pool(n_processes) as pool:
results = pool.map(self._worker_generate_ks, tasks)
self.keystreams = np.zeros((num_keys, 256), dtype=np.uint8)
for ks_chunk, start_idx in results:
self.keystreams[start_idx:start_idx + ks_chunk.shape[0]] = ks_chunk
elapsed = time.time() - start_time
print(f"密钥流数据生成完成,耗时: {elapsed:.2f}s")
print(f"数据形状: {self.keystreams.shape}")
def comprehensive_bias_analysis(self, significance_levels: Dict[str, float] = None):
"""
全面的偏差分析
"""
if self.keystreams is None:
print("请先生成密钥流数据")
return
if significance_levels is None:
significance_levels = {
'high': 0.001 / 256, # Bonferroni校正
'medium': 0.01 / 256,
'low': 0.05 / 256
}
print("开始全面偏差分析...")
start_time = time.time()
num_samples = self.keystreams.shape[0]
expected_prob = 1.0 / 256
self.bias_results = []
self.position_analysis = {}
# 全局统计
total_deviations = 0
max_bias_ratio = 0
strongest_position = 0
for position in range(256):
position_stats = self._analyze_single_position(
position, num_samples, expected_prob, significance_levels
)
self.position_analysis[position] = position_stats
# 记录显著偏差
for bias_info in position_stats.get('significant_biases', []):
bias_result = BiasResult(
position=position,
byte_value=bias_info['byte_value'],
observed_prob=bias_info['observed_prob'],
expected_prob=expected_prob,
bias_ratio=bias_info['bias_ratio'],
z_score=bias_info['z_score'],
p_value=bias_info['p_value'],
significance_level=bias_info['significance_level']
)
self.bias_results.append(bias_result)
if bias_info['bias_ratio'] > max_bias_ratio:
max_bias_ratio = bias_info['bias_ratio']
strongest_position = position
total_deviations += len(position_stats.get('significant_biases', []))
# 计算全局统计
self.global_stats = {
'total_samples': num_samples,
'total_positions': 256,
'total_significant_biases': total_deviations,
'max_bias_ratio': max_bias_ratio,
'strongest_position': strongest_position,
'bias_coverage': total_deviations / 256, # 有偏差的位置比例
'analysis_time': time.time() - start_time
}
print(f"偏差分析完成,耗时: {self.global_stats['analysis_time']:.2f}s")
def _analyze_single_position(self, position: int, num_samples: int,
expected_prob: float, significance_levels: Dict) -> Dict:
"""分析单个位置的偏差"""
observed_counts = np.bincount(self.keystreams[:, position], minlength=256)
# 卡方检验
expected_counts = np.full(256, num_samples * expected_prob)
chi2_stat, p_value = stats.chisquare(f_obs=observed_counts, f_exp=expected_counts)
# 计算每个字节的统计量
significant_biases = []
position_entropy = 0
for byte_val in range(256):
count = observed_counts[byte_val]
observed_prob = count / num_samples
if count == 0:
continue
# Z-score
expected_count = num_samples * expected_prob
std_dev = np.sqrt(num_samples * expected_prob * (1 - expected_prob))
z_score = (count - expected_count) / std_dev
# 偏差倍数
bias_ratio = observed_prob / expected_prob
# 确定显著性水平
significance_level = 'none'
for level_name, level_value in significance_levels.items():
if p_value < level_value and abs(z_score) > 2.5: # 约99%置信度
significance_level = level_name
break
# 只记录显著偏差
if significance_level != 'none':
bias_info = {
'byte_value': byte_val,
'observed_count': count,
'observed_prob': observed_prob,
'bias_ratio': bias_ratio,
'z_score': z_score,
'p_value': p_value,
'significance_level': significance_level
}
significant_biases.append(bias_info)
# 计算熵
if observed_prob > 0:
position_entropy -= observed_prob * np.log2(observed_prob)
# 理想熵值
ideal_entropy = -256 * (expected_prob * np.log2(expected_prob))
entropy_deviation = position_entropy / ideal_entropy if ideal_entropy > 0 else 0
return {
'position': position,
'chi2_statistic': chi2_stat,
'chi2_p_value': p_value,
'entropy': position_entropy,
'entropy_deviation': entropy_deviation,
'significant_biases': significant_biases,
'total_observations': num_samples
}
def generate_detailed_report(self):
"""生成详细分析报告"""
if not self.bias_results:
print("没有可用的偏差分析结果")
return
print("=" * 80)
print("RC4单字节偏差深度分析报告")
print("=" * 80)
# 全局统计
print(f"\n全局统计信息:")
print(f" 样本数量: {self.global_stats['total_samples']:,}")
print(f" 分析位置: {self.global_stats['total_positions']}")
print(f" 显著偏差数量: {self.global_stats['total_significant_biases']}")
print(f" 偏差覆盖率: {self.global_stats['bias_coverage']:.2%}")
print(f" 最强偏差倍数: {self.global_stats['max_bias_ratio']:.3f}x")
print(f" 最强偏差位置: {self.global_stats['strongest_position']}")
# 按显著性级别统计
significance_counts = collections.Counter(
[result.significance_level for result in self.bias_results]
)
print(f"\n 按显著性级别统计:")
for level, count in significance_counts.most_common():
print(f" {level:>6}: {count:>3} 个偏差")
# 前20个最强偏差
print(f"\n 前20个最强偏差:")
sorted_biases = sorted(self.bias_results,
key=lambda x: abs(x.bias_ratio - 1), reverse=True)
for i, bias in enumerate(sorted_biases[:20]):
print(f" 位置 {bias.position:3d}: 字节=0x{bias.byte_value:02x}, "
f"偏差={bias.bias_ratio:6.3f}x, "
f"Z值={bias.z_score:6.2f}, "
f"p值={bias.p_value:.2e}, "
f"显著性={bias.significance_level}")
# 位置分布分析
print(f"\n 位置分布分析:")
biased_positions = set(result.position for result in self.bias_results)
positions_list = sorted(biased_positions)
print(f" 有偏差的位置数量: {len(positions_list)}")
print(f" 位置范围: {min(positions_list)} - {max(positions_list)}")
# 按位置分组显示
print(f"\n 按位置分组的显著偏差:")
position_groups = {}
for bias in sorted_biases[:30]: # 只显示前30个
if bias.position not in position_groups:
position_groups[bias.position] = []
position_groups[bias.position].append(bias)
for position, biases in sorted(position_groups.items()):
print(f" 位置 {position}: ", end="")
bias_strs = []
for bias in biases:
bias_strs.append(f"0x{bias.byte_value:02x}({bias.bias_ratio:.2f}x)")
print(", ".join(bias_strs))
def plot_bias_analysis(self):
"""绘制偏差分析图表"""
if not self.bias_results:
print("没有可用的偏差数据")
return
fig, axes = plt.subplots(2, 2, figsize=(15, 12))
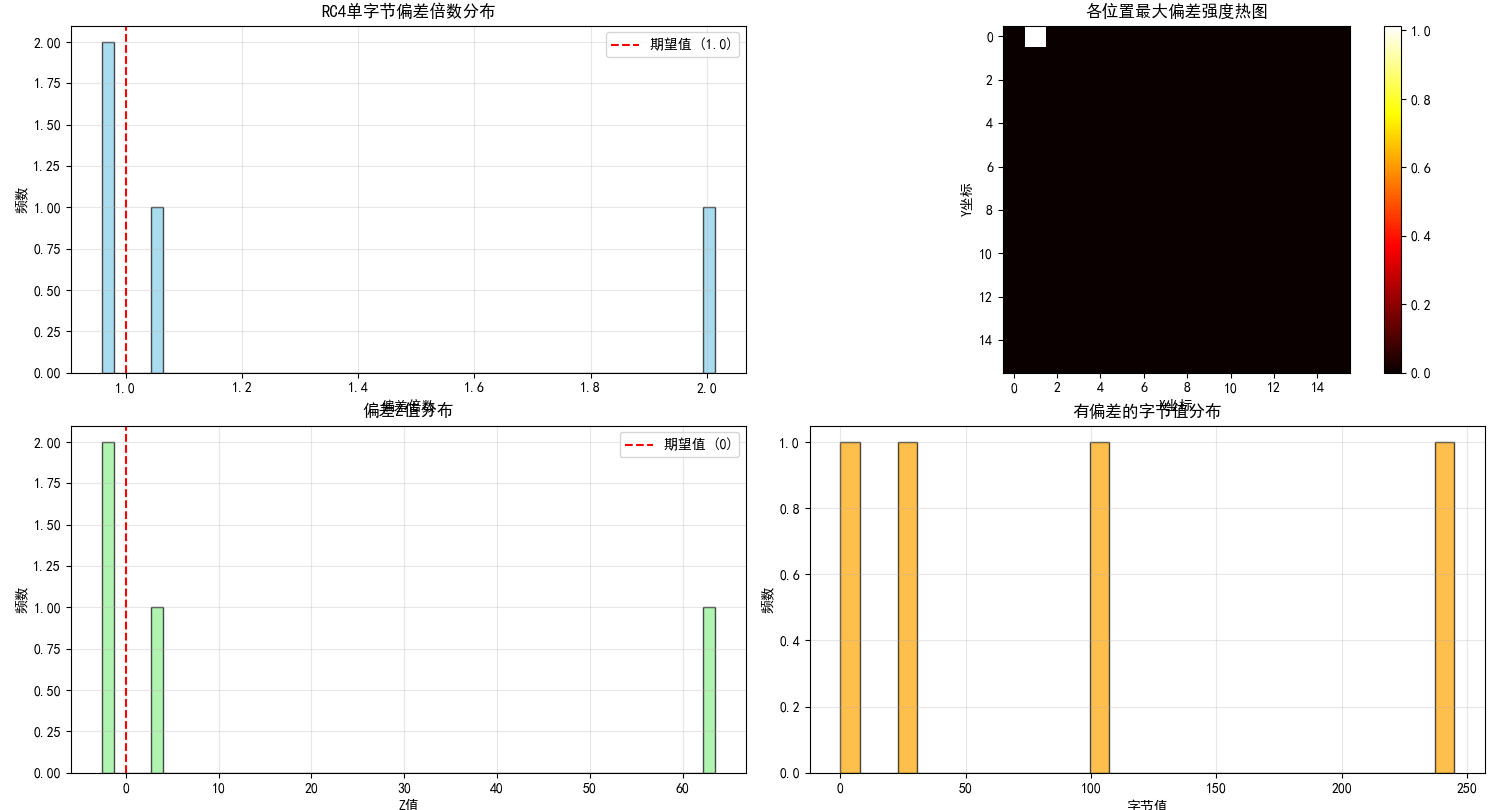
# 1. 偏差倍数分布
bias_ratios = [result.bias_ratio for result in self.bias_results]
axes[0,0].hist(bias_ratios, bins=50, alpha=0.7, color='skyblue', edgecolor='black')
axes[0,0].axvline(x=1.0, color='red', linestyle='--', label='期望值 (1.0)')
axes[0,0].set_xlabel('偏差倍数')
axes[0,0].set_ylabel('频数')
axes[0,0].set_title('RC4单字节偏差倍数分布')
axes[0,0].legend()
axes[0,0].grid(True, alpha=0.3)
# 2. 位置分布热图
position_bias_strength = np.zeros(256)
for result in self.bias_results:
# 使用偏差强度(偏离1的程度)
strength = abs(result.bias_ratio - 1)
position_bias_strength[result.position] = max(
position_bias_strength[result.position], strength
)
im = axes[0,1].imshow(position_bias_strength.reshape(16, 16),
cmap='hot', interpolation='nearest')
axes[0,1].set_title('各位置最大偏差强度热图')
axes[0,1].set_xlabel('X坐标')
axes[0,1].set_ylabel('Y坐标')
plt.colorbar(im, ax=axes[0,1])
# 3. Z值分布
z_scores = [result.z_score for result in self.bias_results]
axes[1,0].hist(z_scores, bins=50, alpha=0.7, color='lightgreen', edgecolor='black')
axes[1,0].axvline(x=0, color='red', linestyle='--', label='期望值 (0)')
axes[1,0].set_xlabel('Z值')
axes[1,0].set_ylabel('频数')
axes[1,0].set_title('偏差Z值分布')
axes[1,0].legend()
axes[1,0].grid(True, alpha=0.3)
# 4. 偏差字节值分布
byte_values = [result.byte_value for result in self.bias_results]
axes[1,1].hist(byte_values, bins=32, alpha=0.7, color='orange', edgecolor='black')
axes[1,1].set_xlabel('字节值')
axes[1,1].set_ylabel('频数')
axes[1,1].set_title('有偏差的字节值分布')
axes[1,1].grid(True, alpha=0.3)
plt.tight_layout()
plt.show()
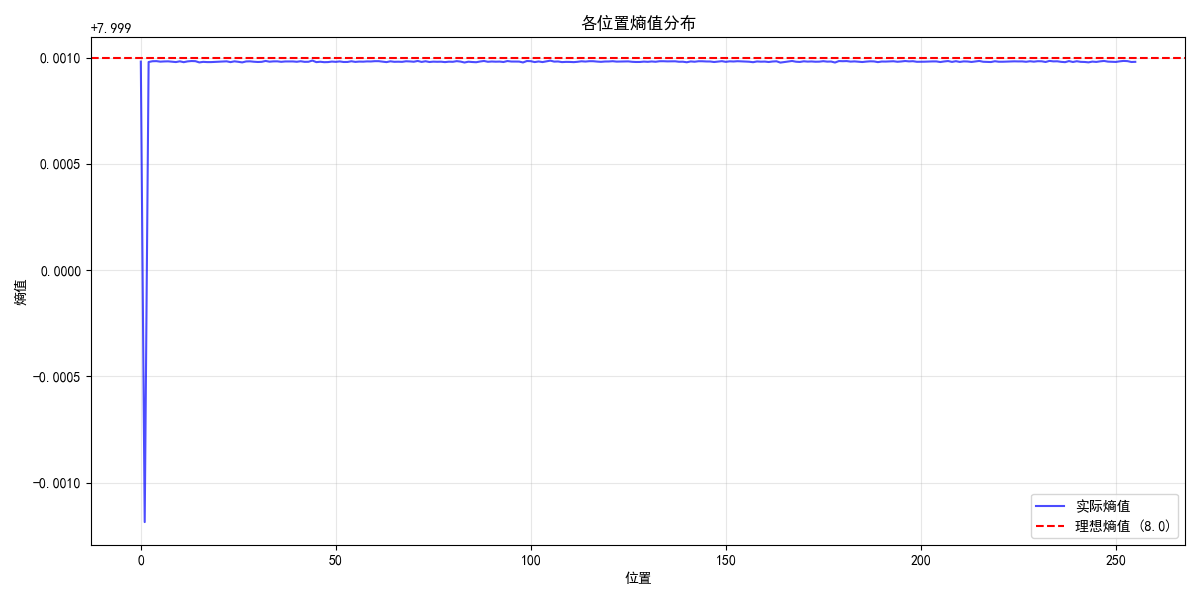
# 额外图表:熵值分析
if self.position_analysis:
fig, ax = plt.subplots(figsize=(12, 6))
positions = list(range(256))
entropy_values = [self.position_analysis[p]['entropy'] for p in positions]
ideal_entropy = 8.0 # 256个均匀分布的熵值
ax.plot(positions, entropy_values, 'b-', alpha=0.7, label='实际熵值')
ax.axhline(y=ideal_entropy, color='red', linestyle='--',
label=f'理想熵值 ({ideal_entropy})')
ax.set_xlabel('位置')
ax.set_ylabel('熵值')
ax.set_title('各位置熵值分布')
ax.legend()
ax.grid(True, alpha=0.3)
plt.tight_layout()
plt.show()
def save_analysis_results(self):
"""保存分析结果"""
if not self.bias_results:
print("没有可用的分析结果")
return
data_to_save = {
'keystreams': self.keystreams,
'bias_results': self.bias_results,
'position_analysis': self.position_analysis,
'global_stats': self.global_stats
}
with open(self.data_file, 'wb') as f:
pickle.dump(data_to_save, f)
print(f"分析结果已保存到: {self.data_file}")
def load_analysis_results(self):
"""加载分析结果"""
if not os.path.exists(self.data_file):
print(f"数据文件不存在: {self.data_file}")
return False
with open(self.data_file, 'rb') as f:
data = pickle.load(f)
self.keystreams = data['keystreams']
self.bias_results = data['bias_results']
self.position_analysis = data['position_analysis']
self.global_stats = data['global_stats']
print(f"分析结果已从 {self.data_file} 加载")
return True
def main():
"""主分析函数"""
analyzer = RC4BiasAnalyzer()
print("RC4单字节偏差深度分析工具")
print("=" * 50)
# 选择模式
print("选择分析模式:")
print("1. 重新生成数据并分析")
print("2. 加载已有数据并分析")
choice = input("请输入选择 (1/2): ").strip()
if choice == "1":
# 重新生成数据
num_keys = int(input("生成的密钥数量 (推荐: 1000000): ") or "1000000")
key_length = int(input("密钥长度 (默认: 16): ") or "16")
analyzer.generate_keystream_data(num_keys, key_length)
analyzer.comprehensive_bias_analysis()
analyzer.save_analysis_results()
elif choice == "2":
# 加载已有数据
if not analyzer.load_analysis_results():
return
else:
print("无效选择")
return
# 生成报告和图表
analyzer.generate_detailed_report()
analyzer.plot_bias_analysis()
# 额外统计信息
print("\n" + "=" * 50)
print("额外统计信息")
print("=" * 50)
# 计算不同类型偏差的统计
if analyzer.bias_results:
positive_biases = [b for b in analyzer.bias_results if b.bias_ratio > 1]
negative_biases = [b for b in analyzer.bias_results if b.bias_ratio < 1]
print(f"正偏差 (概率偏高): {len(positive_biases)} 个")
print(f"负偏差 (概率偏低): {len(negative_biases)} 个")
if positive_biases:
avg_positive = np.mean([b.bias_ratio for b in positive_biases])
max_positive = max([b.bias_ratio for b in positive_biases])
print(f"正偏差平均倍数: {avg_positive:.3f}x")
print(f"正偏差最大倍数: {max_positive:.3f}x")
if negative_biases:
avg_negative = np.mean([b.bias_ratio for b in negative_biases])
min_negative = min([b.bias_ratio for b in negative_biases])
print(f"负偏差平均倍数: {avg_negative:.3f}x")
print(f"负偏差最小倍数: {min_negative:.3f}x")
if __name__ == "__main__":
#受不了了,设置matplotlib中文字体
plt.rcParams['font.sans-serif'] = ['SimHei', 'DejaVu Sans']
plt.rcParams['axes.unicode_minus'] = False
main()

 浙公网安备 33010602011771号