


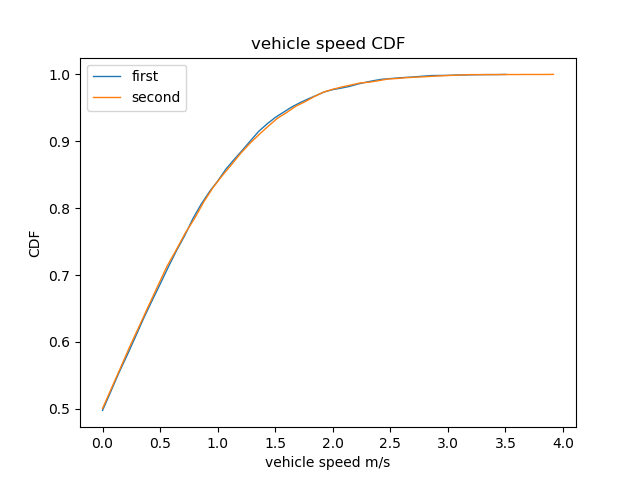
 1 import numpy as np
 2 import statsmodels.api as sm # recommended import according to the docs
 3 import matplotlib.pyplot as plt
 4
 5 # sample = np.random.uniform(0, 1, 10000)
 6 sample = np.random.randn(10000)
 7 ecdf = sm.distributions.ECDF(sample)
 8 x = np.linspace(0, max(sample))
 9 y = ecdf(x)
10 plt.plot(x, y, linewidth = '1',label='first')
11
12 sample = np.random.randn(10000)
13 ecdf = sm.distributions.ECDF(sample)
14 x = np.linspace(0, max(sample))
15 y = ecdf(x)
16 plt.plot(x, y, linewidth = '1',label='second')
17
18 # x = np.linspace(min(sample), max(sample))
19 plt.xlabel('vehicle speed m/s')
20 plt.ylabel('CDF')
21 plt.title('vehicle speed CDF')
22
23
24 plt.legend(loc='upper left')
25 plt.show()

 浙公网安备 33010602011771号