MatLab---for循环绘图+subplot+for循环嵌套
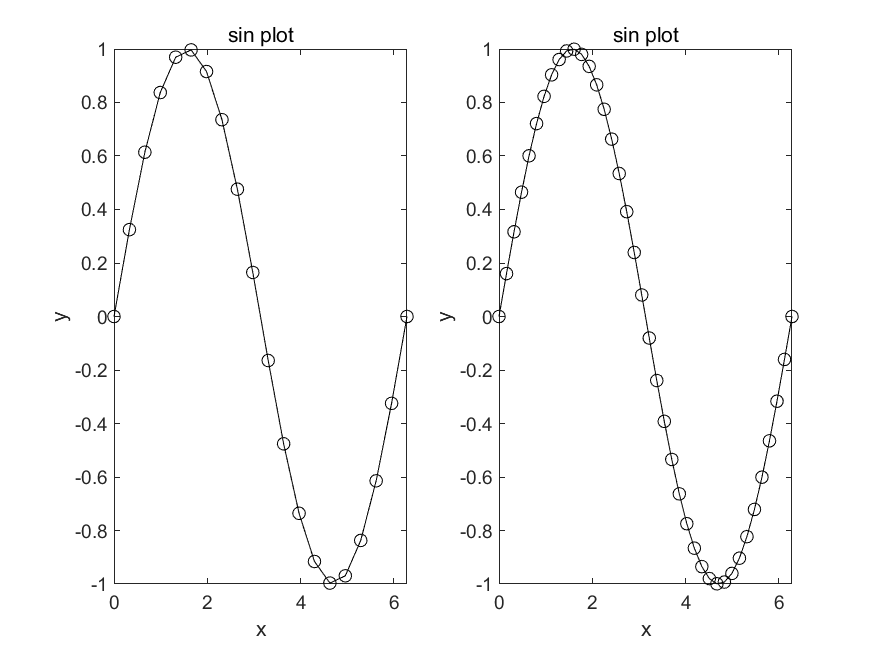
1.for的循环绘图
n=2;
for i=1:n
x=linspace(0,2*pi,20*i);
y=sin(x);
subplot(1,n,i);
plot(x,y,'ko-');
xlabel('x');
ylabel('y');
title('sin plot');
end
2.for循环的嵌套
rows=4;
columns=5;
mat=NaN(rows,columns);
for i=1:rows
for j=1:columns
mat(i,j)=i*j;
end
end
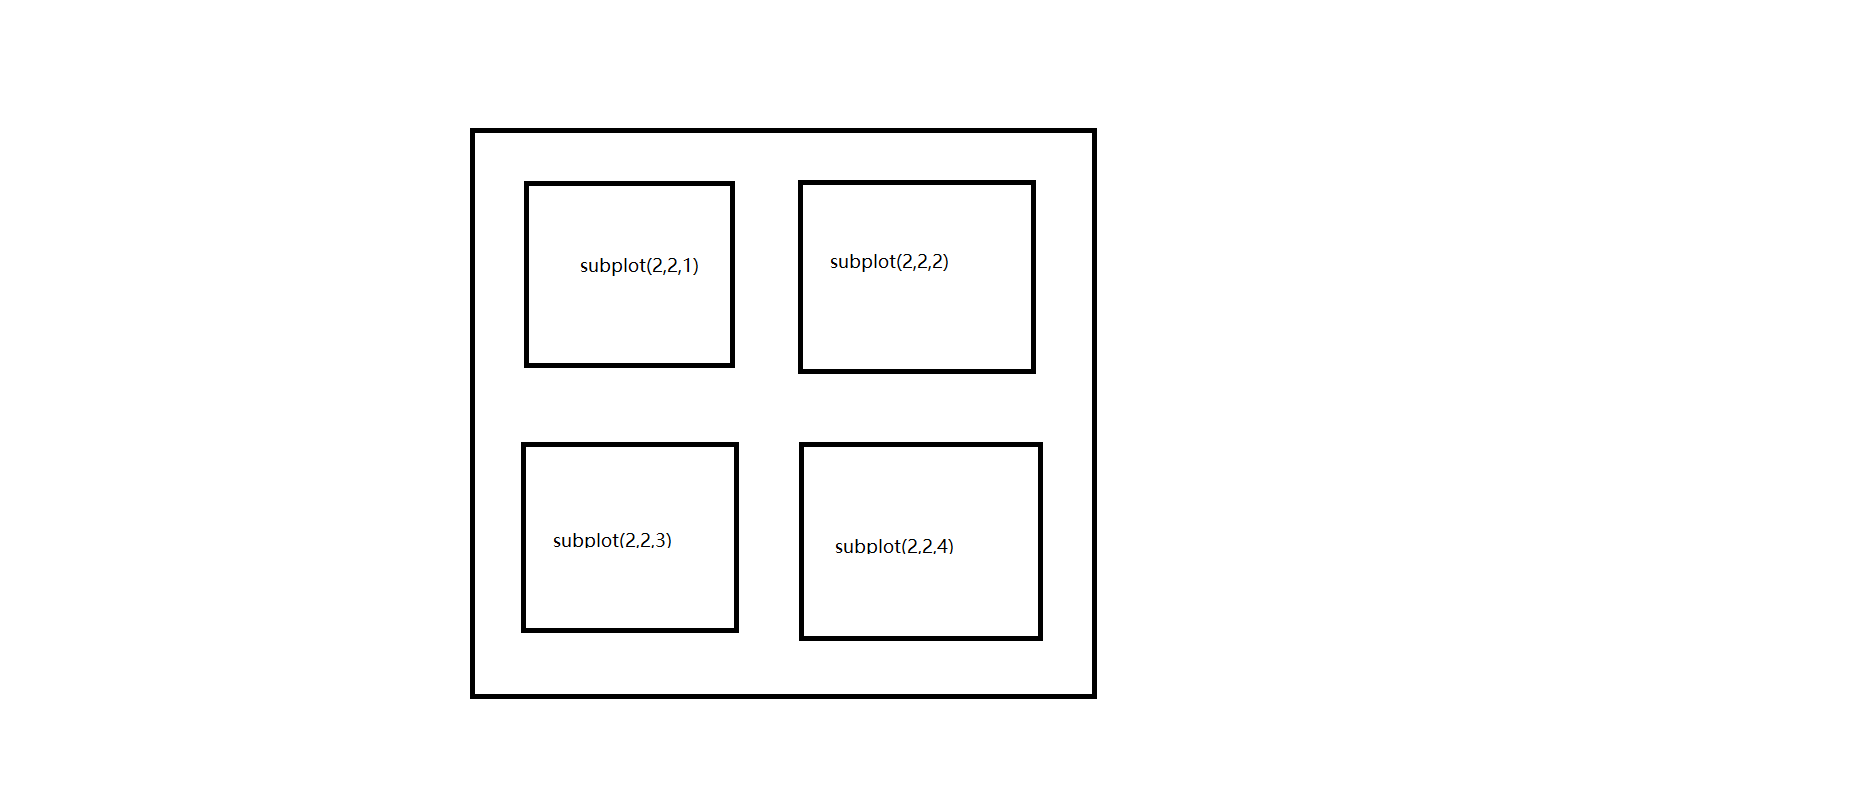
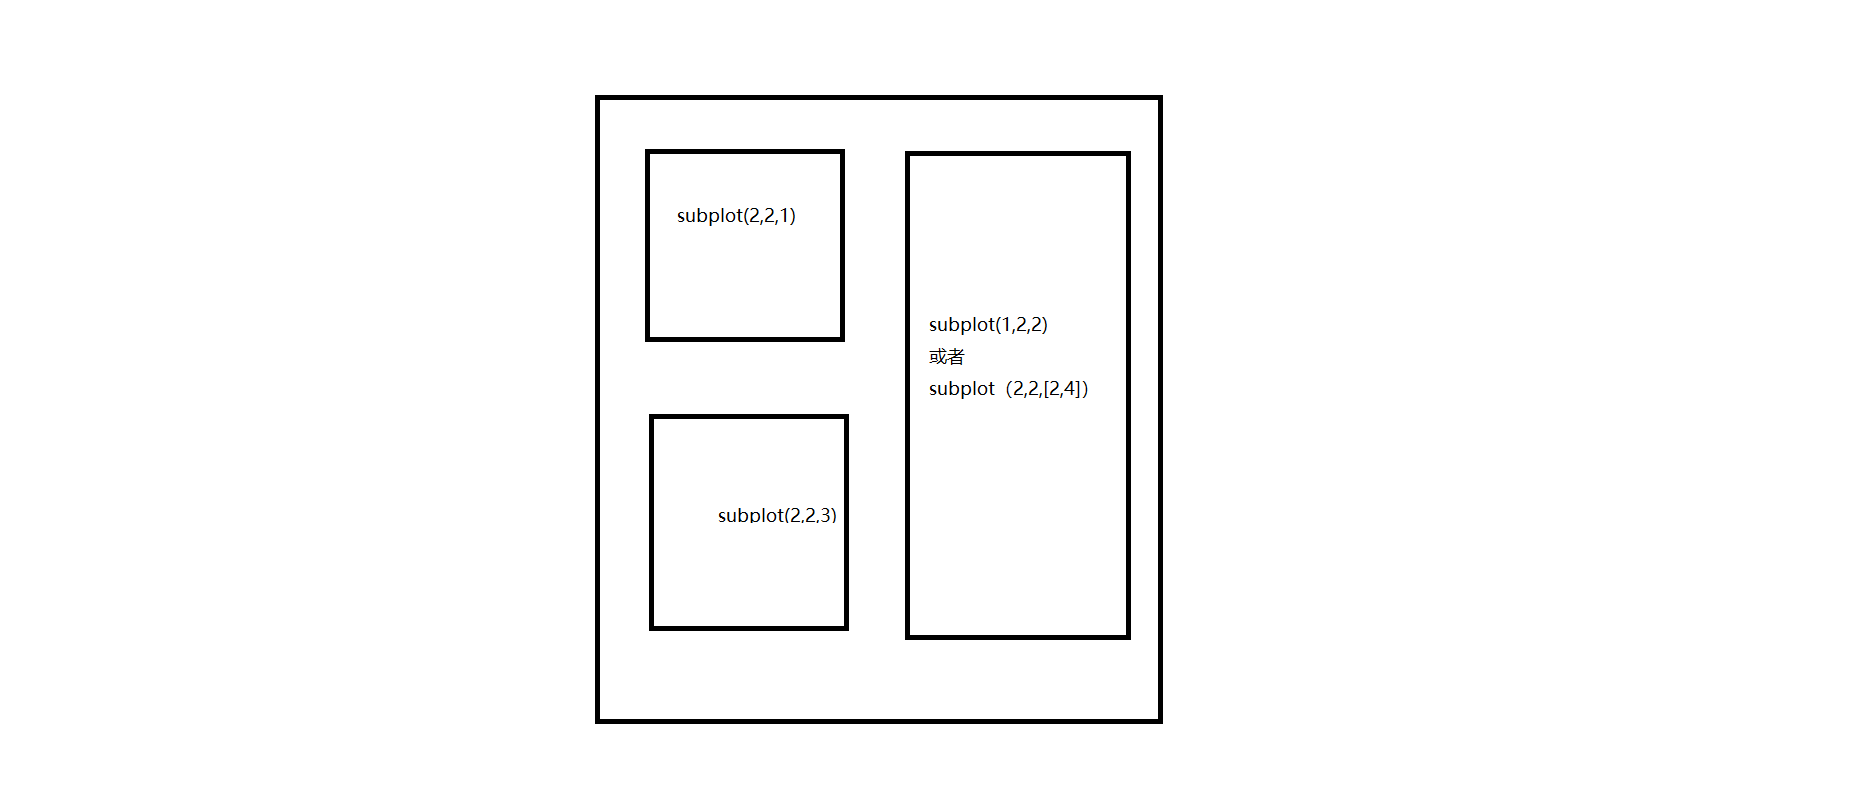
3.subplot的使用

 浙公网安备 33010602011771号